| AIR POLLUTION IN THE CZECH REPUBLIC IN 2011 Czech Hydrometeorological Institute - Air Quality Protection Division |
|
|
|
|
|
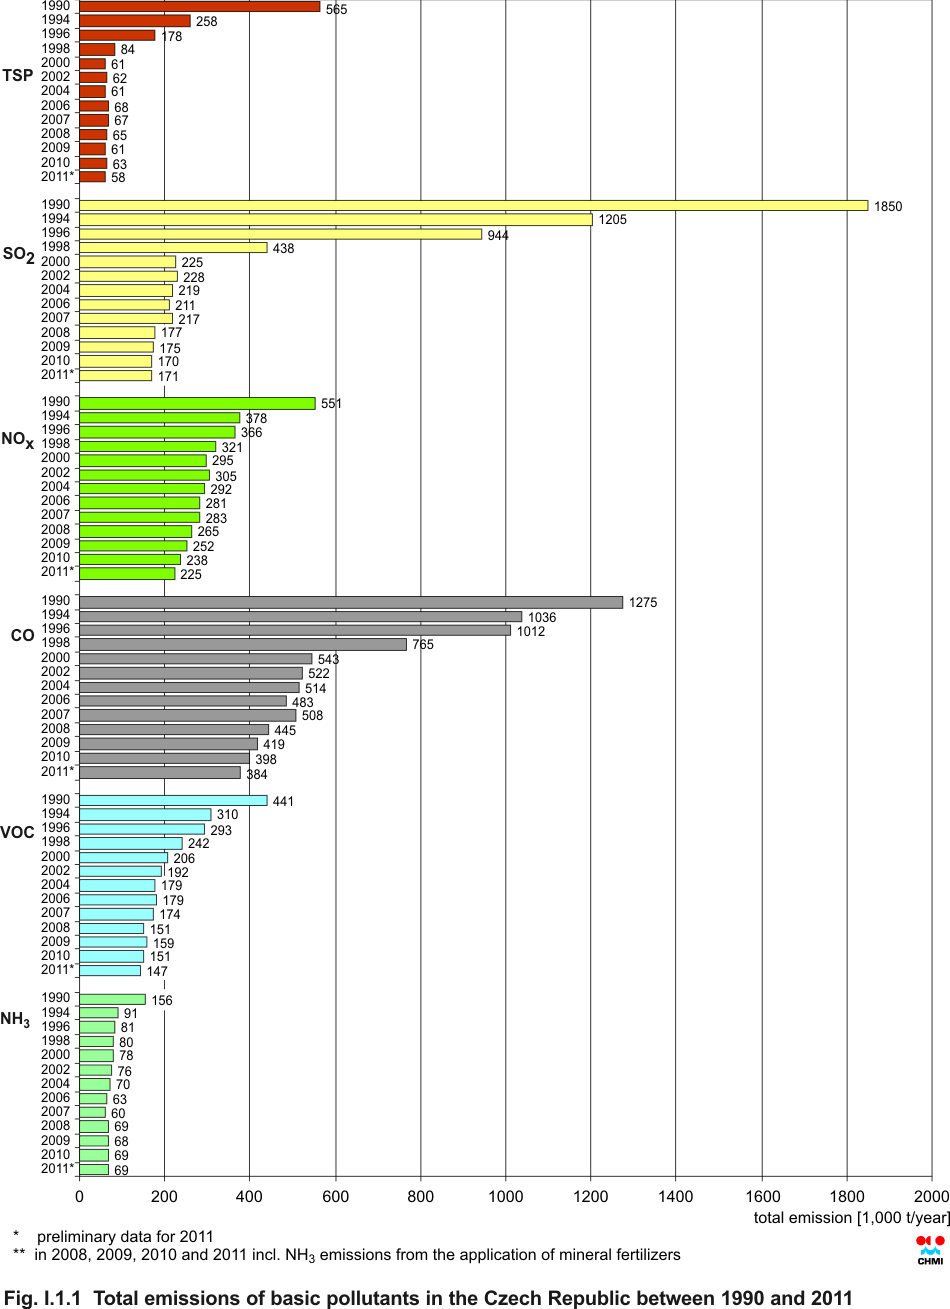
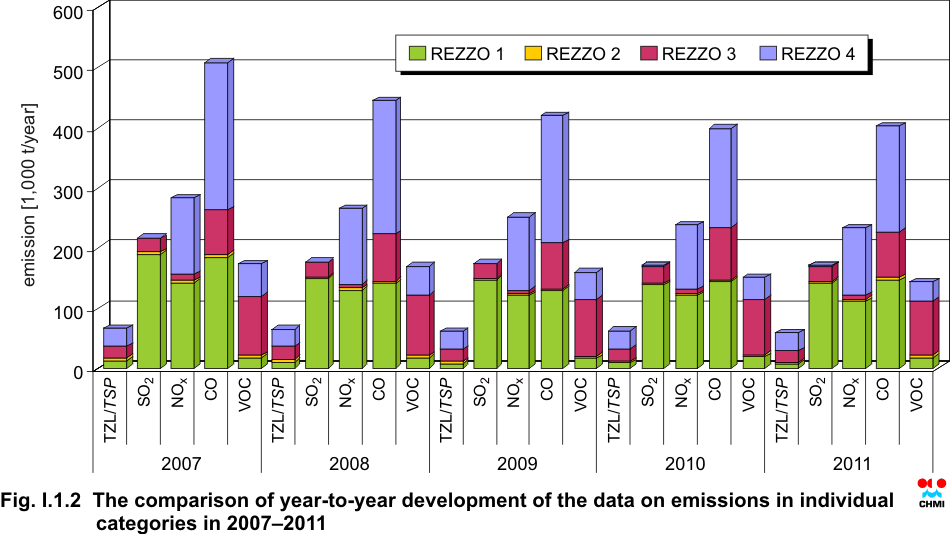
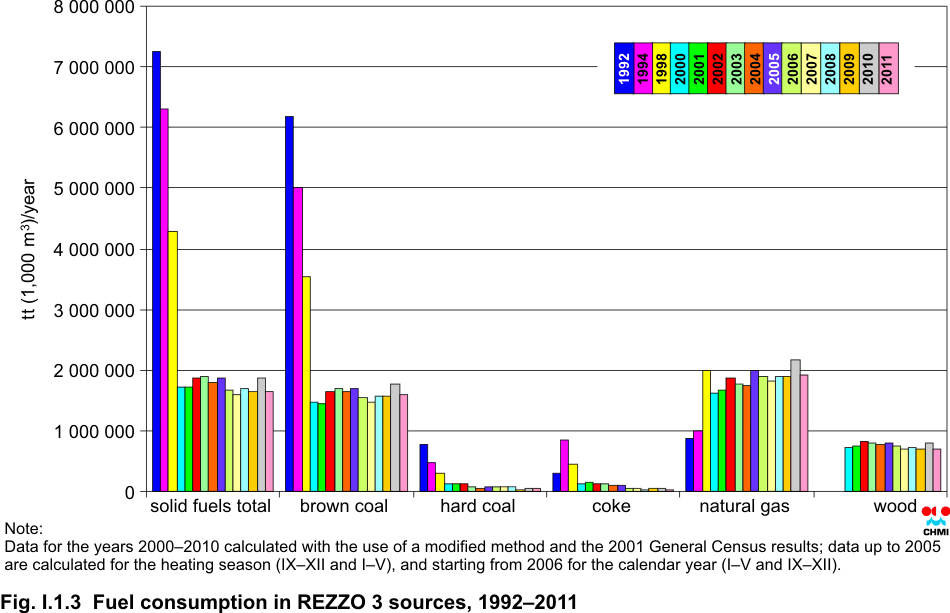
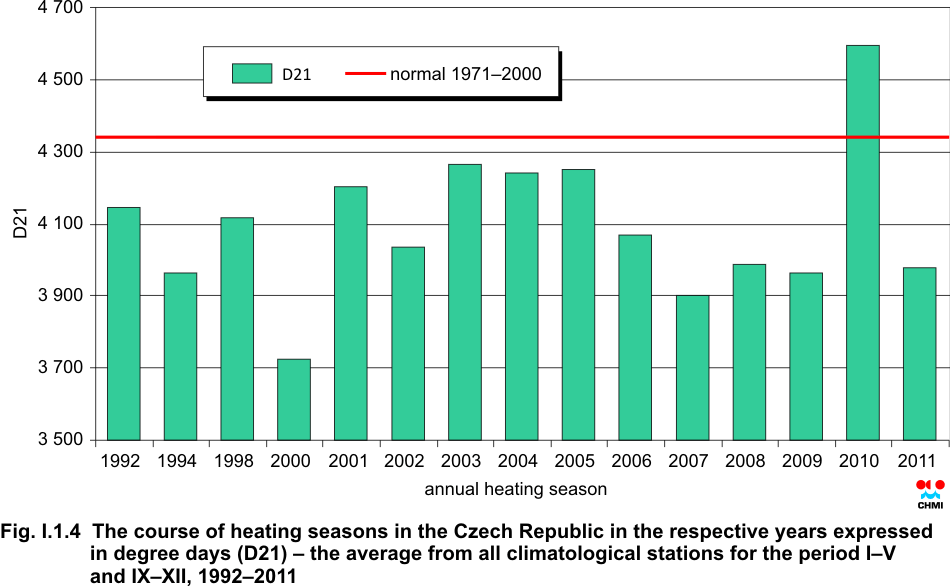
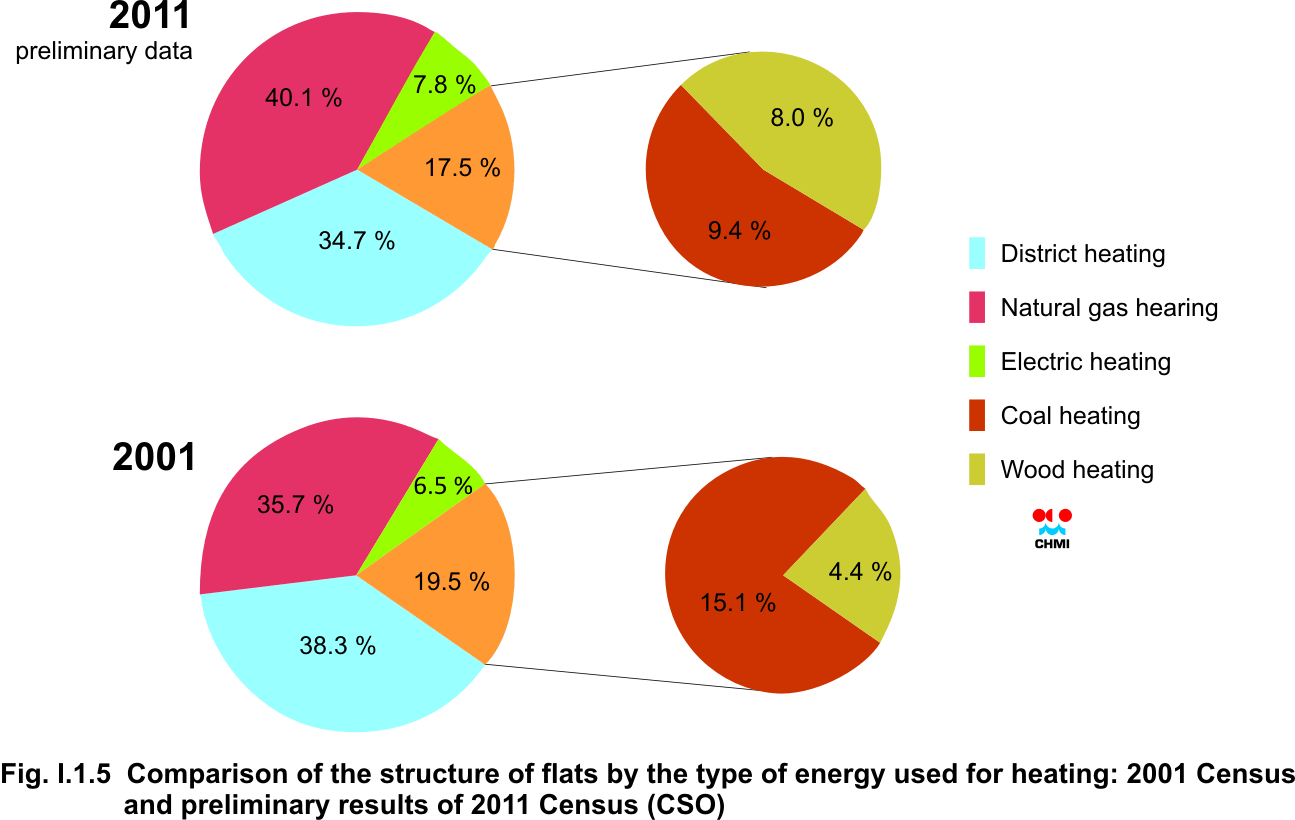
I. ATMOSPHERIC POLLUTANTS EMISSION IN THE CZECH REPUBLIC The Department of Emissions and Sources has been authorized by the Ministry of the Environment to carry out emission inventories of air pollutants and greenhouse gases. In addition to the national and sector inventories, also inventories based on administrative units are produced (regions or districts). The methods are described at the websites www.chmi.cz under “AIR QUALITY”/”Emission inventory”. I.1 Atmospheric pollutants’ emissions Pursuant to the legislation which came into force in 2002 air pollution sources are divided into several categories to carry out emission inventories. Complying with this categorisation, the Air Quality Information System (ISKO) operated by CHMI includes REZZO databases (Register of Emissions and Air Pollution Sources) which serve for archiving and presenting data on stationary and mobile air pollution sources. Extra large, large and medium-sized air pollution sources are monitored individually as point sources, small sources at regional and local (only household heating) level as area sources and mobile sources as line sources (road transport in sections controlled by vehicle census) and as area sources at regional level (other mobile sources). I. Extra large and large sources – REZZO 1 The collection of data of the 2011 Summary operational records of extra large, large and medium-sized sources which are the basis of the REZZO 1 and 2 databases, used the forms the contents of which is set by the Decree of the Ministry of the Environment No. 205/2009 Coll. The list of data of Summary operational records is given in Annex 7. Similarly as in the previous year the reporting procedure was carried out according to the requirements of the Act No. 25/2008 Coll., i. e. through the Integrated System of Compliance with Reporting Duty in Environmental Areas (ISPOP). Due to the change of legislation the reporting duty was cancelled for animal breeding and filling stations with other fuels than petrol which resulted in the reduction of the number of subjects to approximately 22 000. The first reported data of Summary operational records were available already in early April, and in the following six months the reported data were reviewed and, if necessary, the suppliers were asked to correct the erroneous data. More detailed information to the control mechanism of the Summary operational records are presented at portal.chmi.cz/files/portal/docs/uoco/oez/emise/evidence/2010/kontrola2.html. Final data on emissions of mainly mobile sources and several stationary sources monitored as area sources are not available by the deadline of the Yearbook. Consequently, emission data for the year 2011 presented in the tables are preliminary. Table I.1.1 documents data on total emissions of basic air pollutants in 2011, and namely total suspended particles (TSP), SO2, NOx, CO, volatile organic compounds (VOC) and ammonia (NH3), and the shares contributed by each of the emission source categories to total air pollutant emissions. Preliminary data on the amount of emissions of basic pollutants in 2011 are shown in Tab. I.1.2. The development of total emissions of basic pollutants in 1990–2011 is shown in Fig. I.1.1. In comparison with the year 2010 there was recorded again the decrease of emissions in almost all basic pollutants. The comparison of year-to-year development of the data on emissions in individual categories in 2008–2011 is presented in Fig. I.1.2. Emissions from the monitored area sources in the Czech Republic The air pollution sources monitored within the REZZO 3 include emissions from household heating, fugitive dust emissions from building and agricultural activity, ammonia emissions from non-monitored breeding of farm animals and application of mineral fertilizers and VOC emissions from the use of organic solvents. With the exception of emissions from household heating, other groups of sources are calculated exclusively with the use of data obtained within the national statistical monitoring and the potential year-to year changes ensue usually from the development of basic statistical indicators. On the contrary, the year-to year changes of the amount of emissions from household heating are dependent primarily on the character of the heating season, which is expressed in the model by the number of degree days (Fig. I.1.4), and on the changes of the compositions of combustions appliances. In the first half of the year 2011 the preliminary results of the 2011 Census were published. The comparison of these data with the results of the 2001 Census (Fig. I.1.5) shows that the number of households using solid fuels for heating decreased only minimally. However, the proportion between coal and wood combustions has changed significantly. The REZZO 3 methodology cannot cover the changes of the ten-year period between Census 2001 and Census 2011. The calculation of emissions for the year 2011 is still based on the structure of flats according to the 2001 Census. The inclusion of the results of the 2011 Census into the new methodology of REZZO 3 will not be accomplished until 2013. The preliminary estimates suggest that the update of the structure of flats and the types of heating will results in the decrease of all emissions of basic pollutants, e.g. TSP by 10 %, SO2 by 25 %, NOx by 17 %. Emissions from extra large combustion sources and their share on total emissions Pursuant to Art. 4, par. (5a) of the Clean Air Act No. 86/2002 Coll., air pollution sources with rated thermal input equal to or greater than 50 MW are classified as extra large combustion sources. These sources are bound by the reporting obligation pursuant to the Directive 2001/80/EC of the European Parliament and the Council on the limitation of emissions of certain pollutants into the air from large combustion plants. Within CHMI this reporting is ensured by the Emissions and Sources Department. In addition to basic pollutants, monitored as a rule by continuous measurements, also measurements of emissions of heavy metals and POPs are carried out in these sources once in three years and namely:
Other pollutants, included in the emission inventory and not reported within the Summary operational records, are calculated with the use of emission factors and the amount of consumed fuel. The most significant share of extra large combustion sources
in total emissions of stationary sources is as follows: SO2 (58.6 %)
and NOx (32.5 %); on the contrary, the contribution of TSP emissions
is low (5.5 %). Cadmium and mercury emissions share exceeds 50 %; on the
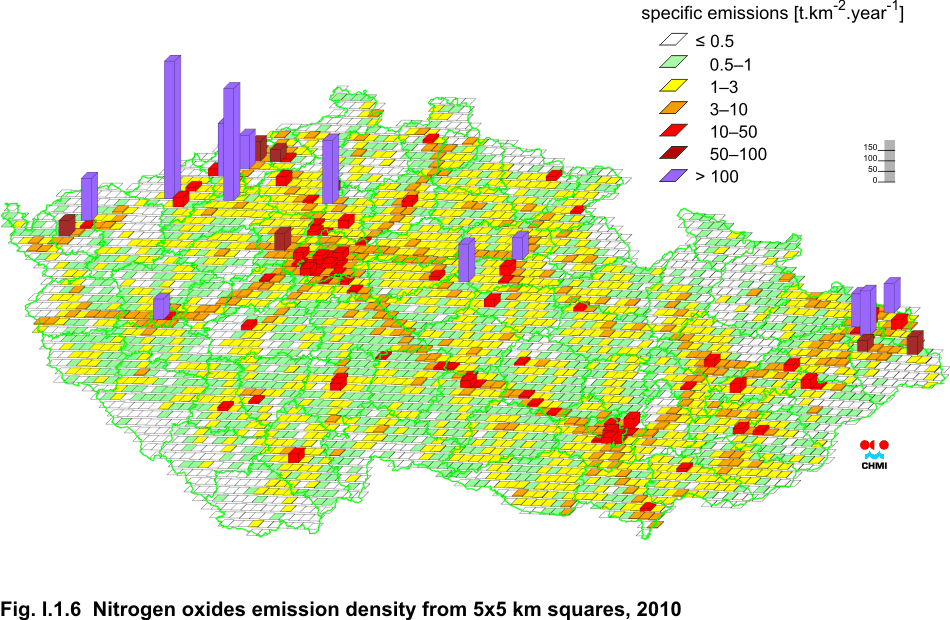
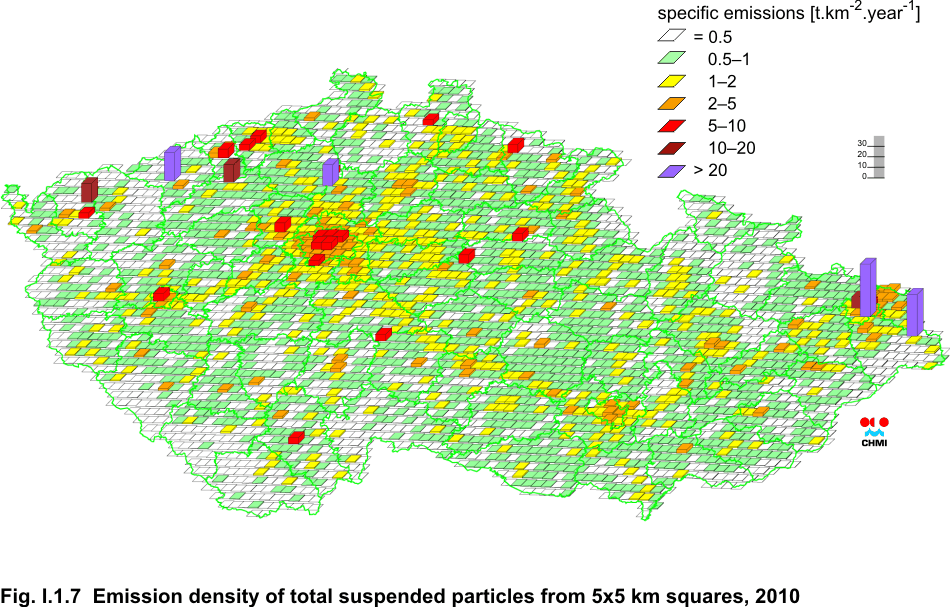
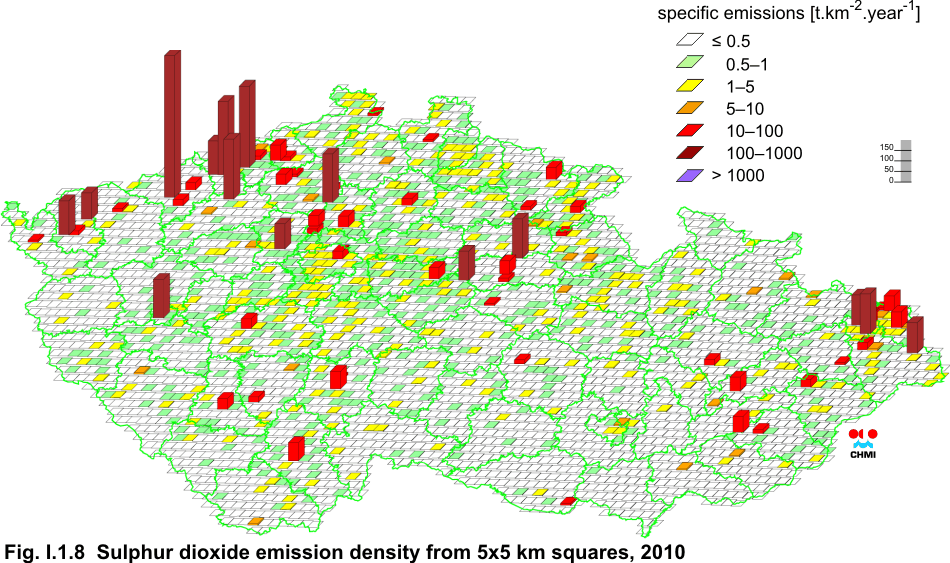
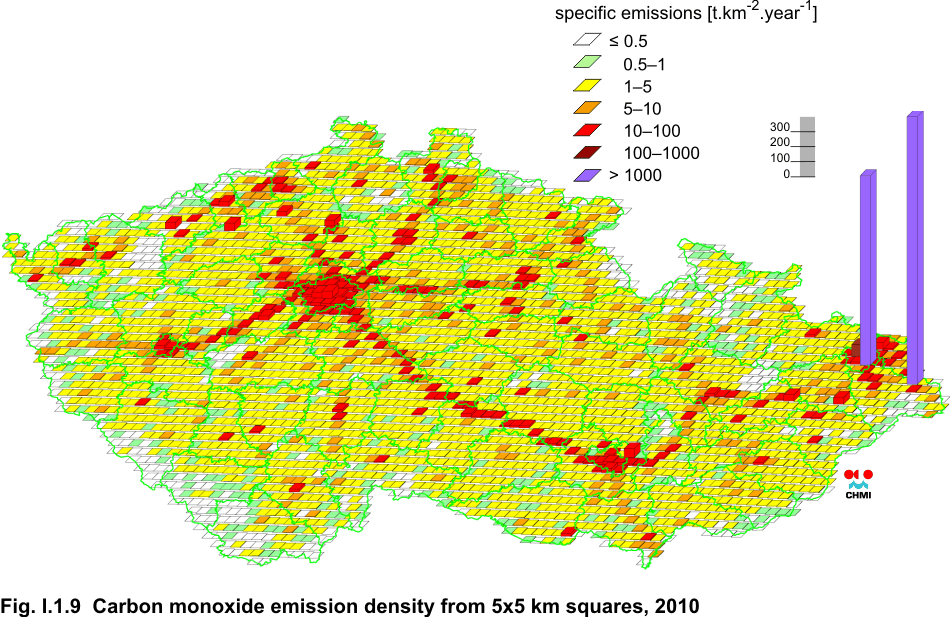
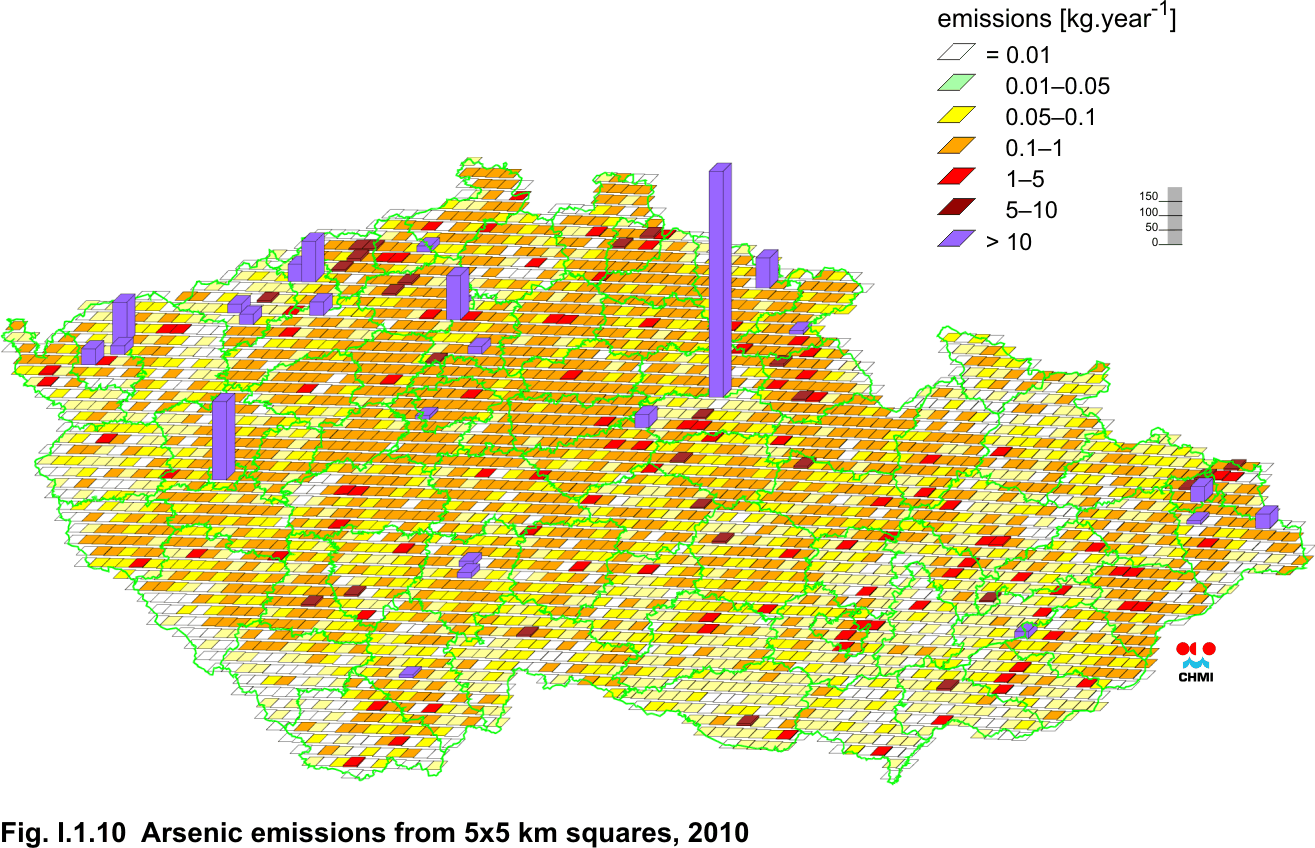
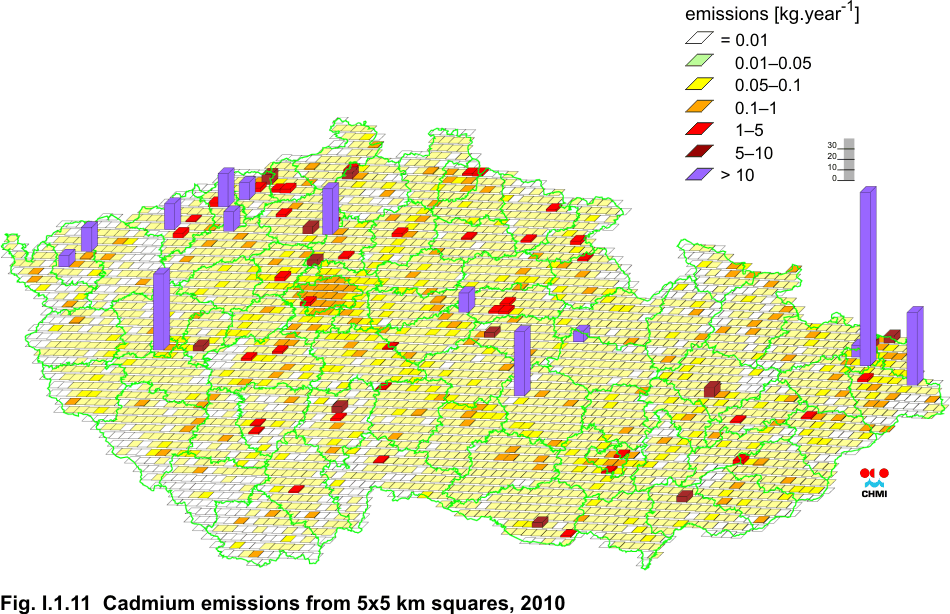
contrary in POP emissions it does not reach even 5 %. Emission densities in 5 x 5-km grid squares Emission data processed into charts with the help of GIS are shown in Figs. I.1.6–I.1.11. Emission densities for NOx, TSP, sulphur dioxide and carbon monoxide and arsenic and cadmium emissions are plotted in 5x5-km grid-squares. The charts are based on emissions from stationary sources (REZZO 1 to 3) and mobile sources (REZZO 4) for the year 2010, with regional disaggregation of emissions from line sources according to the updated 2010 vehicle census. Assessment of emission development In the monitored categories of REZZO 1–4 the majority of emissions recorded the decrease as against the year 2010. The year-to-year development was influenced mainly by more favourable temperature conditions of the 2011 season, which resulted in the decrease of emissions both from household heating and heating plants. Moreover, the lingering economic recession caused lower demand for electric energy. Similarly as in the previous years emissions from mobile sources decreased, mainly due to the car fleet exchange. During the year 2012 all data from REZZO 1 for the years 1980–2008 were transferred to the new emission database and the review of the registered emission data for the period 2000–2010 was carried out. Further, data for the newly monitored groups of sources (emissions from building activity, use of nitrogen fertilizers etc.) were updated. Tab. I.1.1 Total emissions of basic air pollutants in 2010 – final data Tab. I.1.2 Total emissions of basic air pollutants in 2011 – preliminary data
Fig. I.1.1 Total emissions of basic pollutants in the Czech Republic between 1990 and 2011
Fig. I.1.2 The comparison of year-to-year development of the data on emissions in individual categories in 2007–2011
Fig. I.1.3 Fuel consumption in REZZO 3 sources, 1992–2011
Fig. I.1.4 The course of heating seasons in the Czech Republic in the respective years expressed in degree days (D21) – the average from all climatological stations for the period I–V and IX–XII, 1992–2011
Fig. I.1.5 Comparison of the structure of flats by the type of energy used for heating: 2001 Census and preliminary results of 2011 Census (CSO)
Fig. I.1.6 Nitrogen oxides emission density from 5x5 km squares, 2010
Fig. I.1.7 Emission density of total suspended particles from 5x5 km squares, 2010
Fig. I.1.8 Sulphur dioxide emission density from 5x5 km squares, 2010
Fig. I.1.9 Carbon monoxide emission density from 5x5 km squares, 2010
Fig. I.1.10 Arsenic emissions from 5x5 km squares, 2010
Fig. I.1.11 Cadmium emissions from 5x5 km squares, 2010
|