| AIR POLLUTION IN THE CZECH REPUBLIC IN 2011 Czech Hydrometeorological Institute - Air Quality Protection Division |
|
|
|
|
|
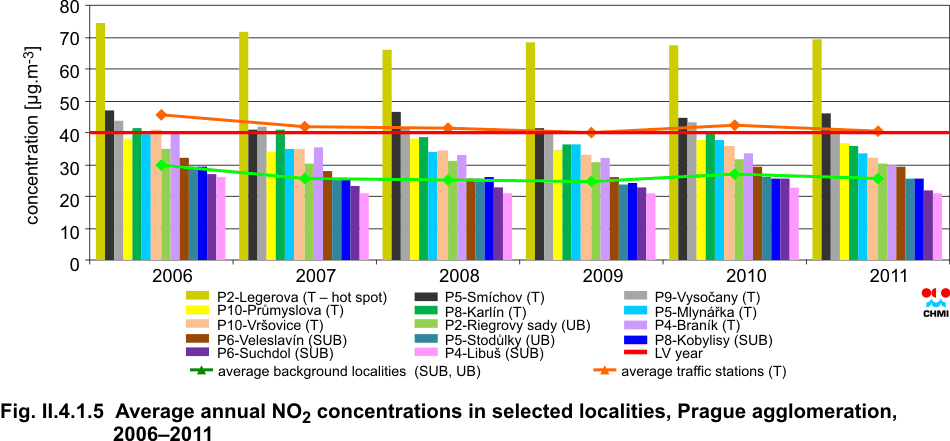
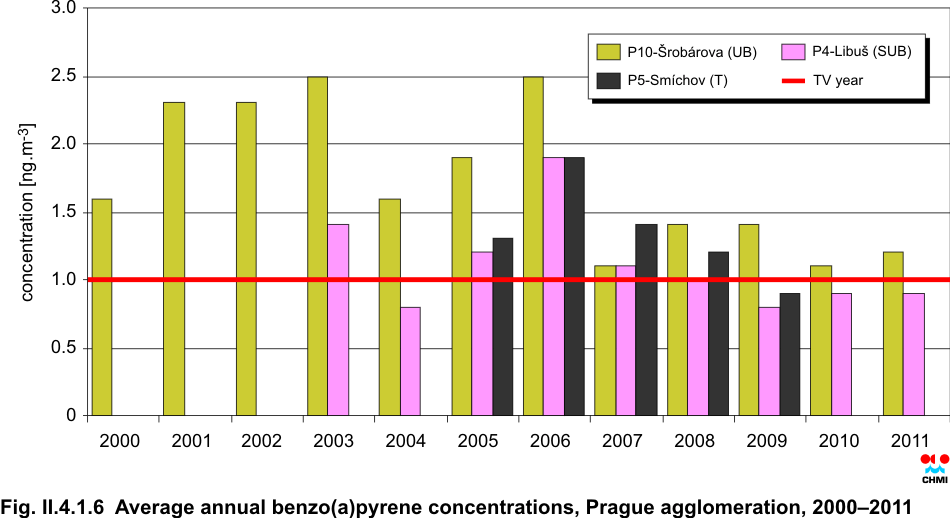
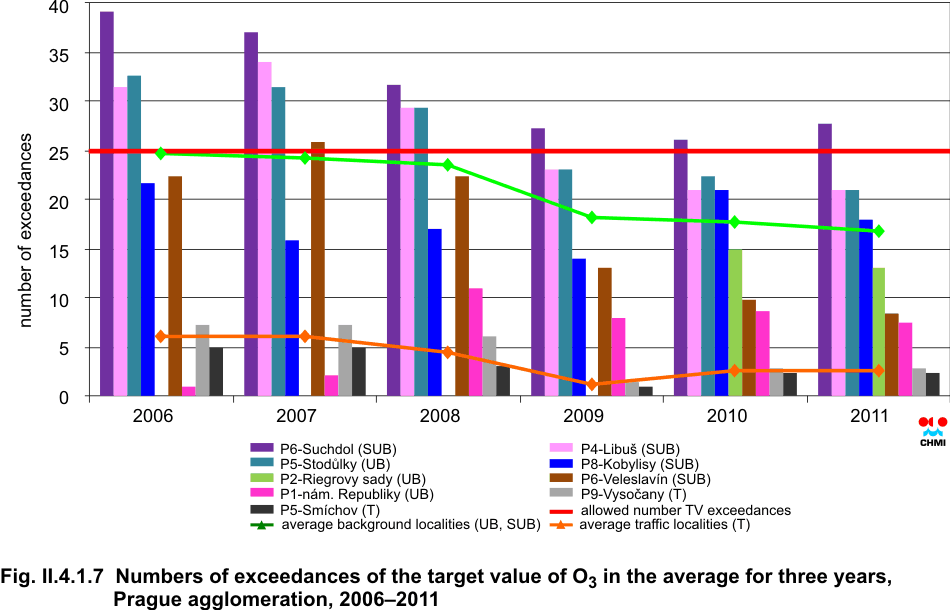
II.4.1 Agglomerations With regard to the Communication of the Air Quality Protection Division of the Ministry of Environment on delineating zones and agglomerations within the territory of the Czech Republic, air quality assessment in the proposed agglomerations (Prague, Brno and the Moravian-Silesian Region) has been treated with more attention since 2005. In addition to the above agglomerations, special attention is paid in this Yearbook also to the zone ├Üst├Ł nad Labem Region due to the concentration of industrial plants, higher population density and also due to the recorded above-the-limit concentrations of some pollutants. Another subchapter contains the assessment of the situation in the zones Hradec Kr├Īlov├® Region and Pardubice Region. II.4.1.1 Prague The Capital City of Prague is the area in which a lot of people are exposed to ambient air pollution. As concerns ambient air assessment Prague belongs among agglomerations. In the Prague agglomeration the limit values for suspended particles, sulphur dioxide and target values for benzo(a)pyrene and ground-level ozone are exceeded in the long term. Most of the limit values and target values exceedances are connected with significant traffic loads of the capital, but also with household heating, mainly in the built-up areas with family houses. The share of mobile sources in total emissions of TSP in the Prague agglomeration amounts to more than 70 %, in total emissions of NOx approximately 60 %. Small sources (mainly local heating) represent the second most important source of TSP and SO2. Generally it can be stated that air pollution situation in 2011 in the territory of the Prague agglomeration was similar like that of the year 2010. The limit values/target values for PM10, NO2, BaP, arsenic and ground-level ozone were exceeded. A slight increase of PM10 concentrations at background stations was recorded, and, on the contrary, PM10 and NO2 concentrations decreased a little at traffic stations. Benzo(a)pyrene concentrations are comparable with the levels of concentrations in the year 2010. Ozone concentrations exceed the target value repeatedly only at one background station. As concerns further pollutants (PM2.5, SO2, CO, benzene, lead, cadmium and nickel), there is no problem to meet their respective limit/target values. Suspended particles of PM10 and PM2.5 In 2011 the concentrations of suspended particles of PM10 fraction were monitored in Prague in 18 CHMI localities and in 3 Z├Ü localities. The 24-hour PM10 limit value (the value 50 ╬╝g.m-3 must not be exceeded more than 35x in one year) was exceeded in 12 of 16 localities with sufficient number of data for the assessment, i.e. in 75 % (in 2010 the limit value was exceeded in 10 of 17 localities, i.e. in 59 % of localities). Half of 12 localities, in which the limit value was exceeded, are clasified as traffic localities, half as suburban and urban background localities (Fig. II.4.1.1). The average 24-hour concentration at traffic stations slightly decreased in the-year-by-year comparison, while at background stations it is continuously increasing from 2008. At the station Prague 2-Legerova (hot spot) there was not sufficient number of valid data for the assessment of the level of air pollution caused by PM10 and PM2.5 particles due to the change of measuring instruments in 2011. In 2011 the annual PM10 limit value (40 ╬╝g.m-3) was not exceeded in any locality of 20 localities relevant for the assessment of annual concentrations. In the year-to-year comparison the average annual concentrations decreased at traffic stations, while the concentrations at background stations continue to slightly increase (Fig. II.4.1.3). As a rule, high concentrations of suspended PM10 and PM2.5 particles and the most frequent exceedances of 24-hour limit value of PM10 are reached in the cold period of the year due to the higher emissions of TSP caused both by higher intensity of heating (incl. local heating) and higher emissions from traffic (increased increased abrasion of road surface by spreading and the subsequent re-suspension of the abraded material) both by less favourable meteorological conditions for the dispersion of pollutants. In the Prague agglomeration the level of 24-hour limit value was exceeded most frequently in the months JanuaryŌĆōMarch and November (Fig. II.4.1.2), both at traffic stations and at background stations. In 2011 the signal of warning within the Smog Regulation and Warning System due to increased concentrations of PM10 was announced, namely from 14 November, 2 p.m. to 25 November, 16 p.m. The concentrations of fine PM2.5 particles were measured in 5 CHMI localities and in 1 Z├Ü locality in 2011. Similarly as in the previous years the valid target value was not exceeded in the territory of the Prague agglomeration (Fig. II.4.1.4). There were two exceptions, and namely the year 2005 when the target value way exceeded at one traffic locality, and the year 2006 when the exceedances occurred at two traffic localities. All three localities (Prague 4-Libu┼Ī, Prague 10-┼Ārob├Īrova, Prague 9-Vyso─Źany), for which data are available for the years 2010 and 2011, the average annual PM2.5.concentration decreased in the year-by-year comparison. In 2011 the highest average annual concentration (20.2 ╬╝g.m-3) was recorded in the locality Prague 2-Riegrovy sady. Nitrogen dioxide NO2 concentrations were measured in 15 CHMI localities and 5 Z├Ü localities in Prague in 2011. The hourly limit value of NO2 (200 ╬╝g.m-3) was exceeded only in one of 15 localities (the localities with sufficient number of data for the assessment). The value 200 ╬╝g.m-3 was exceeded in the locality Prague 2-Legerova 51x. The tolerated number of exceedances is 18. The highest 19th hourly concentration at this locality reached 288 ╬╝g.m-3. The annual air pollution limit value for NO2 (40 ╬╝g.m-3) was exceeded in 5 of 20 localities in the Prague agglomeration (Fig. II.4.1.5), and namely in the localities Prague 2-Legerova (the annual average concentration reached the value of 69.5 ╬╝g.m-3), Prague 5-Sm├Łchov (46.1 ╬╝g.m-3, Prague 10-┼Ārob├Īrova (44.6 ╬╝g.m-3), Prague 9-Vyso─Źany (40.9 ╬╝g.m-3) and Prague 5-Svornosti (40.4 ╬╝g.m-3). Generally, it can be stated, that NO2 concentrations in the territory of the Prague agglomeration decreased in most localities in the year-by-year comparison. The average annual concentrations of NO2 decreased or stayed at the same level at more than 80 % of stations, the maximum highest 19th concentrations decreased or remained at the same level at more than 70 % of stations. However, it can be expected that the exceedance of the limit values can occur also in other localities exposed to traffic, where there are no measurements. Benzo(a)pyrene Another problem is caused by benzo(a)pyrene concentrations which in 2011 exceeded the target value in one of two localities in which this pollutant is measured in Prague, and namely at Prague 10-┼Ārob├Īrova. The year-to-year comparison did not changed markedly ŌĆō the benzo(a)pyrene average annual concentration slightly increased in the locality Prague 10-┼Ārob├Īrova and in the locality Prague 4-Libu┼Ī no change was recorded. The long term course of benzo(a)pyrene concentrations in the localities in the Prague agglomeration is depicted in Fig. II.4.1.6. Ground-level ozone In 2011 (in the average for 3 years 2009ŌĆō2011) the target value for the ground-level ozone was exceeded in the locality Prague 6-Suchdol where the 26th highest maximum daily 8-hour running average reached 122.3 ╬╝g.m-3.The exceedance of the target value in this locality occurred 27.7x in the average for three years (the tolerated number of exceedances is 25x; Fig. II.4.1.7). Further high levels, however not reaching the limit value, were recorded in the locality Prague 4-Libu┼Ī (117.5 ╬╝g.m-3).
Fig. II.4.1.1 Number of exceedances of 24-hour PM10 limit value in the given year, 36th highest 24-hour concentration and average 36th highest 24-hour concentration from selected localities, Prague agglomeration, 2006ŌĆō2011
Fig. II.4.1.2 Number of days with concentrations of PM10 > 50 ╬╝g.m-3 in individual months, incl. total number of exceedances, Prague agglomeration, 2011
Fig. II.4.1.3 Average annual PM10 concentrations in selected localities, Prague agglomeration, 2006ŌĆō2011
Fig. II.4.1.4 Average annual PM2.5 concentrations, Prague agglomeration, 2004ŌĆō2011
Fig. II.4.1.5 Average annual NO2 concentrations in selected localities, Prague agglomeration, 2006ŌĆō2011
Fig. II.4.1.6 Average annual benzo(a)pyrene concentrations, Prague agglomeration, 2000ŌĆō2011
Fig. II.4.1.7 Numbers of exceedances of the target value of O3 in the average for three years, Prague agglomeration, 2006ŌĆō2011
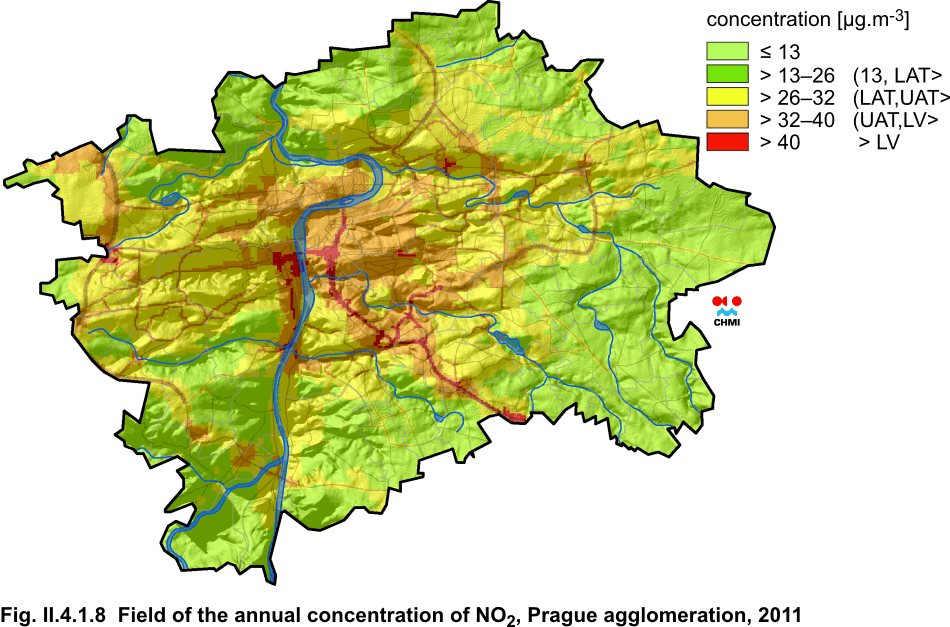
Fig. II.4.1.8 Field of the annual concentration of NO2, Prague agglomeration, 2011
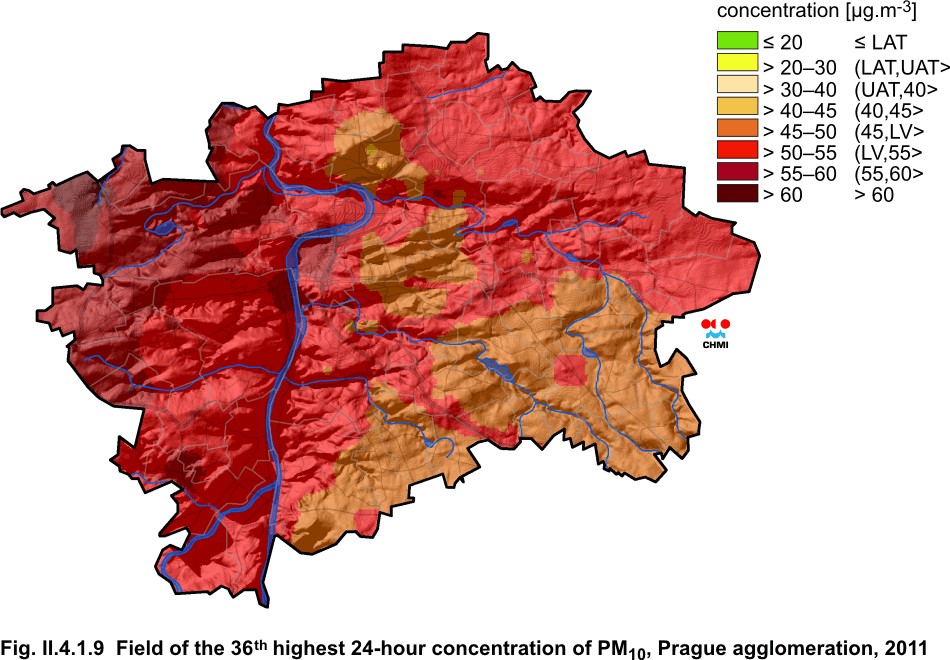
Fig. II.4.1.9 Field of the 36th highest 24-hour concentration of PM10, Prague agglomeration, 2011
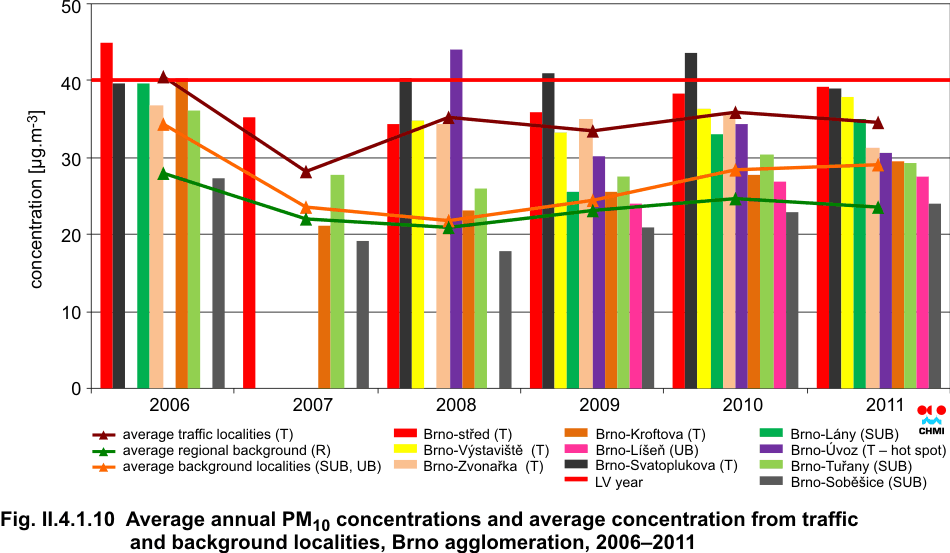
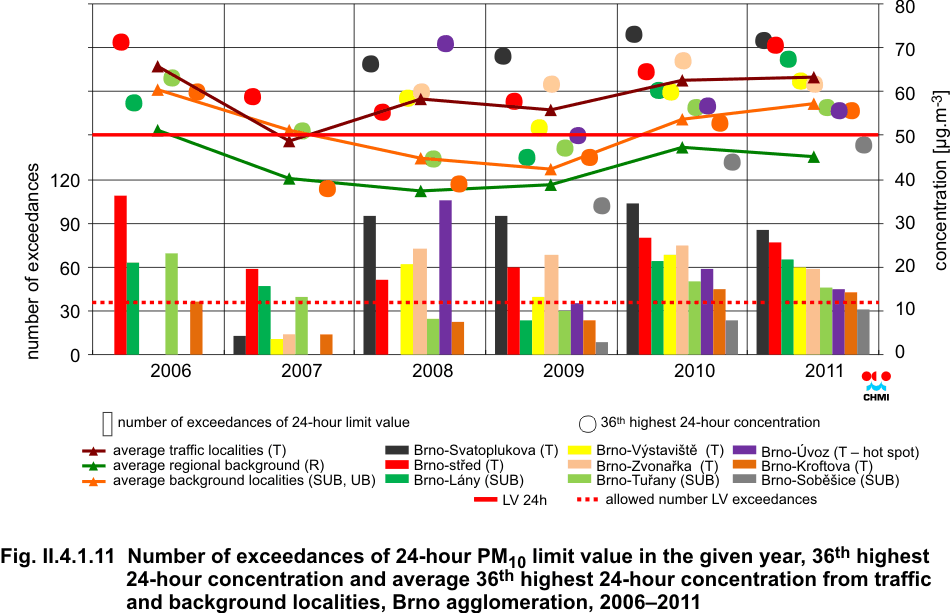
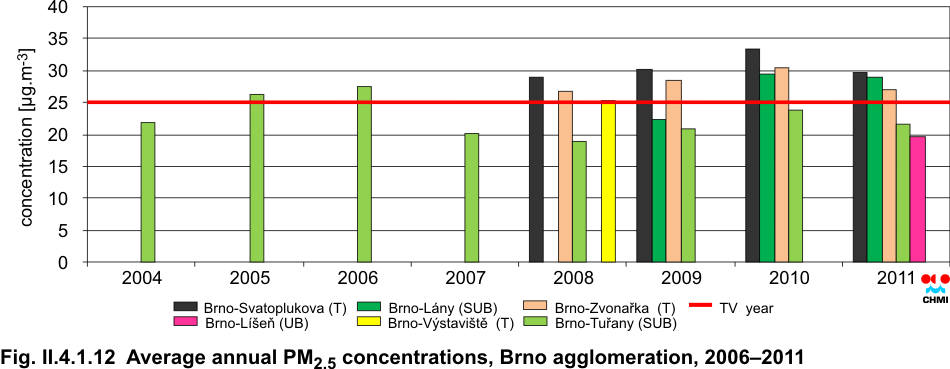
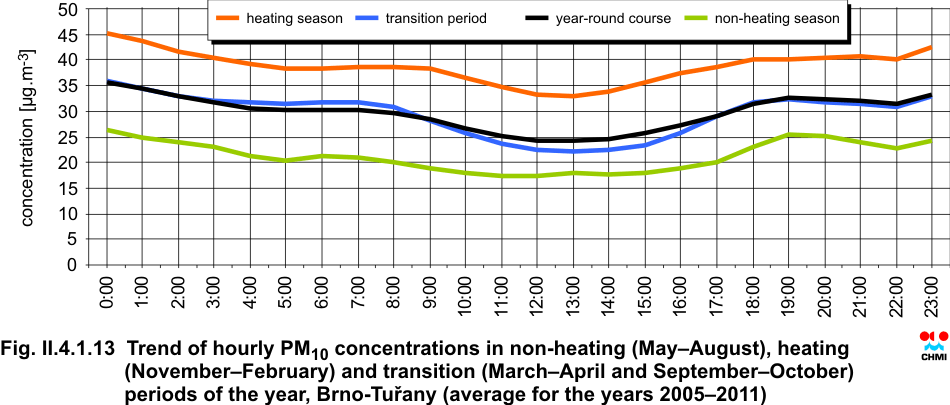
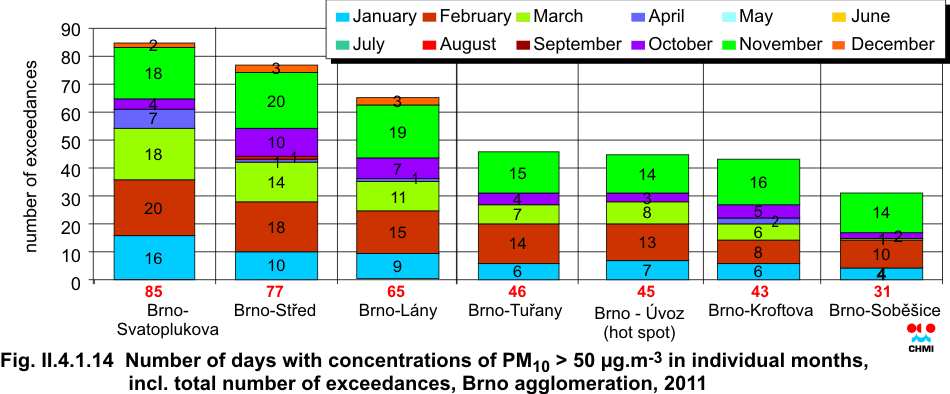
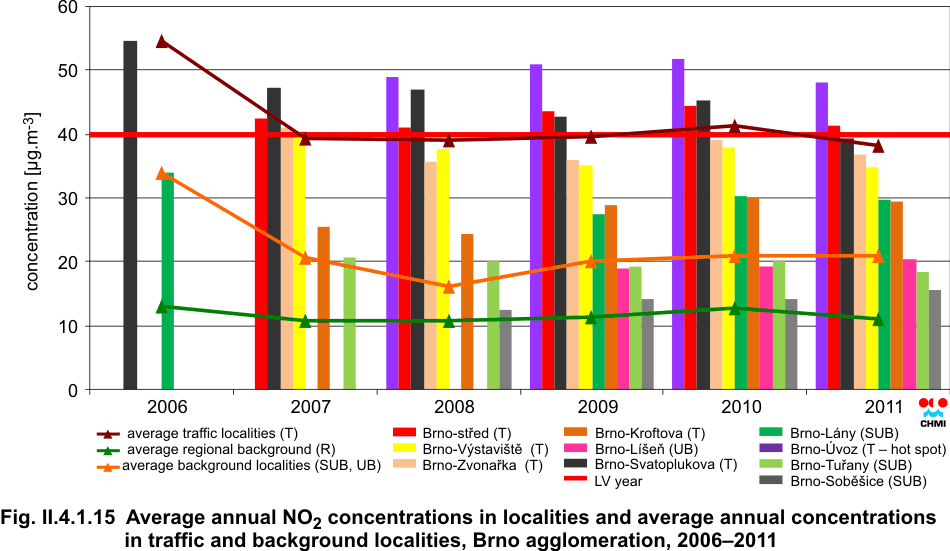
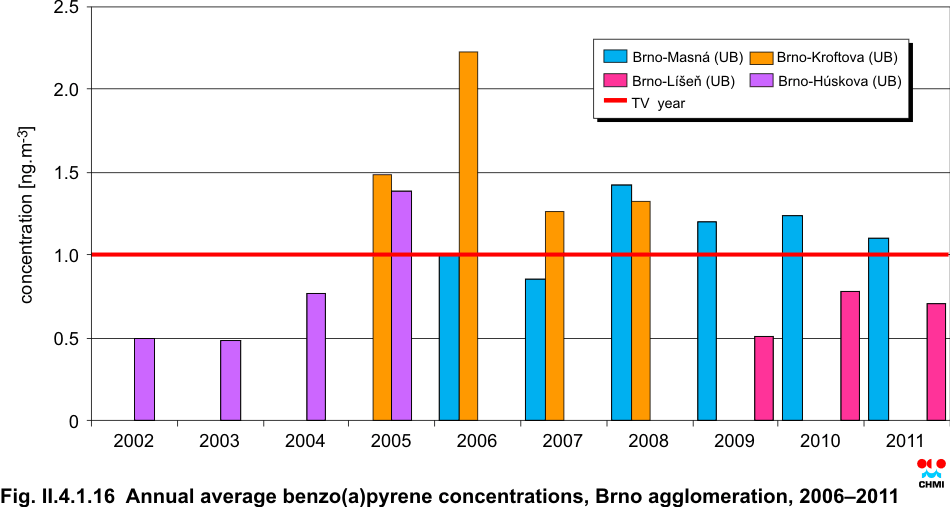
Characteristic of the agglomeration The Brno agglomeration is located in the centre of the South Moravian Region, it is identical with the administrative territory of the city of Brno. As concerns ambient air quality Brno is one of three agglomerations and as such it is not included in the zone South Moravian Region. The area of the agglomeration is 230.22 km2 and the number of inhabitants is 384,277 [42]. Both the limit values and the target values for the protection of human health are exceeded in the long term in Brno [8]. This is caused mainly by traffic, the major source of pollutants exceeding the limit values/target values in the territory of the agglomeration (Tab. II.4.1.1). Historically, Brno is the city located on the crossroad of communications. Also at present important traffic communications intersect in the Brno territory (highways D1 and D2, expressway R52 to Vienna and R43 to Svitavy). Mainly due to the still unfinished bypass from D1 in direction to Svitavy the already high number of cars in Brno is increased daily by transit traffic going through the city centre. Anyway the transit traffic is not fluent due to the unfinished Brno ring. All the above facts have their share in the increased emissions from traffic ŌĆō particularly total suspended particles (traffic produces 87 % of TSP emissions), nitrogen oxides (76 %), carbon monoxide (91 %) and volatile organic compounds (78 %) in the territory of the agglomeration, and in the increased air pollution loads affecting the health of population. It is no accident that the limit values are exceeded in the pollutants the main source of which is traffic, and the highest concentrations are measured in the localities with heavy traffic loads. The Brno agglomeration is covered by the network of mainly traffic stations measuring ambient air quality. Within the assessment of ambient air quality in the territory of the Czech Republic in 2011 there were used data from 6 CHMI stations, 4 stations of the Municipal Council of the City of Brno and 2 stations of the Health Institute in Brno measuring ambient air quality in the territory of the agglomeration. Concentrations of PM10 and PM2.5 suspended particles In 2011 the limit value for the average annual PM10 concentration was not exceeded in any locality in the territory of the Brno agglomeration. However, the localities with the highest traffic loads (Brno-st┼Öed, Brno-Svatoplukova) reached the levels very close to the limit value and several exceedances were recorded in the previous years. (Fig. II.4.1.10). The worst air pollution situation was confirmed at traffic stations where the concentrations are in average by 7.9 ╬╝g.m-3 higher than in background localities (2006ŌĆō2011). The situation at urban and suburban background stations is very similar as at the regional rural background station Mikulov-Sedlec in the years without long periods of unfavourable dispersion conditions (2007ŌĆō2009). On the contrary, in the years when there occurred, mainly in the winter, the long-lasting periods with the inversion character of the weather (January 2006, January 2010, February and November 2011), the effect of the large accumulation of sources (household heating, traffic, industry) and of stable atmosphere is apparent. It is manifested by higher concentrations at urban background stations as against the regional background station. In addition to dispersion conditions and the heating season there is another important factor, and namely wind erosion with regard to the agricultural character of the landscape in the whole South Moravian Region. As concerns the water balance in the Czech Republic, the worst situation is in the South Moravian Region, incl. the Brno agglomeration. Mainly during the episodes without precipitation, when the soil is parched, soil particles are drifted by wind which results also in increased concentrations of particles in the ambient air. At the same time the atmosphere is not ōwashed outō by precipitation, and thus the particles stay airborne for a longer time and they can travel longer distances. The long-term data from the station Brno-Tu┼Öany (1994ŌĆō2010) show that during the episodes without precipitation (for at least 5 days) the average concentrations of PM10 are by 6.1 ╬╝g.m-3 higher than the long-term average for this period [43]. The influence of drought is apparent also within the year, in the monthly trend of particles concentrations. As concerns PM2.5 particles measured in the territory of the Brno agglomeration, the target limit value (set in 2011 [44]) is exceeded in the long term only in the localities with traffic loads (Fig. II.4.1.12); in background localities the target limit value is exceeded or the levels are close to the target limit value only in the years with longer episodes of unfavourable dispersion conditions (2006, 2010). 36th highest 24-hour concentration of PM10 The only station that did not exceed the limit value for 24-hour PM10 concentration is the suburban background locality Brno-Sob─ø┼Īice. All other stations, similarly as in the year 2010, exceeded the limit value (Fig. II.4.1.11). The background locality Brno-Tu┼Öany or for instance Brno-Kroftova did not exceed the limit value in the years without longer episodes of unfavourable dispersion conditions (2007, resp. 2008ŌĆō2009). In spite of the fact that the share of small sources (household heating) in the Brno agglomeration amounts to 4 %, within the South Moravian Region the small sources represent the second (after traffic) most significant source of particulate matter (23 %) and there is the spatial impact on concentrations of particles in the ambient air also in the territory of the Brno agglomeration. There is the marked influence of small sources on PM10 concentrations during the heating season (Fig. II.4.1.13). In addition to absolute concentrations that are during the heating season by ca 20 ╬╝g.m-3 higher than in the summer months, there is also an apparent bigger difference between the maximum and the minimum during the day within the heating season caused by the routine activities of inhabitants (leaving the home for work, decline of heating, after 14:00 coming back to home, increase of heating). Traffic stations exceed the limit value in almost all cases within the whole monitored period and thus confirm the main problem as concerns the ambient air quality in the Brno agglomeration ŌĆō excessive traffic load. Generally, the levels of concentrations are much dependent on meteorological/dispersion conditions during the winter season. The negative influence of unfavourable dispersion conditions in the winter period together with the heating season (small sources) is reflected also in the distribution of days with PM10 concentrations higher than 50 ╬╝g.m-3; such days occur only in the period OctoberŌĆōMarch (Fig. II.4.1.14). In April this concentration is exceeded only at traffic stations where, similarly as in March, spreading material and its re-suspension due to traffic may have the influence. On the contrary, there is only minimum difference between the number of exceedances in the above mentioned ōdryō November in traffic and background localities, similar situation applies for February. February and November of 2011 were the worst months as concerns PM10 concentrations, due to the long lasting inversion character of the weather. In December the atmosphere was markedly cleaned thanks to the passage of frontal systems above the territory of the Czech Republic and the breakage of temperature inversion. This was manifested also in the number of exceedances ŌĆō there was not recorded any exceedance of PM10 concentration 50 ╬╝g.m-3 at the background localities. Concentrations of nitrogen dioxide (NO2) In the territory of the Brno agglomeration the limit value for the average annual NO2 concentration is exceeded only in the localities with the heaviest traffic loads. On the contrary, the limit value for 1-hour concentration of NO2 is not exceeded. In 2011 the limit value was exceeded in the localities Brno-├Üvoz (hot-spot) and Brno-st┼Öed. The locality Brno-Svatoplukova, which exceeded the limit value regularly in the previous years (2006ŌĆō2010), did not exceed it in 2011, however, the measured concentrations were very close to the limit value (39.4 ╬╝g.m-3). The long-term background concentrations measured in the locality Brno-Tu┼Öany reach the levels around 20 ╬╝g.m-3 (Fig. II.4.1.15). The trend of concentrations in the monitored period is relatively stable at all stations, unlike the particles, the measured values are not so much influenced by meteorological conditions; only the intensity of traffic is significant. Benzo(a)pyrene The polycyclic aromatic hydrocarbons (PAH) are represented in the respective legislation [8] by benzo(a)pyrene ŌĆō carcinogenic substance formed during the combustion of solid and liquid fuels. In the territory of the Brno agglomeration PAH are measured in two localities ŌĆō in the city centre with traffic loads (Brno-Masn├Ī) and in the background residential area (Brno-L├Ł┼Īe┼ł). While the traffic locality Brno-Masn├Ī exceeded the target value every year since 2008, the concentrations in the locality Brno-L├Ł┼Īe┼ł have not been exceeded as yet (Fig. II.4.1.16). With regard to average monthly concentrations the winter months are very important ŌĆō while in summer the concentrations reach practically zero values, in wither they move in the average around 5 ng.m-3. This is caused by meteorological conditions and also by higher levels of the regional background. Small sources (household heating) are in operation practically only during the heating season. At the same time, within the South Moravian Region they rank right after traffic as concerns most important sources of particles to which PAH are bound. These small sources increase spatial background concentrations in the whole region during the cold part of the year. In traffic localities even higher concentrations are measured which is caused by traffic emissions, and, moreover, frequent öcold startsö connected with the increase of pollutantsÆ emissions play their role in the winter period. Ground-level ozone The monitoring of ground-level ozone (formed in the series of photochemical reaction between nitrogen oxides and VOC) is carried out in two localities in the Brno agglomeration ŌĆō background concentrations are measured at the station Brno-Tu┼Öany, and ozone is measured also in the city centre influenced by traffic loads at the station Brno-Zvona┼Öka. Ozone is a highly reactive molecule readily reacting with most substances in the air. Therefore the highest concentrations of ground-level ozone are measured in clean localities with low concentrations of other pollutants. On the contrary, the most loaded (traffic) localities measure the lowest concentrations of ground-level ozone. Ozone reactivity is demonstrated also in the measured concentrations in the territory of the Brno agglomeration. While the locality Brno-Zvona┼Öka does not exceed the target value (the 26th highest 8-hour running average in 2011 reached 99.4 ╬╝g.m-3), the levels of concentrations in the locality Brno-Tu┼Öany oscillate around the target value (the 26th highest 8-hour running average in 2011 reached 121 ╬╝g.m-3). Smog warning and regulatory system None of the sources in the territory of the Brno agglomeration is included in the Central regulatory code of the Czech Republic. Since 2011 however, also Regional regulatory code has been in operation in the South Moravian Region [35]. The Brno agglomeration comes under the scope of the Regional regulatory code of the South Moravian Region. The issuing of the warning and regulatory signals in the South Moravian Region is based on the data from the stations Brno-Tu┼Öany, Znojmo and Mikulov-Sedlec. In 2011 the warning signal concerning smog situation was issued twice in the South Moravian Region. The first warning signal was valid from 3 to 7 November (the conditions were fulfilled by the station Brno-Tu┼Öany), the second signal was valid from15 to 21 November (the conditions were fulfilled by the stations Brno-Tu┼Öany and Znojmo). In case of the issuing of the regulatory signal the selected sources within the South Moravian Region, incl. the Brno agglomeration, would have to take measures to reduce dust emissions within their regulatory codes. According to the TSP emission inventory the controllable sources are included into the category of extra large and large sources representing only 7 % of total amount of TSP emissions in the air (however, the regulatory code includes only the most significant ones). Similar situation is in the whole South Moravian Region where the extra large and large sources represent also only 7 % of all TSP emissions. On the contrary, the sources which within the South Moravian Region and the Brno agglomeration mainly contribute to deteriorated air quality (household heating and traffic) cannot be limited. As concerns household heating, there is only one possibility, and namely to appeal to the citizens to use suitable fuels, to provide appropriate maintenance of heating appliances and to avoid waste burning. Traffic can be regulated only on the precondition that there exists the alternative route with at least the same class of road, which in most cases is not possible. Here the Brno bypass would be very helpful as it would displace the transit traffic out of the city centre. Summary As concerns ambient air quality, there is a major problem in the Brno agglomeration, and namely with traffic, resp. with the presence of pollutants in the ambient air, caused in the most part by traffic. With regard to the location of Brno as the highway intersection including a high percentage of transit transport passing through the city centre, this problem will not be probably solved in the near future. First, similarly as in Prague, it will be necessary to invest in bypasses (displacement of emissions out of the city centre and their marked reduction as a result of smoother traffic flow) and then take further traffic and organizational measures until the situation improves. The situation out of the city centre is a little better, the exceedances of the limit values in the localities Brno-L├Ł┼Īe┼ł, Brno-Sob─ø┼Īice or Brno-Tu┼Öany occur only in the years with longer periods with unfavourable dispersion conditions. The Brno agglomeration does not meet the limit values as concerns suspended particles (both PM10 and PM2.5), nitrogen dioxide and the target value for benzo(a)pyrene. All these pollutants are closely connected with traffic in the Brno agglomeration. These substances also have their contribution in the definition of the areas with deteriorated air quality. Other pollutants listed in the legislation [8] comply with the limit values. In case of sulphur dioxide (both daily and hourly limit values), carbon monoxide, lead, arsenic, cadmium and nickel the concentrations even remain below the lower assessment threshold in the long term. Benzene concentrations reach the levels close above the lower assessment threshold.
Fig. II.4.1.10 Average annual PM10 concentrations and average concentration from traffic and background localities, Brno agglomeration, 2006ŌĆō2011
Fig. II.4.1.11 Number of exceedances of 24-hour PM10 limit value in the given year, 36th highest 24-hour concentration and average 36th highest 24-hour concentration from traffic and background localities, Brno agglomeration, 2006ŌĆō2011
Fig. II.4.1.12 Average annual PM2.5 concentrations, Brno agglomeration, 2006ŌĆō2011
Fig. II.4.1.13 Trend of hourly PM10 concentrations in non-heating (MayŌĆōAugust), heating (NovemberŌĆōFebruary) and transition (MarchŌĆōApril and SeptemberŌĆōOctober) periods of the year, Brno-Tu┼Öany (average for the years 2005ŌĆō2011)
Fig. II.4.1.14 Number of days with concentrations of PM10 > 50 ╬╝g.m-3 in individual months, incl. total number of exceedances, Brno agglomeration, 2011
Fig. II.4.1.15 Average annual NO2 concentrations in localities and average annual concentrations in traffic and background localities, Brno agglomeration, 2006ŌĆō2011
Fig. II.4.1.16 Average annual benzo(a)pyrene concentrations, Brno agglomeration, 2002ŌĆō2011
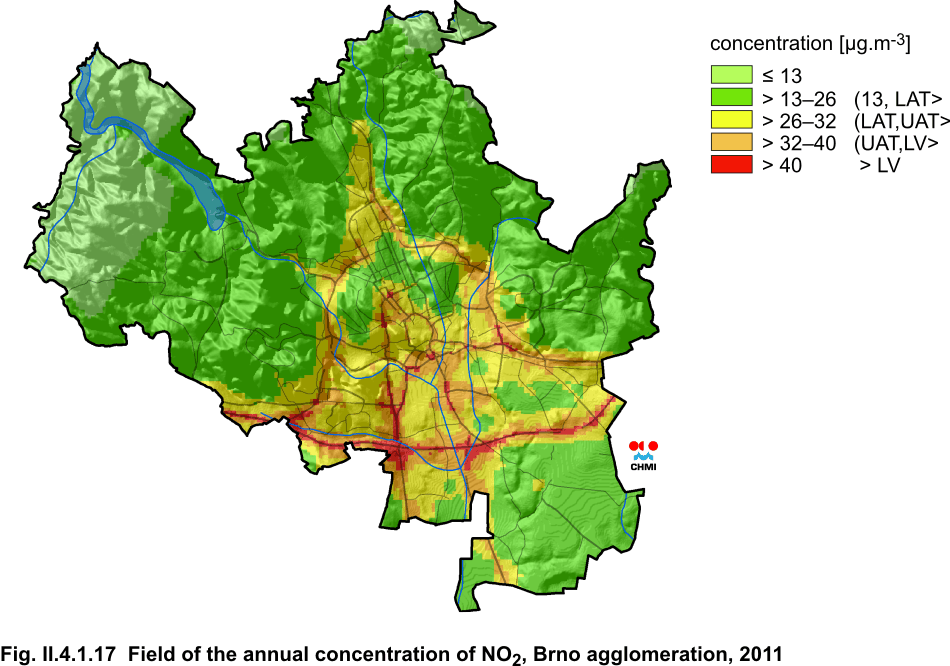
Fig. II.4.1.17 Field of the annual concentration of NO2, Brno agglomeration, 2011
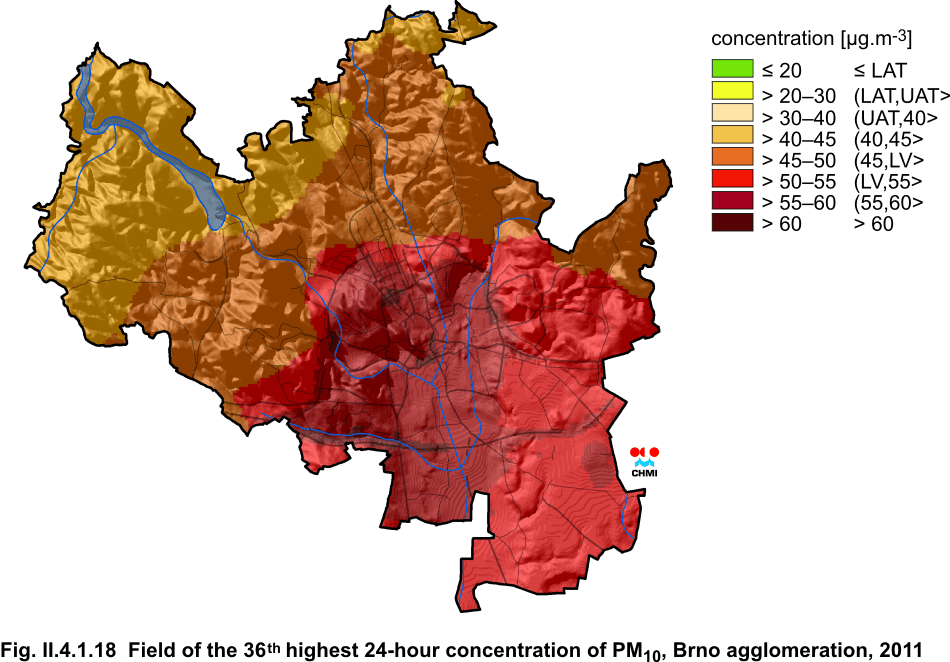
Fig. II.4.1.18 Field of the 36th highest 24-hour concentration of PM10,
Brno agglomeration, 2011
Within the Czech Republic, it is the agglomeration Moravian-Silesian Region which has the highest production of emissions of carbon monoxide (CO), second highest share of sulphur dioxide (SO2), total suspended particles (TSP) and volatile organic compounds (VOC). In this region, as compared with other areas of the Czech Republic, there is a specific representation of the shares of individual catagories of TSP emissions. The highest share is contributed by extra-large and large sources of air pollution (in total almost one third of the production for the whole Czech Republic), followed by small and mobile sources. This situation is connected with historical developement of the industrial part of the agglomeration. The share of large sources, however, has mainly a decreasing trend in the year-on-year aspect [45, 46]. With regard to high population density, also local heating is the significant source of pollution and air quality is also significantly influenced by transboundary air pollution between the Czech Republic and Poland. There have been launched a lot of programmes and initiatives aimed at the improvement of air quality in the agglomeration. In 2011, similarly as in the previous years, the
agglomeration Moravian-Silesian Region recorded in the cold periods of the year
long-lasting episodes of above-the-limit daily concentrations of PM10
particles accompanied by increased concentrations of other pollutants. This
resulted in above-the-limit annual concentrations of suspended particles of PM10
and PM2.5 fractions, benzo(a)pyrene and benzene. The exceedance of
the NO2 annual limit value was measured only in the traffic hot-spot locality in
Ostrava. In the warm half of the year there occured episodic limit value
exceedances of the maximum 8-hour ozone concentration, the number of
exceedances, however, has a decreasing trend. Repeatedly there occurred the
peaks of above-the-limit short-term concentrations of SO2 in connection with the
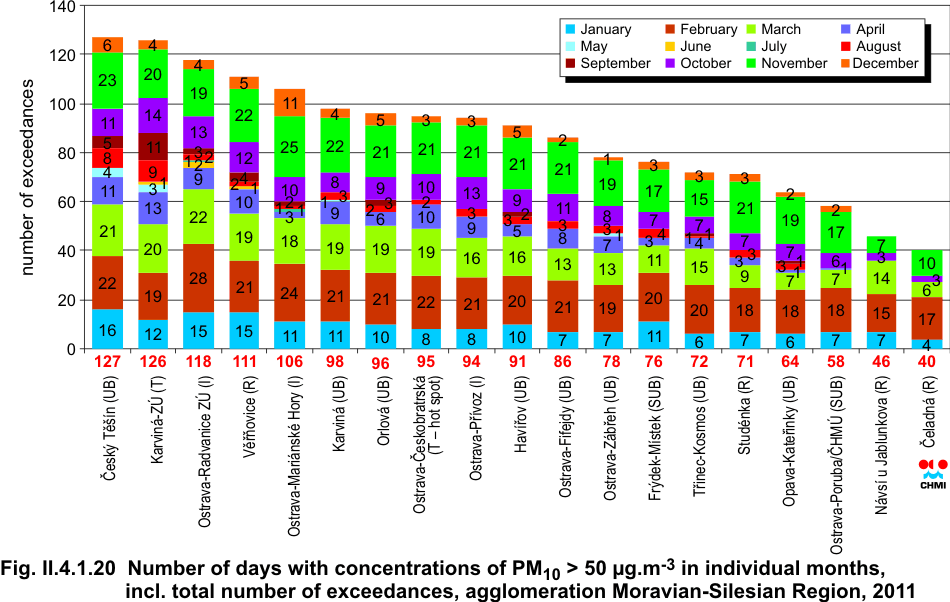
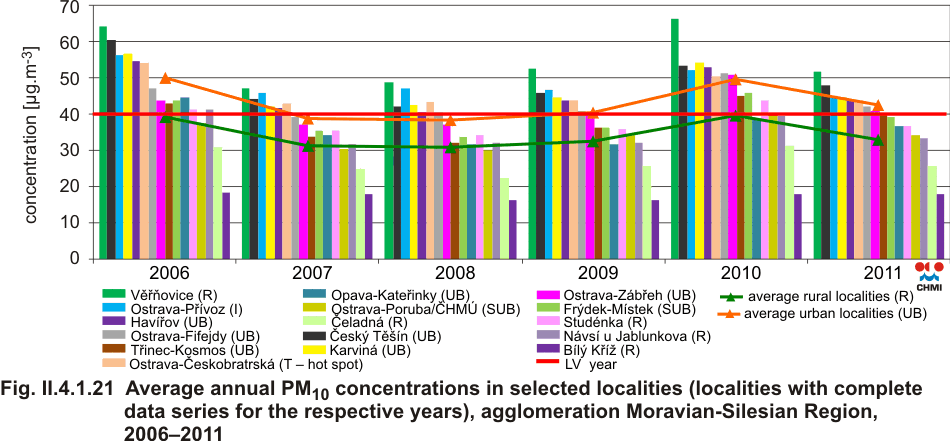
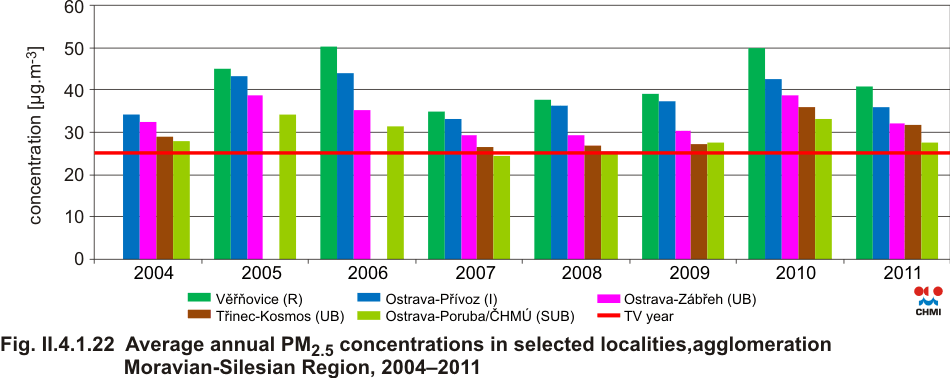
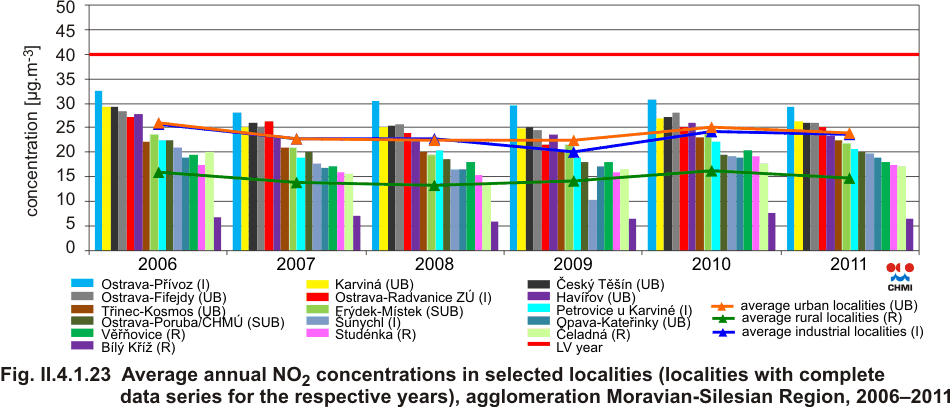
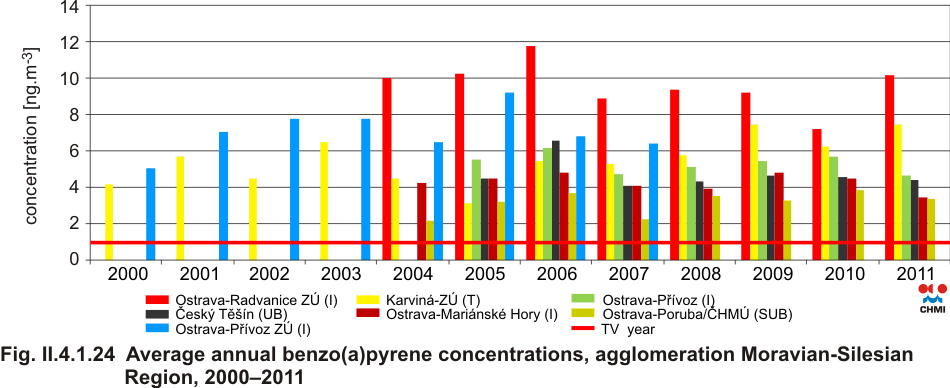
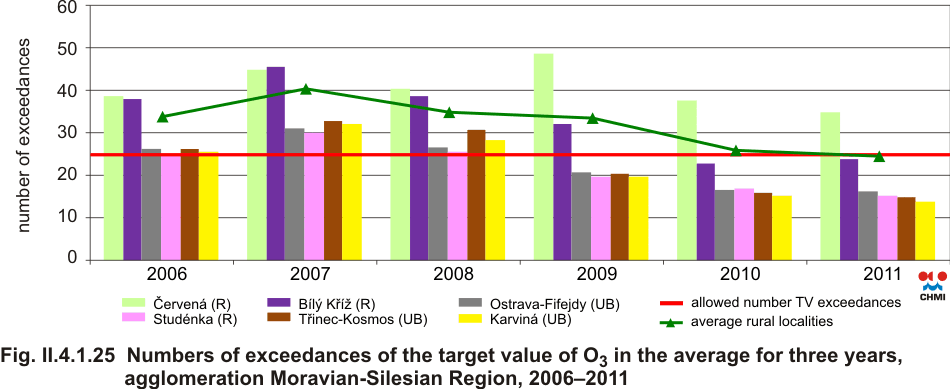
removal of old ecological loads in Ostrava. Suspended particles of PM10 and PM2.5 fraction The concentrations of suspended particles in the agglomeration reach the highest levels within the Czech Republic in the long term. Air pollution caused by PM10 fraction was monitored in 2011 in 22 localities. The average daily concentrations of PM10 particles exceeded, similarly as in the previous years, the limit value in almost all measuring localities in the Moravian-Silesian Region (incl. the suburban and rural ones) with the complete series of mesurement, i.e. more frequently than 35 days per year tolerated by legislation (Fig. II.4.1.19). The most affected localities, ─īesk├Į T─ø┼Ī├Łn and Karvin├Ī-Z├Ü, recorded the exceedance of the daily limit value 50 ╬╝g.m-3 in more than 120 days in the year. The exceedances of the daily limit value occurred mostly in the cold periods of the year (Fig. II.4.1.20). The 2011 average annual PM10 concentrations slightly decreased in the majority of localities close to the levels of the year 2009, but they remained higher than in the years with the lowest pollution within the recent decade (2007, 2008). All urban, traffic and industrial localitites in the agglomeration with the exception of Opava exceeded the annual limit value 40 ╬╝g.m-3, below-the-limit values were measured only in several background (suburban and rural) localities (Fig. II.4.1.21). The annual average concentrations of PM2.5 particles exceeded similarly as in the past (with the exception of the year 2007 in Ostrava-Poruba/─īHM├Ü) the limit value in all nine localities with the measurement (Fig. II.4.1.22), incl. the suburban and rural ones (limit value = 25 ╬╝g.m-3). In 2011 there were issued 7 ōWarning signalsö and 6 ōRegulationö signals for PM10 particles within the Central Regulatory Code based on the Decree of the Ministry of the Environment No. 373/2009 Coll., for the Ostrava-Karvin├Ī area when the information and alert thresholds were exceeded. The longest 20-day episode lasted from 31 October to 21 November 2011. For the T┼Öinec area 5 ōWarningō signals and 4 ōRegulationō signals were issued. In 2011 measurement of PM10 fraction suspended particles in the ambient air with the use of samplers was carried out in rural localities He┼Ömanovice and Nov├Į Ji─Ź├Łn-Kojet├Łn; t weas financed from the budget of the Moravian-Silesian Region. In both background municipalities of the region the annual PM10 concentration reached approximately two thirds of the annual limit value. Nitrogen dioxide Short-term concentrations of nitrogen dioxide (NO2) were measured in 17 localities in the agglomeration in 2011. The 1-hour limit value was exceeded only once, and namely in the industrial locality Ostrava-Radvanice Z├Ü. The number of 18 hourly above-the-limit values per year tolerated by legislation was not thus exceeded. NO2 concentrations in the agglomeration remained, unlike the neighbouring areas, at almost comparable level with the year 2010 (i.e. slightly higher than in the year 2009). The above-the-limit annual values exceeding 40 ╬╝g.m-3 are reached every year (with the exception of 2007) at the traffic "hot spot" station Ostrava-─īeskobratrsk├Ī ŌĆō the only one of 20 localities with the complete data series (Fig. II.4.1.24). It can be expected that the similar above-the-limit level of concentrations is reached also in other communications with comparable traffic loads in Ostrava and other cities of the agglomeration. The annual concentration in urban and industrial localities in the agglomeration range around the average level of 20ŌĆō26 ╬╝g.m-3, in rural localities the concentrations range between 12 and 14 ╬╝g.m-3. Benzo(a)pyrene Benzo(a)pyrene concentrations in the agglomeration have been measured since 2000, in 2011 in 6 localities. All localities regardless their classification exceed the limit annual concentration of this pollutant for the whole measurement period (Fig. II.4.1.24), at the most polluted stations the excedances are multifold (the highest concentration was recorded in Ostrava-Radvanice Z├Ü). Target value of benzo(a)pyrene for the protection of human health (annual average concentration 1 ng.m-3) was exceeded in both evaluated localities where the sampling measurement of PM10 fraction of suspended particles financed from the budget of the Moravian-Silesian Region was carried out. In He┼Ömanovice the average annual value of 2.07 ng.m-3 was measured, i.e. the double level of the limit value. Due to the fact that He┼Ömanovice recorded the lowest PM10 concentrations from background localities in the region, the higer level of BaP concentrations in this locality is rather surprising. In Nov├Į Ji─Ź├Łn-Kojet├Łn the annual average reached 1.65 ng.m-3. The average annual concentration of BaP measured in Nov├Į Ji─Ź├Łn-Kojet├Łn was the lowest one of all the localities of the Moravian-Silesian Region (as well as of the neighbouring Olomouc Region). Ground-level ozone In 2011, similarly as in the previous years, the target value for O3 (25 days
with the exeedance of the maximum daily 8-hour value of 120 ╬╝g.m-3 in the
average for 3 years) was exceeded in the rural locality ─īerven├Ī in Odersk├®
vrchy. Up to 2008 the target value was exceeded repeatedly in most localities
measuring O3 in the agglomeration, incl. three urban localities (Fig.
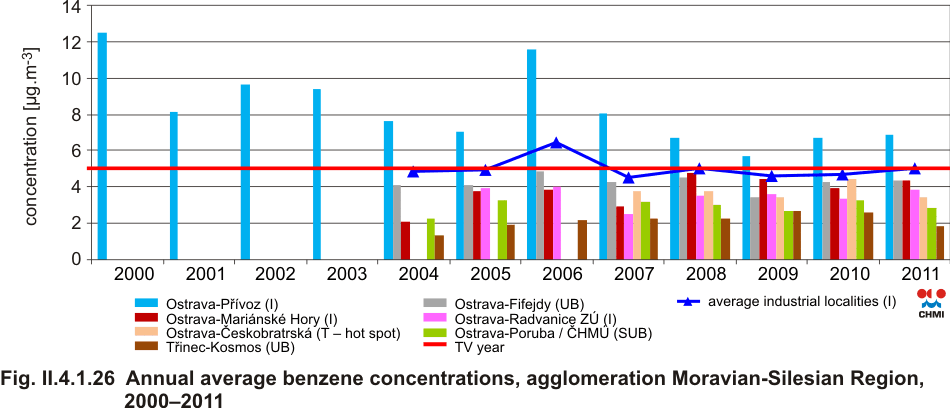
II.4.1.25). Sulphur dioxide In connection with the removal of old ecological loads1 in Ostrava-Mari├Īnsk├® Hory there occurred during the spring and summer months of the year 2011 mainly evening and night peaks of high hourly concentrations of SO2 and benzene in Ostrava. The average daily concentrations of SO2 reached the above-the-limit values exceeding 125 ╬╝g.m-3 in the localities Ostrava-P┼Ö├Łvoz (daily maximum 660 ╬╝g.m-3), Ostrava-Fifejdy (408 ╬╝g.m-3) and Mari├Īnsk├® Hory (210 ╬╝g.m-3), i.e. in the localities situated most closely to the source of pollution. However, the number of three days with the above-the-limit concentrations tolerated by the legislation was not exceeded at any of them (Ostrava-P┼Ö├Łvoz recorded precisely three days with exceedances). The highest hourly concentration 4,317 ╬╝g.m-3 was measured in Ostrava-P┼Ö├Łvoz. In this locality, as well as in Ostrava-Fifejdy, the above-the-limit concentrations (above 350 ╬╝g.m-3) were reached 19x, in Ostrava-Mari├Īnsk├® Hory 5x. The maximum allowed number of 24 exceedances was not thus exceeded. Similar high SO2 concentrations were measured in this region for the last time at the turn of the 80Æs and 90Æs of the 20th century. Benzene Together with SO2 there occurred occasional short-term marked peaks of 1-hour benzene concentrations. Ostrava-P┼Ö├Łvoz is the only locality with the above-the-limit annual benzene concentration in the Czech Republic again in 2011. The above-the-limit annual values have been measured there continually since the start of the monitoring in 2000 (Fig. II.4.1.26). The average annual concentrations had a decreasing trend from 2006 to 2009. In 2010 they increased and in 2011 their concentration was even slightly higher than in 2010. The remaining six localities in the region reported benzene concentrations below the limit value.
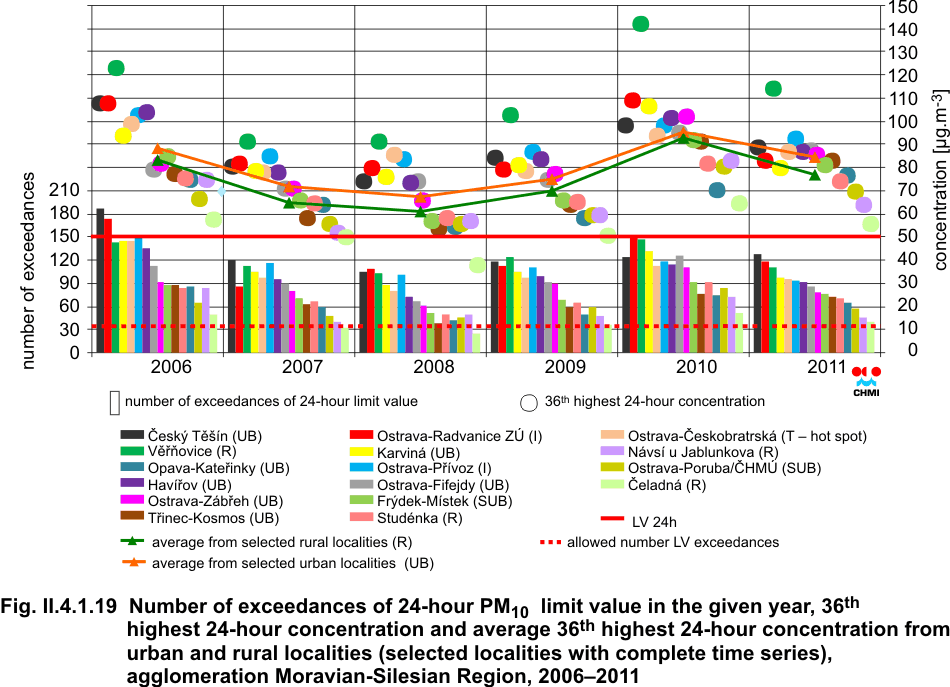
Fig. II.4.1.19 Number of exceedances of 24-hour PM10 limit value in the given year, 36th highest 24-hour concentration and average 36th highest 24-hour concentration from urban and rural localities (selected localities with complete time series), agglomeration Moravian-Silesian Region, 2006ŌĆō2011
Fig. II.4.1.20 Number of days with concentrations of PM10 > 50 ╬╝g.m-3 in individual months, incl. total number of exceedances, agglomeration Moravian-Silesian Region, 2011
Fig. II.4.1.21 Average annual PM10 concentrations in selected localities (localities with complete data series for the respective years), agglomeration Moravian-Silesian Region, 2006ŌĆō2011
Fig. II.4.1.22 Average annual PM2.5 concentrations in selected localities, agglomeration Moravian-Silesian Region, 2004ŌĆō2011
Fig. II.4.1.23 Average annual NO2 concentrations in selected localities (localities with complete data series for the respective years), agglomeration Moravian-Silesian Region, 2006ŌĆō2011
Fig. II.4.1.24 Average annual benzo(a)pyrene concentrations, agglomeration Moravian-Silesian Region, 2000ŌĆō2011
Fig. II.4.1.25 Numbers of exceedances of the target value of O3 in the average for three years, agglomeration Moravian-Silesian Region, 2006ŌĆō2011
Fig. II.4.1.26 Annual average benzene concentrations, agglomeration Moravian-Silesian Region, 2000ŌĆō2011
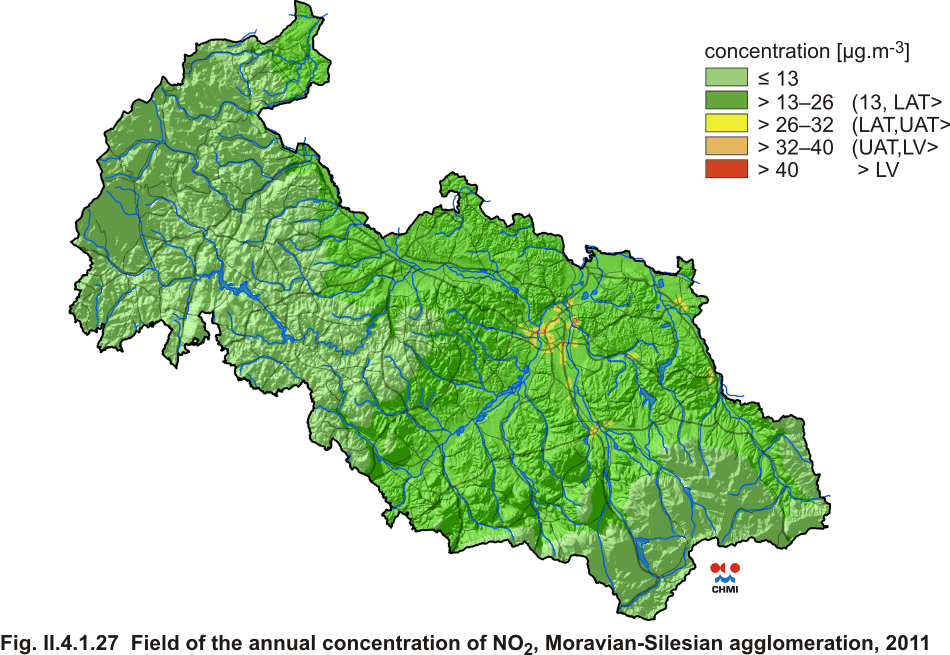
Fig. II.4.1.27 Field of the annual concentration of NO2, Moravian-Silesian agglomeration, 2011
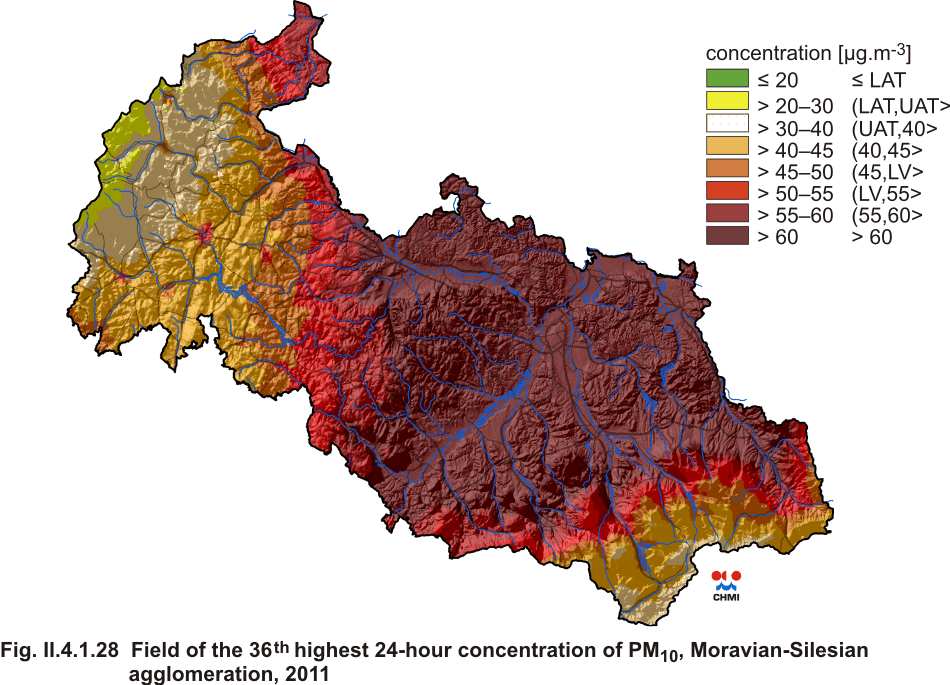
Fig. II.4.1.28 Field of the 36th highest 24-hour concentration of PM10, Moravian-Silesian agglomeration, 2011 1Removal of old ecological loads in Ostrava-Mari├Īnsk├® Hory was carried out in 2011 by remediation of waste lagoons formed by waste disposal from refinery production launched at the end of 19th century (starting from 1965 also waste from regeneration of exploited lubricating oils was deposited there from the state enterprise OSTRAMO Ostrava, since 1992 OSTRAMO-Vl─Źek and co., Ltd.). The shutdown occurred in 1996.
The zone ├Üst├Ł nad Labem Region The ├Üst├Ł nad Labem Region is defined as a zone. This area has
high population density and is highly industrialized in its northern part; in
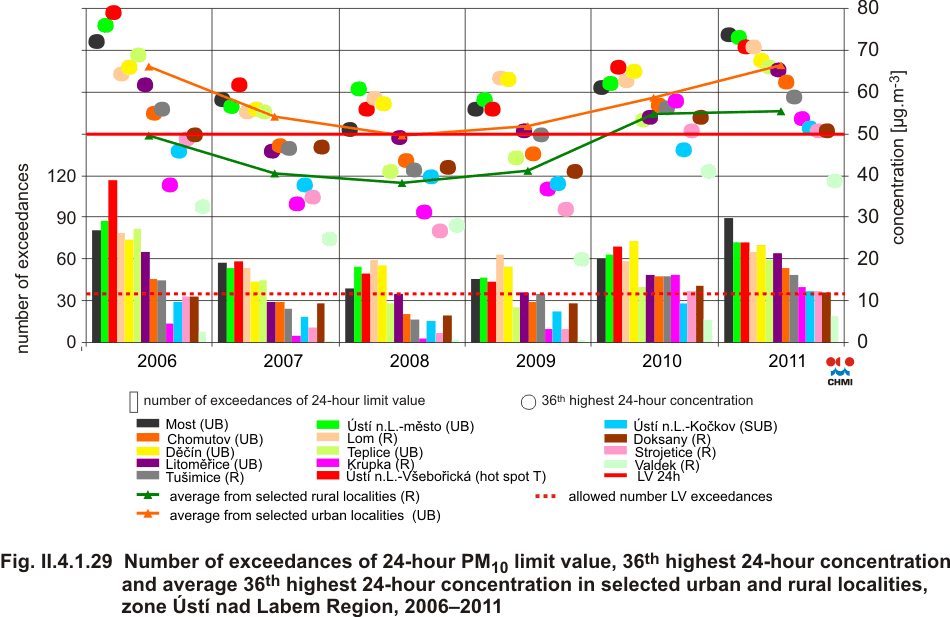
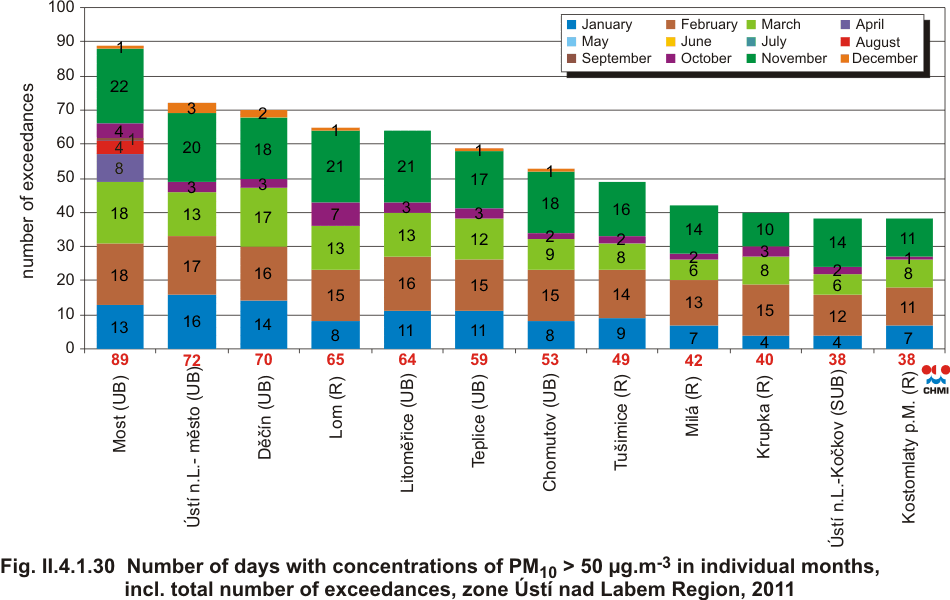
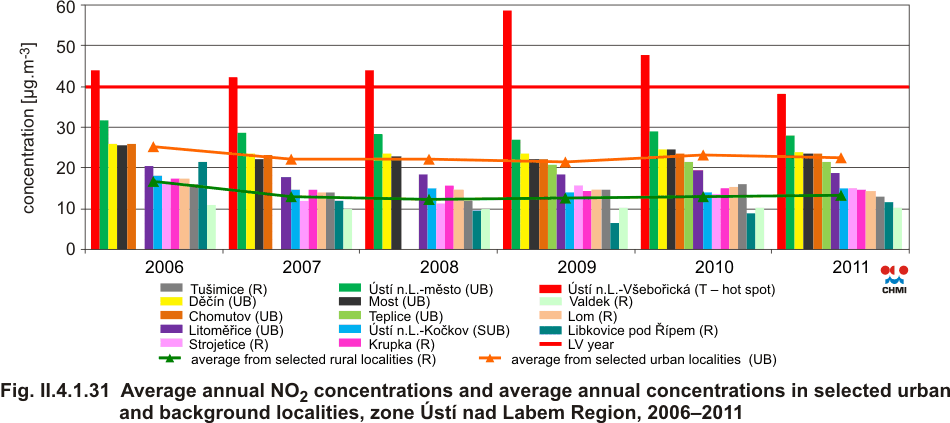
the southern part agriculture and light industry prevail. In 2011, data on pollutantsÆ concentrations were submitted to the ISKO database from the measurements in 32 localities in the zone ├Üst├Ł nad Labem Region (17 CHMI, 10 ─īEZ, 4 Z├Ü, 1 S┼ĀZE ┼Įatec). Concentrations of PM10 fraction of suspended particles were measured in 26 localities. The exceedance of the 24-hour limit value for PM10 was measured in 16 localities: Most (the limit value 50 ╬╝g.m-3 exceeded 89x), ├Üst├Ł n.L.-V┼Īebo┼Öick├Ī hot spot (72x), ├Üst├Ł n.L.-m─østo (72x), D─ø─Ź├Łn (70x), Lom (65x), Litom─ø┼Öice (64x), Teplice (59x), Chomutov (53x), Tu┼Īimice (49x), Mil├Ī (42x), Krupka (40x), Kostomlaty pod Mile┼Īovkou (38x), Strojetice (37x), ├Üst├Ł n. L.-Ko─Źkov (37x), Doksany (36x) and D─ø─Ź├Łn Z├Ü (36x). As compared with the year 2010, the situation is similar (Fig. II.4.1.29), there is only a slight change in the order of the stations, as concerns the number of exceedances which is caused by local influences. Winter periods in both years were similar, but the summer periods were drier, which markedly influences air dustiness. 24-hour limit value is exceeded most frequently in winter months (Fig. II.4.1.30); it is connected with the respective meteorological and dispersion conditions influencing PM10 concentration for the most part. There was not detected any significant source of dust in the ├Üst├Ł nad Labem Region in the monitored year. In 2011 the exceedance of the PM10 annual limit value was not recorded at any station in the ├Üst├Ł nad Labem Region (Fig. II.4.1.34, the highest annual average concentration of PM10 was measured at the station Most (38.1 ╬╝g.m-3), ├Üst├Ł n.L.-V┼Īebo┼Öick├Ī (36.2 ╬╝g.m-3), ├Üst├Ł n. L.-m─østo (35.9 ╬╝g.m-3), D─ø─Ź├Łn (35.5 ╬╝g.m-3) and Lom (33.7 ╬╝g.m-3). The annual average concentration in urban localities is 33.3 ╬╝g.m-3, while in rural localities its level reached 26.5 ╬╝g.m-3. The higher average in urban localities is caused by traffic, local heating and lack of care for clean streets and pavements. In rural areas the main sources of PM10 pollution are local heating and agriculture. PM2.5 particles were measured in 7 localities in the ├Üst├Ł nad Labem Region. The limit value for the annual average concentration (25 ╬╝g.m-3) was not exceeded at any of these stations; at two urban stations the values were quite close to the value 25 ╬╝g.m-3. The highest annual average PM2.5 concentration was recorded in the locality Most, where it reached the value 24.7 ╬╝g.m-3, and in the locality Teplice where it reached 23.8 ╬╝g.m-3 (Fig. II.4.1.35). In 2011 NO2 concentrations were measured in 28 localities in
total in the ├Üst├Ł nad Labem Region (out of them 17 CHMI). In 2011 none of the
stations recorded the exceedance of the annual and 1-hour limit values. The
station ├Üst├Ł n.L.-V┼Īebo┼Öick├Ī, which is significantly influenced by traffic,
recorded the highest annual average NO2 concentration 38.1 ╬╝g.m-3. Nevertheless,
this value is lower as compared to the previous years (Fig.
II.4.1.31). In the 3-year period 2009ŌĆō2011 the target value for ground-level
ozone was not, for the first time, exceeded at any locality. Ground-level ozone
is measured in 9 localities, out of which four are rural, four urban and one
suburban. Similarly as in other parts of the Czech Republic the number of
exceedances of the maximum daily 8-hour running average in the 3-year average
has decreased in the recent years. In the ├Üst├Ł nad Labem Region the decline was
recorded in all localities. In the previous two years the numbers of exceedances
in urban and rural localities has markedly approached each other. The target
value for the protection of ecosystems for ground-level ozone (AOT40 exposure
index) has a similar character, it was exceeded only at the rural station
Sn─ø┼Šn├Łk by ca 3 %.
The limit value for SO2 concentration was not exceeded in 2011 at any station, as concerns both the human health protection (the allowed number of exceedances of the 24-hour limit value is 3x per year, the allowed number of 1-hour limit value is 24x per year), and for the protection of ecosystems (annual average concentration and the winter period). Benzene is measured at 5 stations and there was not recorded the exceedance of the annual limit value (5 ╬╝g.m-3) at any of them. The highest value was measured at the station ├Üst├Ł nad Labem-V┼Īebo┼Öick├Ī (1.9 ╬╝g.m-3). Generally, in the recent years the concentrations measured at the stations have correspond with the station location and their values reach maximally the half of the limit value. Heavy metals (lead, arsenic, cadmium and nickel in suspended aerosol) are measured at 5 stations and there was not recorded any exceedance of the limit value for any of the metals at any station. There was one exception at the station Lom, where there was recorded a slight increase of arsenic, otherwise the trend of concentrations of all metals at all stations is decreasing. In general the 2011 pollutantsÆ concentrations in the ├Üst├Ł
nad Labem Region were comparable with the previous year. Ozone concentrations
showed, similarly as in the whole Czech Republic, the decrease of both the 26th
highest maximum daily 8-hour running averages and the number of exceedances of
the limit value (120 ╬╝g.m-3) in the average for 3 years. Tab. II.4.1.2 Days with the exceedances of the 24-hour limit value for PM10
Fig. II.4.1.29 Number of exceedances of 24-hour PM10 limit value, 36th highest 24-hour concentration and average 36th highest 24-hour concentration in selected urban and rural localities, zone ├Üst├Ł nad Labem Region, 2006ŌĆō2011
Fig. II.4.1.30 Number of days with concentrations of PM10 > 50 ╬╝g.m-3 in individual months, incl. total number of exceedances, zone ├Üst├Ł nad Labem Region, 2011
Fig. II.4.1.31 Average annual NO2 concentrations and average annual concentrations in selected urban and background localities, zone ├Üst├Ł nad Labem Region, 2006ŌĆō2011
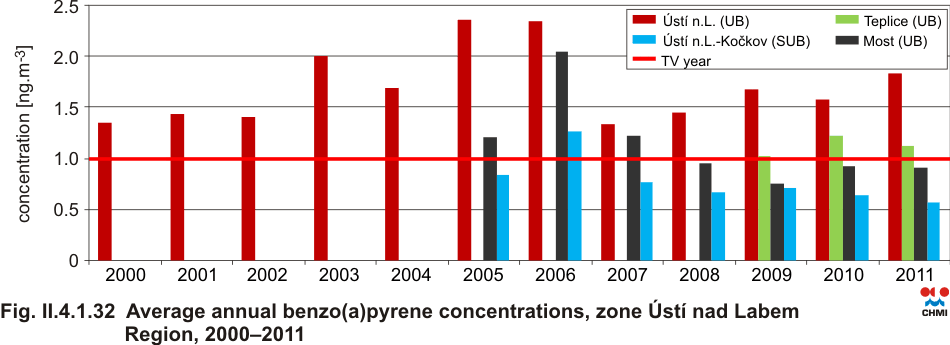
Fig. II.4.1.32 Average annual benzo(a)pyrene concentrations, zone ├Üst├Ł nad Labem Region, 2000ŌĆō2011
Fig. II.4.1.33 Numbers of exceedances of the target value of O3 in the average for three years, zone ├Üst├Ł nad Labem Region, 2006ŌĆō2011
Fig. II.4.1.34 Average annual PM10 concentrations and average concentration in selected urban and rural localities, zone ├Üst├Ł nad Labem Region, 2006ŌĆō2011
Fig. II.4.1.35 Average annual PM2.5 concentrations, zone ├Üst├Ł nad Labem Region, 2004ŌĆō2011
The zone Hradec Kr├Īlov├® Region and the zone
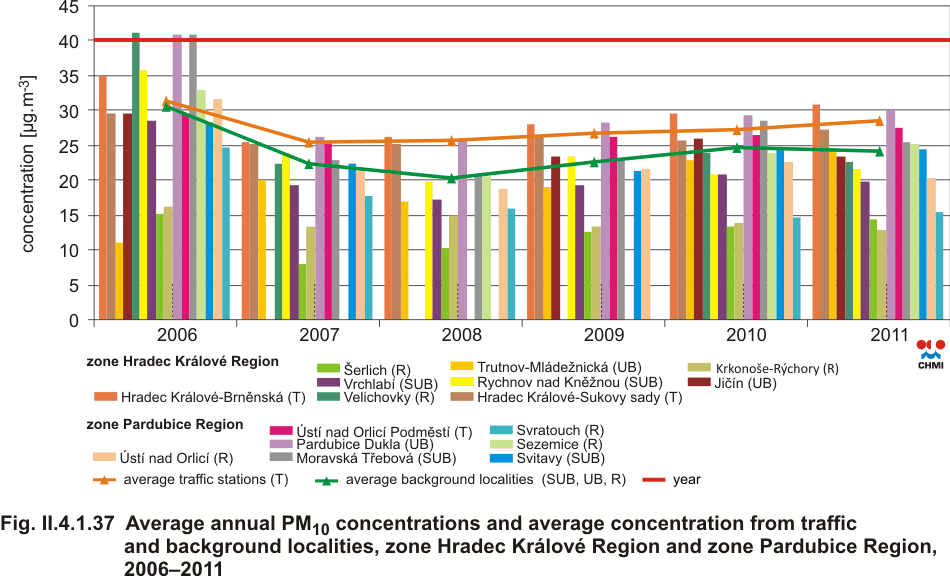
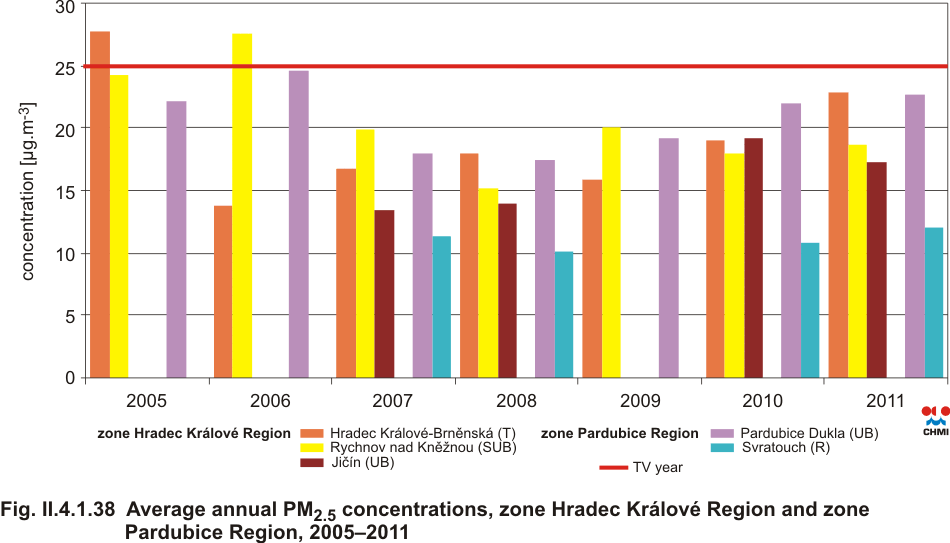
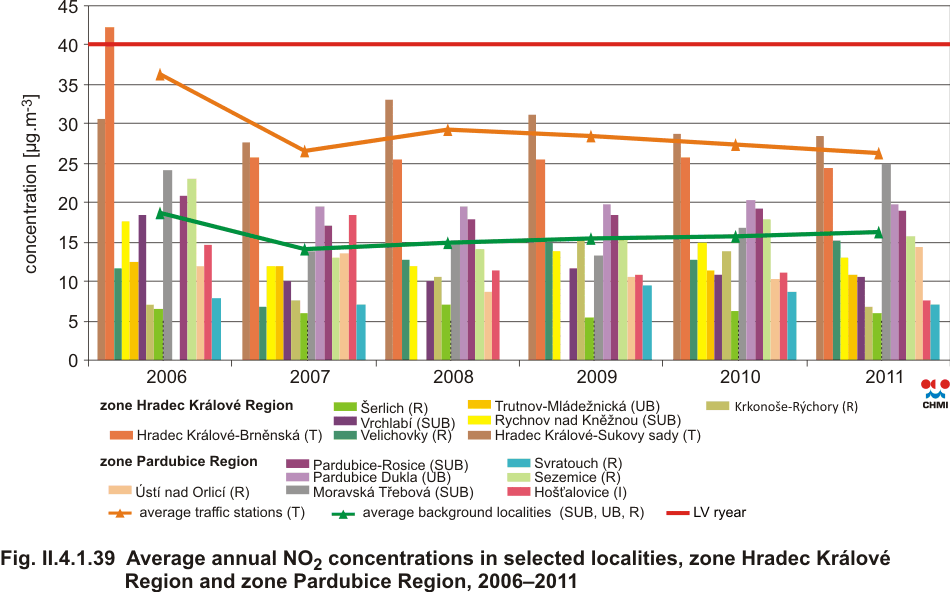
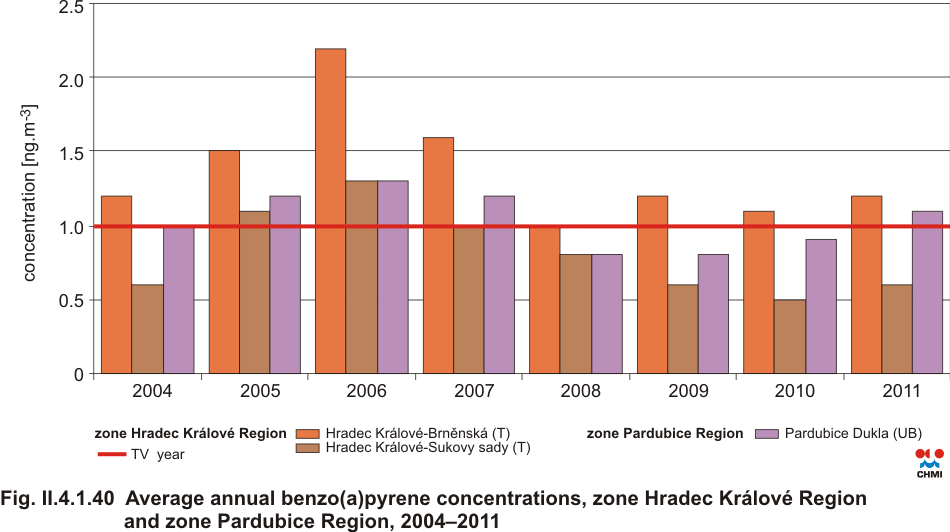
Pardubice Region Characteristic of the zones The Hradec Kr├Īlov├® Region ranks among the zones with relatively good air quality, with low number of large stationary emission sources. Historically, this zone is influenced rather by transboundary pollution caused by emissions from large sources located in the neighbouring Pardubice Region. In spite of the fact that their contribution is nowadays lower due to desulphurization, the damage of the forests in the ridge parts of the Orlick├® hory Mts. is still apparent. Recently rather small stationary sources (local heating) as well as the increasing trend of road transport have given rise to problems. The Pardubice Region is varied as concerns emission production and the resulting ambient air quality. Due to the concentration of industry, power engineering and transport, the most loaded area is the Pardubice district. Significant sources of pollutants include the power plants Elektr├Īrna Chvaletice, a.s., Elektr├Īrny Opatovice, a.s. and chemical industry (Synthesia, a.s.; Paramo, a.s.). These sources influence ambient air quality also in the surrounding areas. The areas with the lowest loads are situated in the central and northern part of the district ├Üst├Ł nad Orlic├Ł and in the southern part of the Chrudim district. At present the influence of traffic as the significant producer of ambient air pollution is increasing constantly. The problems arise in the localities with marked traffic loads, due to the lack of bypasses around big cities, and further due to local heating with combustion of non-quality fuels. In 2006ŌĆō2010 CO emissions decreased in the Hradec Kr├Īlov├® Region and starting from 2007 also in the Pardubice Region; similarly, also VOC and NOx emissions are decreasing. The converse trend was recorded starting from 2008 in emissions of TSP and NH3. In comparison with the year 2009 there occurred also a slight increase of SO2 emissions. As concerns air pollution, the significant pollutants in both evaluated zones include suspended particles of PM10 fraction, ground-level ozone and benzo(a)pyrene. In 2011 the air pollution concentrations in the territory of the Hradec Kralov├® Region and the Pardubice Region were comparable or higher as compared with the year 2010. The stable trend is recorded in annual NO2 concentrations, and in case of background localities also in annual PM10 concentrations. Traffic localities recorded a slight increase of PM10 concentrations. The limit value for the 24-hour PM10 concentration was exceeded at the stations Hradec Kr├Īlov├®-Brn─ønsk├Ī and Pardubice Dukla. The total number of exceedances of both the level 50 ╬╝g.m-3 of the limit value for the 24-hour concentration of PM10 and the value of the 36th highest 24-hour concentrations of PM10 increased, and in this respect the year 2011 is the year with the second worst air pollution loads for the recent 6 years (ranking after very unfavourable year 2006). A slight increase in comparison with the previous year was recorded also in annual benzo(a)pyrene concentrations and in annual concentrations of suspended particles of PM2.5 fraction. The number of exceedances of the target value for ground-level ozone 120 ╬╝g.m-3 increased to the level of the year 2009, the increasing trend was confirmed also by the growth of the 26th highest daily maximum 8-hour running averages of ozone concentrations. Concentrations of suspended particles PM10 and PM2.5 The measurements of concentrations of suspended particles of PM10 fraction is carried out at most stations (8 localities in the Hradec Kr├Īlov├® Region and 6 localities in the Pardubice Region). The exceedance of the 24-hour limit value for PM10 was measured at the station Hradec Kr├Īlov├®-Brn─ønsk├Ī (49x) and at the station Pardubice Dukla (45x). The period with exceedances of PM10 concentrations is almost identical in both localities and the exceedances were recorded always in connection with the occurrence of anticyclone in the cold part of the year when radiation temperature inversions and smog situations arise. The highest concentrations of PM10 suspended particles were measured on 31.1.2011 (Hradec Kr├Īlov├®-Brn─ønsk├Ī 146.3 ╬╝g.m-3, Pardubice Dukla 137.6 ╬╝g.m-3), when the bulge of the Azores anticyclone reached the central Europe from the southwest. Similar unfavourable situation occurred also in the second half of February with the culmination on 24.ŌĆō26.2.2011. In these days the bulge of the massive Siberian anticyclone reached the central Europe from the east. Unfavourable dispersion conditions occurred also during the autumn. From 30 October to 4 November the weather in the Czech Republic was influenced by the edge of the extensive anticyclone with the centre above the Ukraine, and starting from 5 November the territory of the Czech Republic was temporarily influenced by the trough of low pressure associated with the cyclone above the Mediterranean. On the following days this cyclone filled in and during the night of 10/11 November the cold front moved over central Europe from the northeast, which caused the temporary decrease of PM10 concentrations. Behind it, in the cold air, the area of high pressure spread from the eastern Russia over the eastern, central and southeastern Europe associated with re-occurrence of above-the-limit PM10 concentrations, which lasted until 18.11.2011. As compared with the year 2010 the 24-hour limit value for PM10 was not exceeded at the station Moravsk├Ī T┼Öebov├Ī, nevertheless the number of the above-the-limit concentrations exceeding 50 ╬╝g.m-3 was the third highest in both assessed zones (Fig. II.4.1.36). Higher level of air pollution caused by PM10 is probably connected with the existence of the industrial zone opened in the year 2000 at the western margin of the Moravsk├Ī T┼Öebov├Ī about 0.5ŌĆō1 km from the measuring station. Up to the years 2006 the zone was almost completely full and at present there are 6 industrial plants with ca 500 employees. The increased frequency of traffic in connection with the industrial zone is confirmed also by the growth of NO2 concentrations. The total extent of air pollution caused by PM10 particles is increasing. After very unfavourable year 2006 the year 2011 is the second most loaded year over the recent 6 years. This is apparent from the increase of the values of the 36th highest 24-hour concentrations and also from the values of annual averages of PM10 concentrations. In comparison with the year 2010 the level of air pollution in background localities rather stagnates, and there is an increasing trend at traffic localities. The limit value for the annual average of PM10 concentrations has not been exceeded at any station since 2007 (Fig. II.4.1.37). The concentrations of PM2.5 particles are monitored in three localities in the Hradec Kr├Īlov├® Region and in two localities in the Pardubice Region. The limit value was not eexceeded at any of the stations in 2011(Fig. II.4.1.38). The highest average annual concentrations of PM2.5 were measured at the stations Hradec Kr├Īlov├®-Brn─ønsk├Ī (22.9 ╬╝g.m-3) and Pardubice Dukla (22.6 ╬╝g.m-3) and they are almost identical. The third highest level of air pollution caused by PM2.5 particles was measured at the station in Rychnov nad Kn─ø┼Šnou. This locality recorded the highest average annual PM2.5 concentrations in the territory of both zones in the years 2006, 2007 and 2009. As compared with the increasing concentrations of these particles at the stations in Hradec Kr├Īlov├® and Pardubice, the average annual concentrations at the station in Rychnov nad Kn─ø┼Šnou have remained at approx. same level since 2010. This trend is confirmed also by the stagnating concentrations of PM10 particles. There was not any negative influence on the measurement due to building activities carried out nearby the station from early 2010 to April 2011. Nitrogen dioxide The concentrations of nitrogen dioxide (NO2) were measured in 8 localities in total in the Hradec Kralov├® Region and in 7 localities in the Pardubice Region. The annual limit value of NO2 was not exceeded at any station (Fig. II.4.1.39). The concentrations in traffic localities are approximately double as against those at background stations. The total level of air pollution at both types of stations has remained stable since 2008. The highest annual averages in the Hradec Kr├Īlov├® Region were measured at traffic stations Hradec Kr├Īlov├®-Brn─ønsk├Ī (24.3 ╬╝g.m-3) and Hradec Kr├Īlov├®-Sukovy sady (28.5 ╬╝g.m-3); at the background stations the highest concentration of NO2 was recorded at the station Velichovky (15.1 ╬╝g.m-3). In the Pardubice Region the highest annual concentration was recorded at the background station Moravsk├Ī T┼Öebov├Ī (25 ╬╝g.m-3). The level of air pollution in 2011 caused by NO2, continuously increasing at this station since 2007, is comparable with the traffic station Hradec Kr├Īlov├®-Brn─ønsk├Ī and it is connected with the existence of the nearby industrial zone. Higher levels of traffic loads result also in the increased concentrations of PM10 particles. NO2 concentrations measured at the station Ho┼Ī┼źalovice show low levels; during the northwest circulation of air this station is influenced by the power station Elektr├Īrna Chvaletice. Benzo(a)pyrene Benzo(a)pyrene concentrations are monitored at traffic stations Hradec Kr├Īlov├®-Brn─ønsk├Ī, Hradec Kr├Īlov├®-Sukovy sady and at the urban background station Pardubice Dukla. The annual limit value has been continuously exceeded since 2004 at the station Hradec Kr├Īlov├®-Brn─ønsk├Ī. In 2011, after the period of below-the-limit annual benzo(a)pyrene concentrations in the years 2008ŌĆō2010, the limit value was exceeded again also at the station Pardubice Dukla. At the station Hradec Kr├Īlov├®-Sukovy sady the concentrations have remained below the limit value since 2008, now they reach approximately the half of the level recorded at the station Hradec Kr├Īlov├®-Brn─ønsk├Ī (Fig. II.4.1.40). The exceedance of the limit value is influenced mainly by the increased benzo(a)pyrene concentrations in the winter period connected with local heating. Ground-level ozone The concentrations of ground-level ozone are measured in 5 localities in the Hradec Kr├Īlov├® Region and in 3 localities in the Pardubice Region. Continual exceedances of the target value for the protection of human health (number of exceedances in the three-year average higher than 25) occur only at the station Krkono┼Īe-R├Įchory (Fig. II.4.1.41). There is an apparent increasing trend of the number of target value exceedances in the average for the period 2009ŌĆō2011 as compared with the period 2008ŌĆō2010 at almost all monitored stations. There is one exception, and namely the station Hradec Kr├Īlov├®-Brn─ønsk├Ī, where during the period 2007ŌĆō2009 the number of exceedances decreased. Other pollutants The levels of average annual concentrations of benzene at the stations Hradec Kr├Īlov├®-Brn─ønsk├Ī (1.0 ╬╝g.m-3), Pardubice Rosice (1.4 ╬╝g.m-3) and Pardubice Dukla (1.1 ╬╝g.m-3) remained below the limit value (5 ╬╝g.m-3) in 2011. The measured concentrations of heavy metals in the territory of the Hradec Kr├Īlov├® Region and Pardubice Region do not reach the limit values. The highest annual average concentrations are detected at traffic stations. In case of arsenic and lead the highest levels are recorded at the stations Hradec Kr├Īlov├®-Brn─ønsk├Ī and ├Üst├Ł nad Orlic├Ł-Podm─øst├Ł, the highest concentrations of nickel and cadmium were recorded at the station Hradec Kr├Īlov├®-Sukovy sady. As concerns sulphur dioxide, neither the limit value for 1-hour concentration nor the limit value for 24-hour concentration were exceeded in the two evaluated zones. The station Pardubice Dukla recorded one case of exceedance of the 1-hour limit value (350 ╬╝g.m-3) with the measured value 408.2 ╬╝g.m-3. The maximum tolerated number of exceedances is 24 per year. The sporadic above-the-limit 1-hour SO2 concentrations occurring also in the recent years were probably caused by emissions from industrial plants, with regard to their occurrence outside the heating season. The measured maximum daily 8-hour running averages of carbon monoxide are far below the limit value in the territory of the Hradec Kr├Īlov├® Region and Pardubice Region, similarly as in the whole Czech Republic.
Fig. II.4.1.36 Number of exceedances of 24-hour PM10 limit value in the given year and average 36th highest 24-hour concentration from traffic and background localities, zone Hradec Kr├Īlov├® Region and zone Pardubice Region, 2006ŌĆō2011
Fig. II.4.1.37 Average annual PM10 concentrations and average concentration from traffic and background localities, zone Hradec Kr├Īlov├® Region and zone Pardubice Region, 2006ŌĆō2011
Fig. II.4.1.38 Average annual PM2.5 concentrations, zone Hradec Kr├Īlov├® Region and zone Pardubice Region, 2005ŌĆō2011
Fig. II.4.1.39 Average annual NO2 concentrations in selected localities, zone Hradec Kr├Īlov├® Region and zone Pardubice Region, 2006ŌĆō2011
Fig. II.4.1.40 Average annual benzo(a)pyrene concentrations, zone Hradec Kr├Īlov├® Region and zone Pardubice Region, 2004ŌĆō2011
Fig. II.4.1.41 Numbers of exceedances of the target value of O3 in the average for three years, zone Hradec Kr├Īlov├® Region and zone Pardubice Region, 2006ŌĆō2011
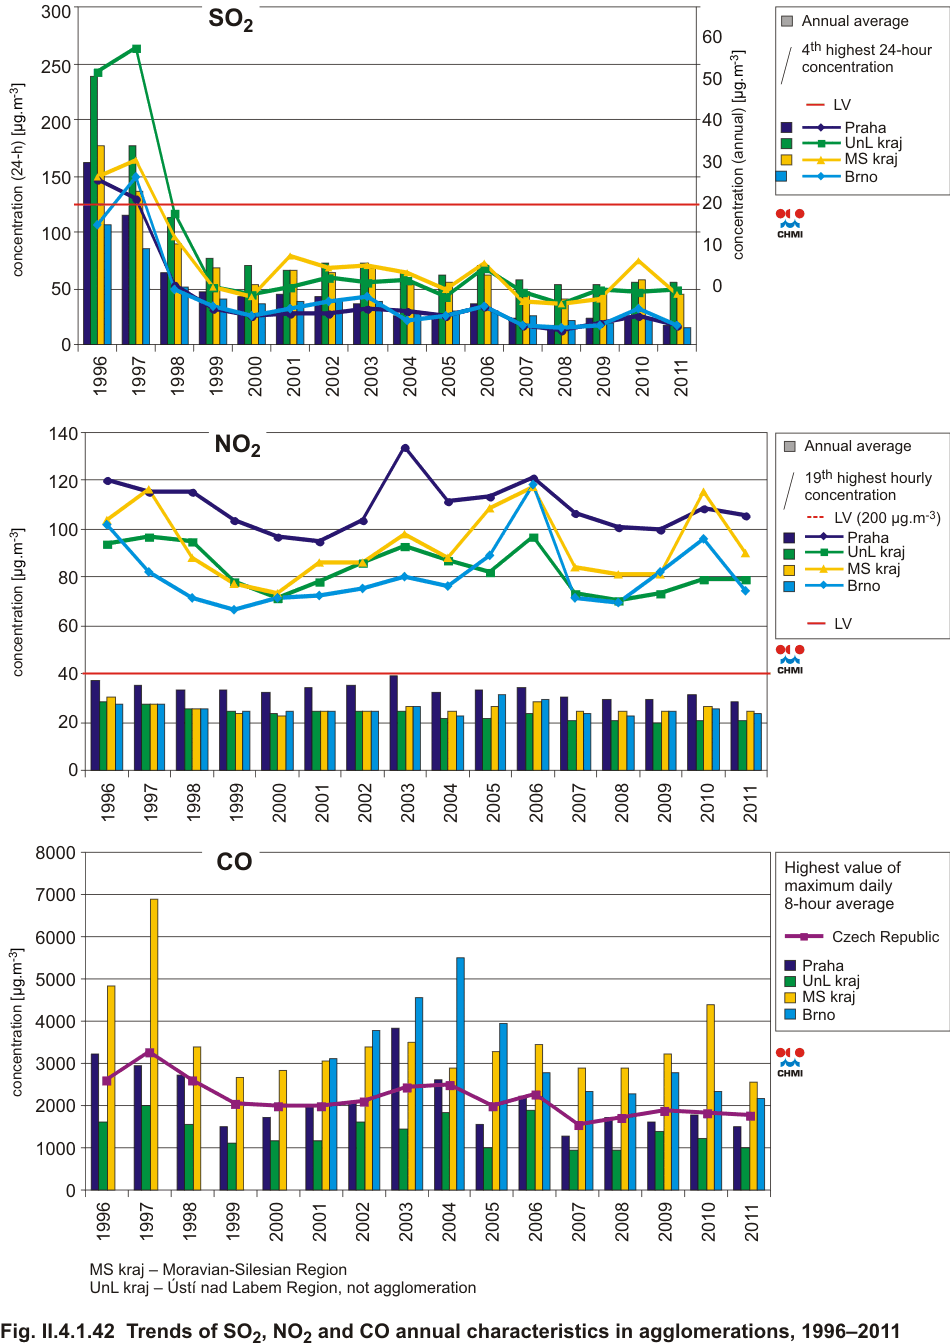
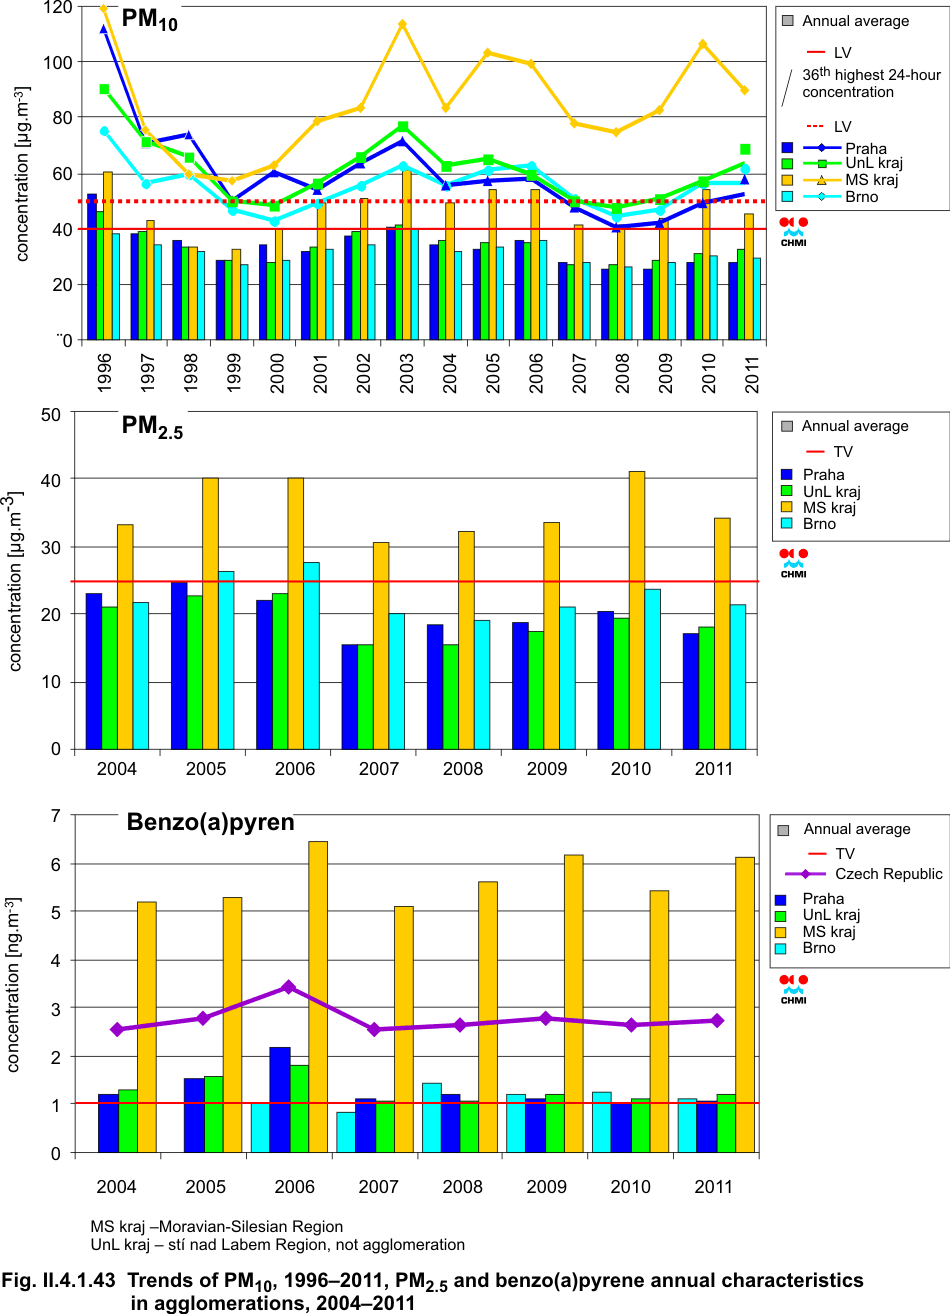
The trends of SO2, PM10, NO2 and CO annual air pollution characteristics for the period 1996ŌĆō2011, of benzo(a)pyrene and PM2.5 for the period 2004ŌĆō2011 for the agglomerations Prague, Brno and the Moravian-Silesian Region (further on agglomerations) and for the zone ├Üst├Ł nad Labem Region (further on zone) are depicted in Figs. II.4.1.42 and II.4.1.43. In the period from 1996 to 1999 there was a significant decreasing trend in SO2 and PM10 concentrations in the mentioned agglomerations and the zone. The greatest decrease of SO2 concentrations was recorded in the zone ├Üst├Ł nad Labem Region and the greatest decrease of PM10 concentrations was recorded in the agglomerations Moravian-Silesian Region and Prague. In comparison with SO2 and PM10 NO2 concentrations decreased slightly. In the following years 2000ŌĆō2001 the decreasing trend of all pollutants except CO was interrupted and, on the contrary, SO2 concentrations increased in the Moravian-Silesian Region and NO2 concentrations increased in all agglomerations and the zone. Significant increase of PM10 concentrations in 2000ŌĆō2001 was recorded mainly in the agglomeration Moravian-Silesian Region. CO concentrations have remained at similar level since 1999. The increasing trend of PM10 and NO2 concentrations continued in all agglomerations up to 2003 when there were recorded high concentrations of pollutants comparable with the levels measured in 1996. High pollutantsÆ concentrations in 2003 were caused both by unfavourable dispersion conditions in February and December and by subnormal level of precipitation amounts. In 2004, on the contrary, the ambient air pollution caused by SO2, PM10 a NO2 decreased in the agglomerations and the zone. Starting from 2005 all evaluated areas recorded the increasing trend in NO2, which was confirmed in 2006. As concerns PM10 and PM2.5, there was a similar characteristic increase in 2005, with the steepest progress in the agglomeration Moravian-Silesian Region. In 2006 the increasing trend of PM10 concentrations continued and as concerns PM2.5, this increasing trend was recorded in all monitored areas except for Prague. The increase of pollutantsÆ concentrations in the years 2005 and 2006 is given mainly by deteriorated dispersion conditions. In 2006 these unfavourable meteorological conditions occurred in the whole territory of the Czech Republic. In the ├Üst├Ł nad Labem Region and in the Moravian-Silesian Region, on the contrary, there was recorded a very slight decrease of 24-hour PM10 concentrations and the stagnation of annual PM10 concentrations. In 2007 there was a marked decrease of air pollution caused by SO2, PM10, PM2.5, NO2 and CO in all agglomerations. The steepest decrease is apparent, after the previous increase, in hourly NO2 concentrations in Brno. The decrease of pollutantsÆ concentrations in the ambient air was influenced by more favourable meteorological and dispersion conditions in 2007. In 2008 the decrease of SO2, PM10 and NO2 concentrations continued, but it was not as steep as in the previous year. PM2.5 concentrations mostly stagnated. In 2009 the PM10 and PM2.5 concentrations in agglomerations increased. The most prominent increase was recorded in the Moravian-Silesian Region. The increase of NO2 concentrations was recorded in Brno, in other agglomerations the concentrations rather stagnated. The increase of concentrations of pollutants was influenced by less favourable meteorological and dispersion conditions, particularly in January, February and December 2009 as compared with the previous year. In 2010 the increase of concentrations continued in all pollutants in all agglomerations. The highest year-to year increase of PM10 concentrations was recorded in the Moravian-Silesian Region, where the year-to-year increase of average PM10 concentration increased by 10 ╬╝g.m-3; in the remaining agglomerations the year-to-year increase of PM10 was about 2.5 ╬╝g.m-3. The annual average concentrations of PM2.5 also increased in all agglomerations; the highest increase was recorded again in the Moravian-Silesian Region (in the year-to-year comparison by 7.5 ╬╝g.m-3), Further marked increase was recorded in NO2, and namely in the 19th highest hourly concentration in the Moravian-Silesian Region, the second highest increase of NO2 was recorded in the Brno agglomeration. The increase of pollutantsÆ concentrations in 2010 was caused by repeated occurrence of unfavourable meteorological and dispersion conditions in the winter period, both at the beginning of the year (January and February) and at the end of the year (October and December). In 2011, on the contrary, the increase of concentrations in most pollutants in most air pollution characteristics stopped and started to decrease, with the exception of PM10 concentrations which recorded the increase. The year-to- year comparison shows that the 36th highest 24-hour concentration increased in the agglomeration Prague and in the zone ├Üst├Ł nad Labem Region. On the contrary, the decrease of the 36th highest 24-hour concentration was recorded in the Moravian-Silesian Region, and namely 16 ╬╝g.m-3 (15 % in the year-to-year comparison). Nevertheless, PM10 concentrations in these areas remain above the level of the daily limit values. The average annual PM10 concentrations recorded the decrease in the agglomeration Moravian-Silesian Region and a slight decrease in the agglomeration Brno. The average annual concentrations of PM10 in the Prague agglomeration stagnate, and they slightly increased in the zone ├Üst├Ł nad Labem Region. The annual average concentrations of fine particles PM2.5 decreased in all the mentioned areas, the most significant decrease was recorded in the agglomerations Moravian-Silesian Region (17 %) and Prague (15 %). However, in the Moravian-Silesian Region, in spite of their decrease, they exceed by more than one third the level of the limit value. The concentrations of the remaining pollutants (SO2, NO2 and CO) stay below the respective limit values and as concerns the years-to-year comparison their decrease or stagnation were recorded. Most distinct relative decrease was recorded in SO2 concentrations in both air pollution characteristics in all areas with the exception of the zone ├Üst├Ł nad Labem Region. SO2 concentrations in the ├Üst├Ł nad Labem Region show their stagnation (annual average) or slight increase (4th highest 24-hour concentration). Although the dispersion conditions mainly in the months February and November were unfavourable, the length of the 2011 heating season was subnormal and at the similar level as in the years 2008 and 2009. This resulted in the decrease of TSP, SO2, NOx and CO emissions from household rating. Generally, it can be stated that the concentrations of ambient air pollutants, after their increase in 2010, with the exception of suspended particles, returned to the levels of the years 2008 and 2009. For the first time also the trends of average annual benzo(a)pyrene concentrations are assessed. The set target value for benzo(a)pyrene concentrations is 1 ng.m-3. In all agglomerations and in the zone ├Üst├Ł nad Labem Region the average annual concentrations stay above the limit value (with the exception of concentrations in 2007 in the agglomeration Brno). The highest benzo(a)pyrene concentrations are reached again in the agglomeration Moravian-Silesian Region with the fivefold to sextuple exceedance of the level of the target value. The highest concentrations were measured, similarly as in other pollutants, in 2006. The 2009/2010 year-to-year comparison shows that benzo(a)pyrene concentrations increased in all assessed areas with the exception of the Brno agglomeration.
Fig. II.4.1.42 Trends of SO2, NO2 and CO annual characteristics in agglomerations, 1996ŌĆō2011
Fig. II.4.1.43 Trends of PM10, PM2.5 and benzo(a)pyrene annual characteristics in agglomerations, 1996ŌĆō2011
|