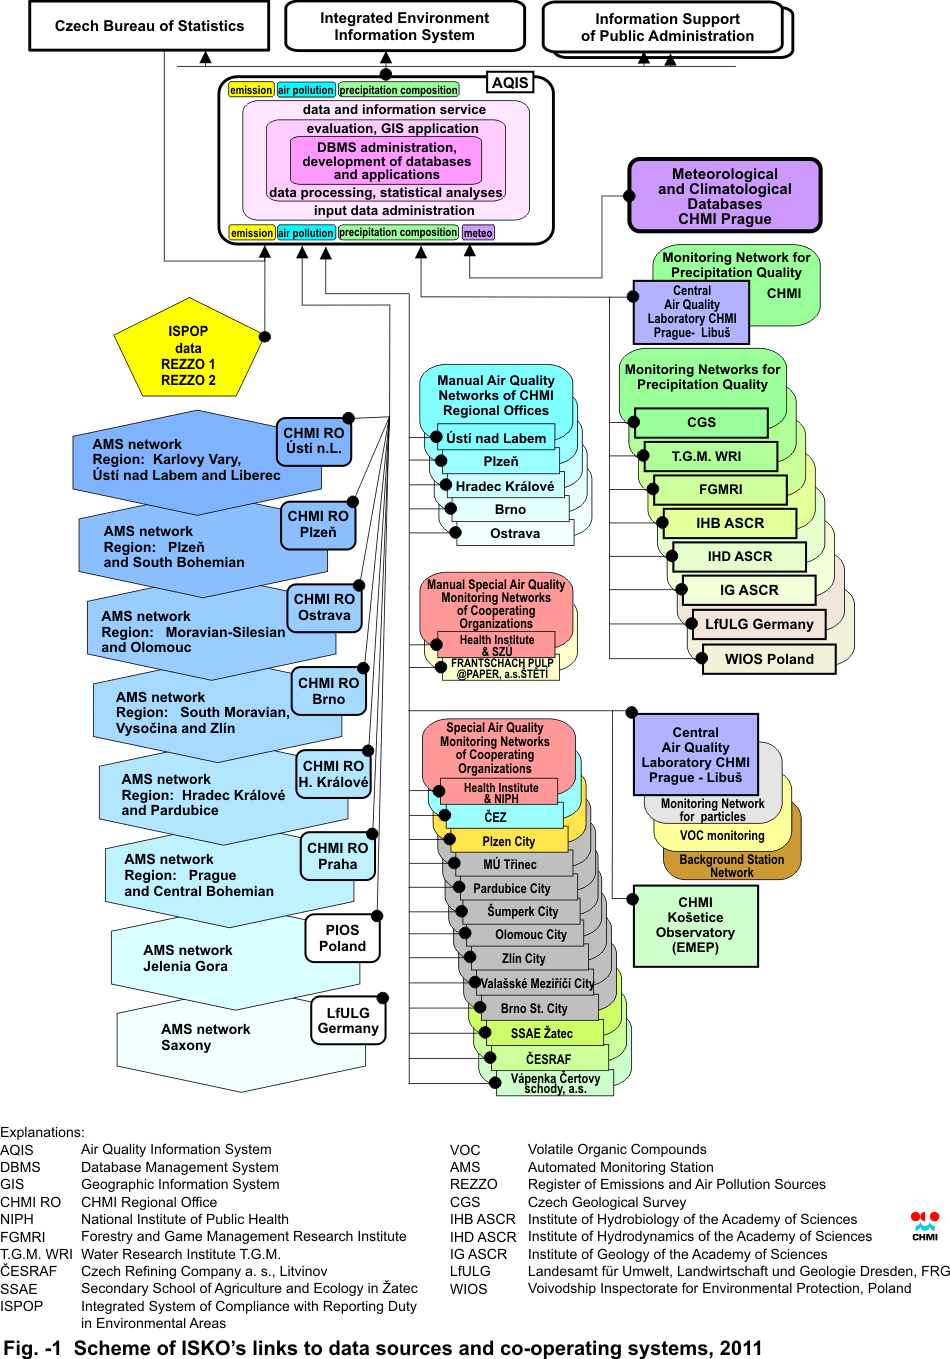
| Fig. –1 |
Scheme of ISKO’s links to data sources and co-operating systems
2011 |
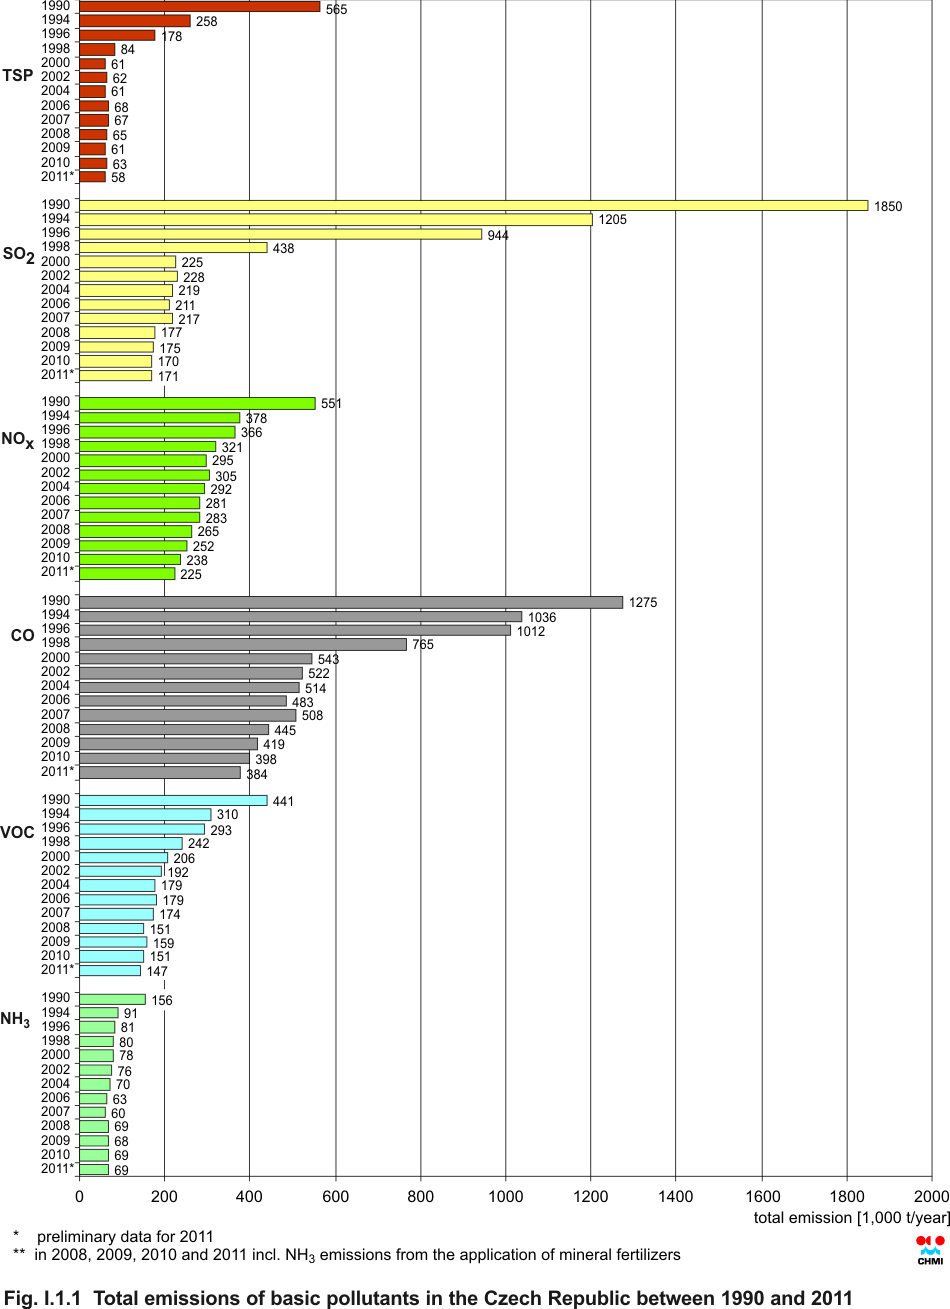
| Fig. I.1.1 |
Total emissions of basic pollutants in the Czech Republic between
1990 and 2011 |
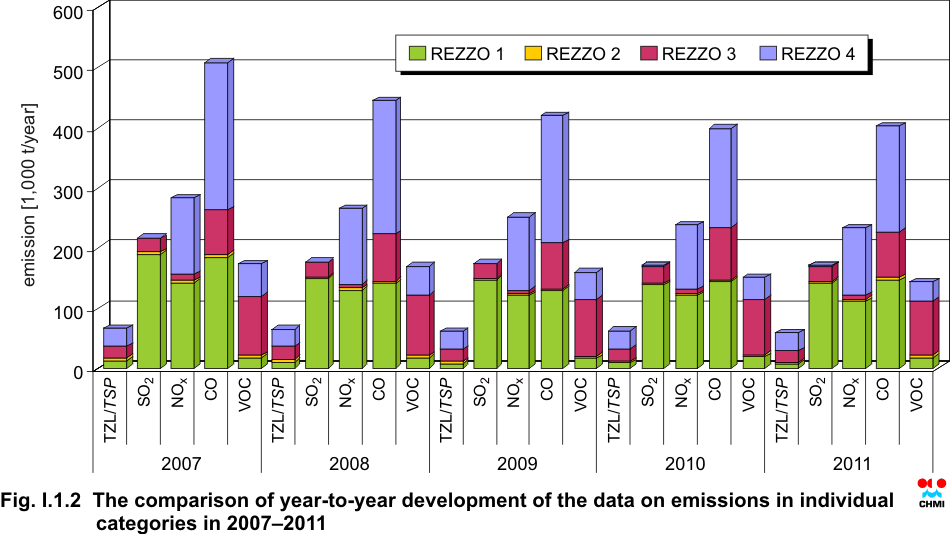
| Fig. I.1.2 |
The comparison of year-to-year development of the data on emissions
in individual categories in 2007–2011 |
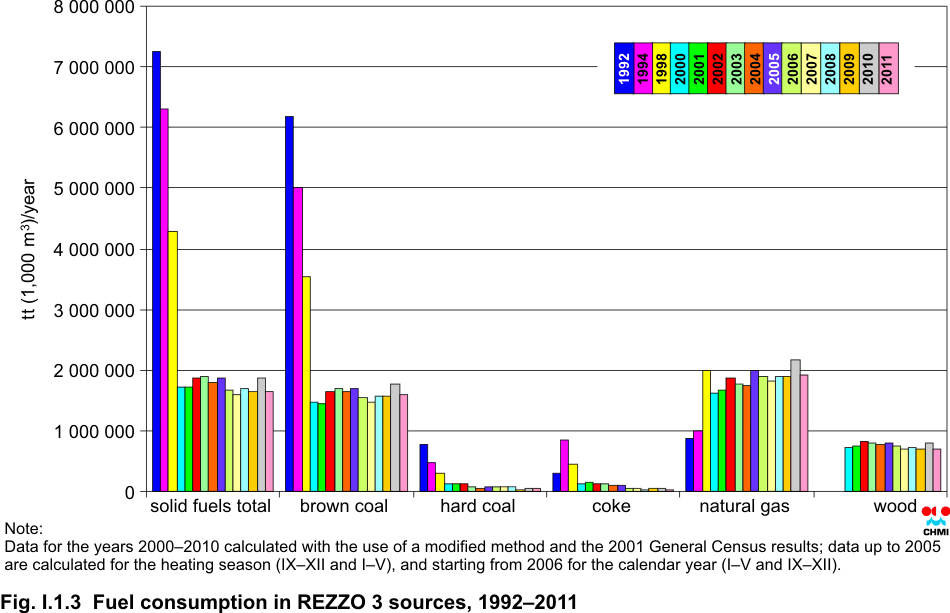
| Fig. I.1.3 |
Fuel consumption in REZZO 3 sources, 1992–2011 |
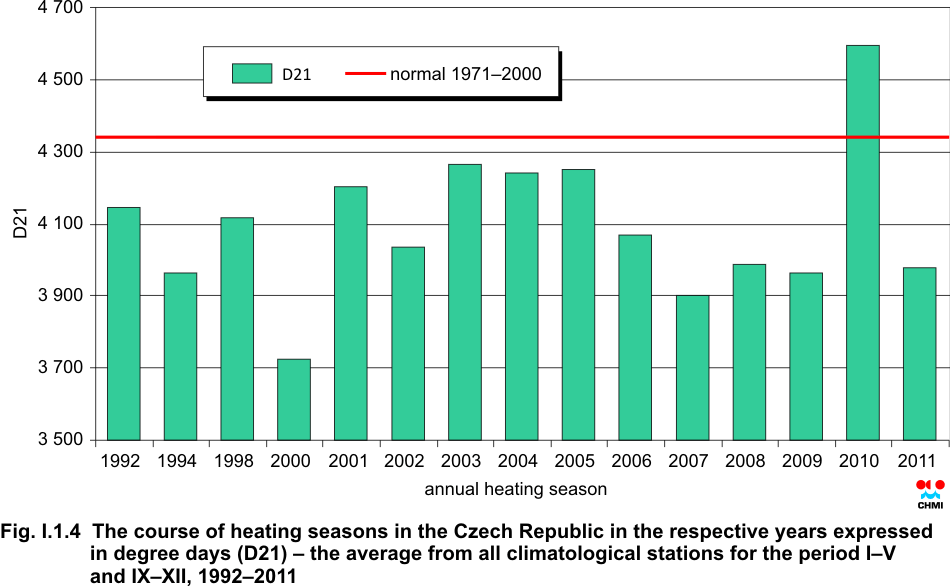
| Fig. I.1.4 |
The course of heating seasons in the Czech Republic in the
respective years expressed in degree days (D21) – the average from all
climatological stations for the period I–V and IX–XII, 1992–2011 |
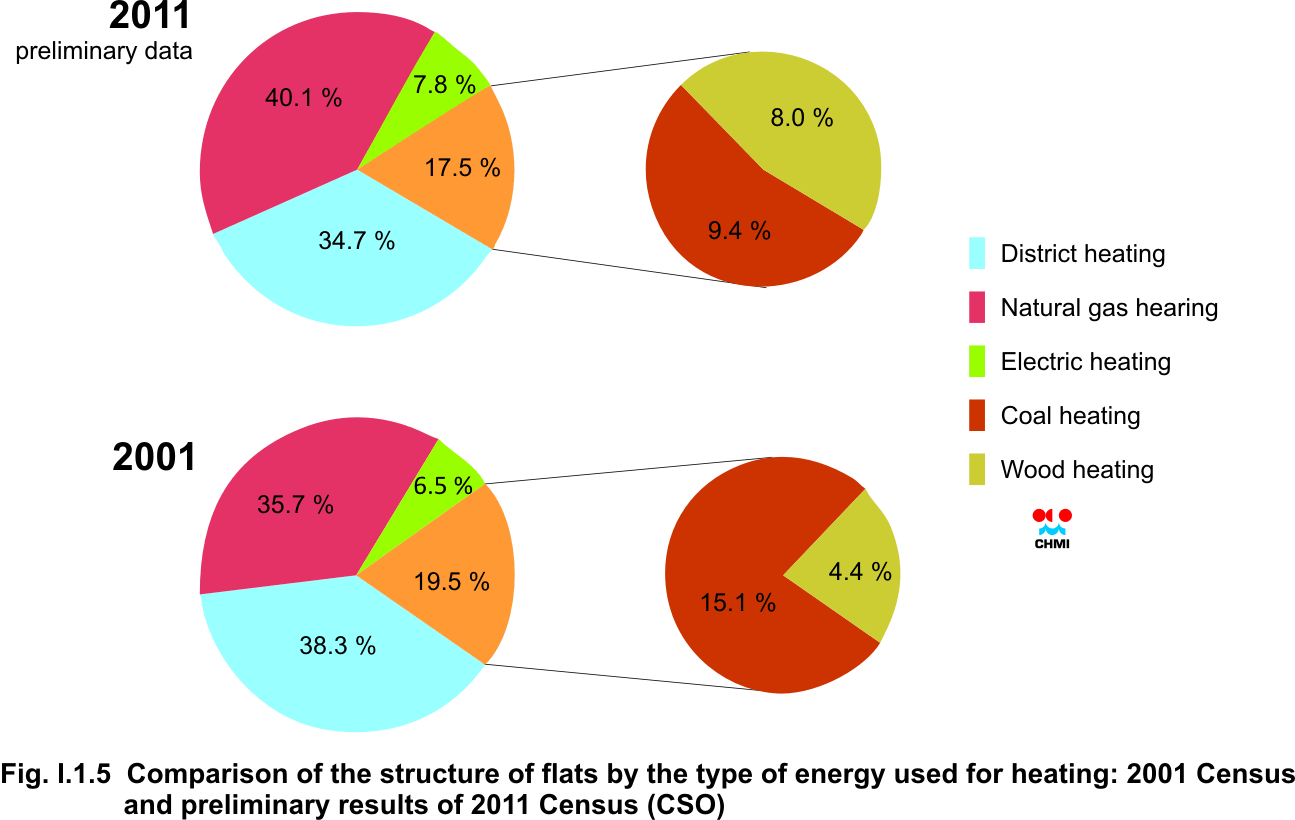
| Fig. I.1.5 |
Comparison of the structure of flats by the type of energy used for
heating: 2001 Census and preliminary results of 2011 Census (CSO) |
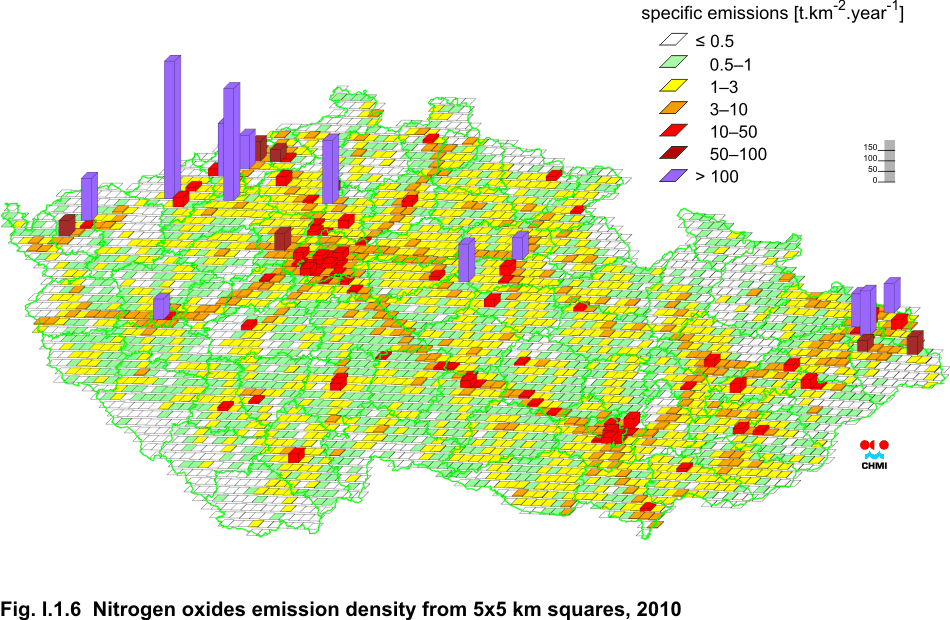
| Fig. I.1.6 |
Nitrogen oxides emission density from 5x5 km squares, 2010 |
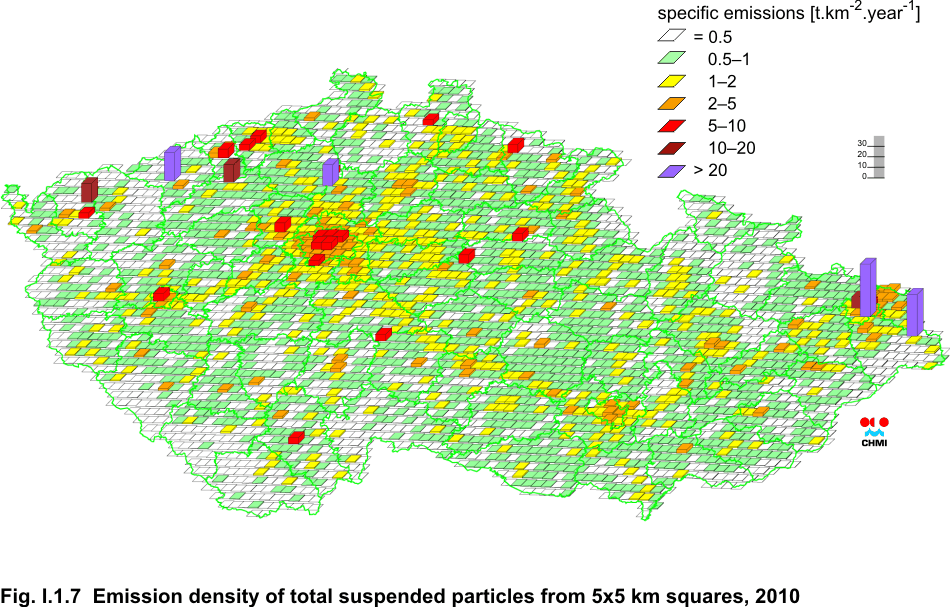
| Fig. I.1.7 |
Emission density of total suspended particles from 5x5 km squares,
2010 |
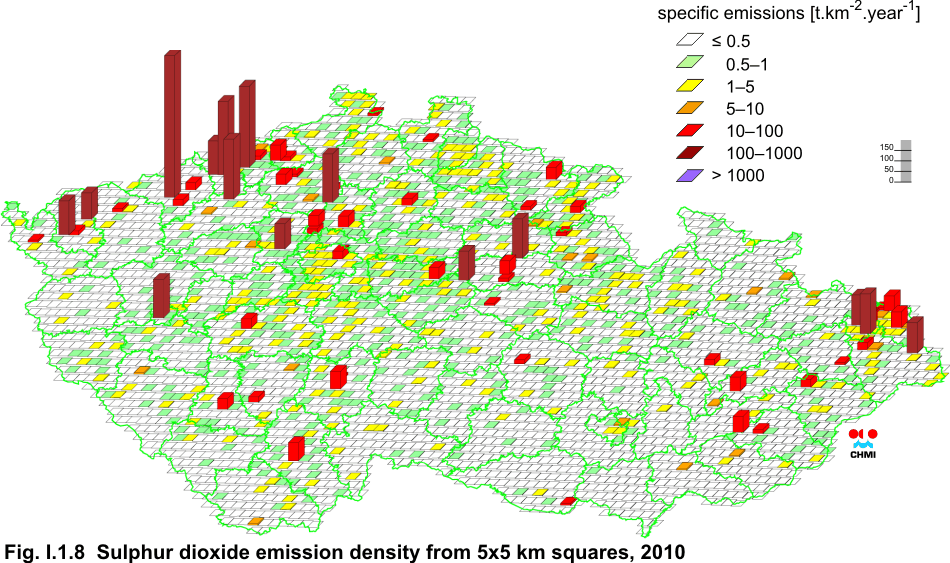
| Fig. I.1.8 |
Sulphur dioxide emission density from 5x5 km squares, 2010 |
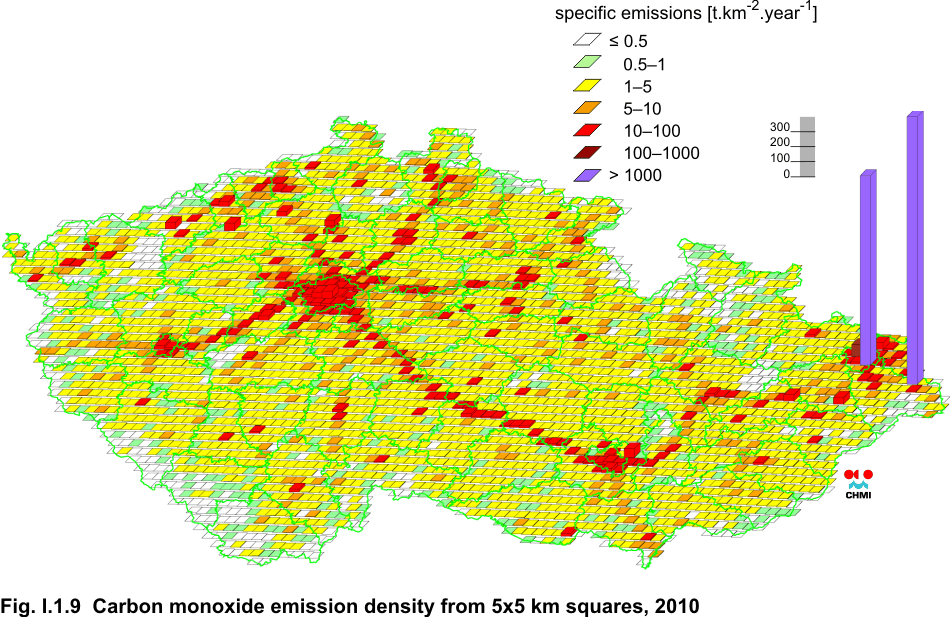
| Fig. I.1.9 |
Carbon monoxide emission density from 5x5 km squares, 2010 |
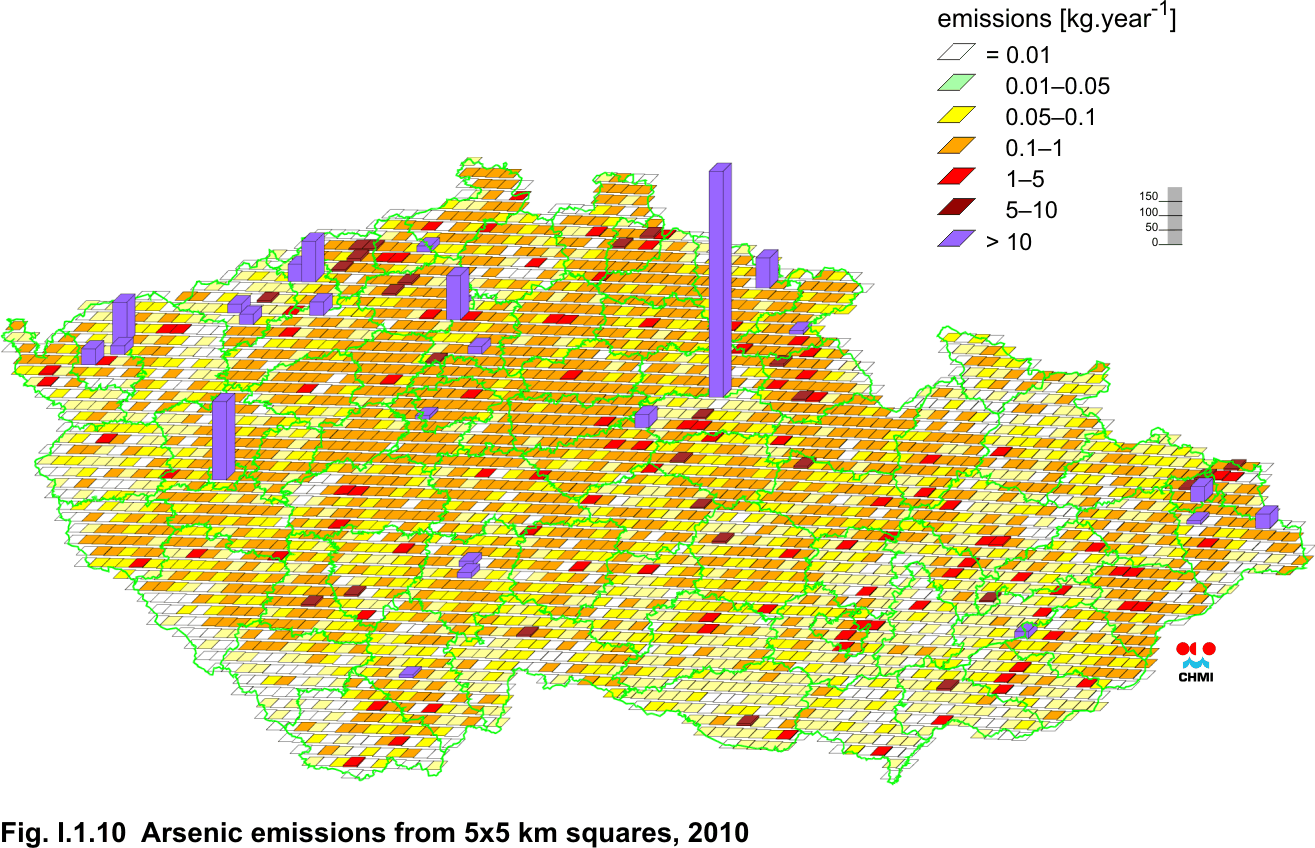
| Fig. I.1.10 |
Arsenic emissions from 5x5 km squares, 2010 |
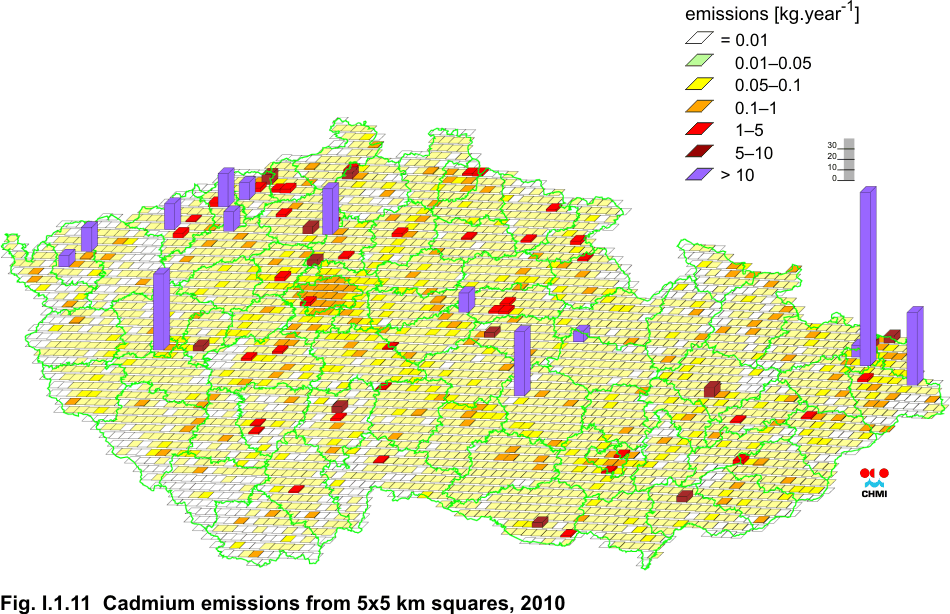
| Fig. I.1.11 |
Cadmium emissions from 5x5 km squares, 2010 |
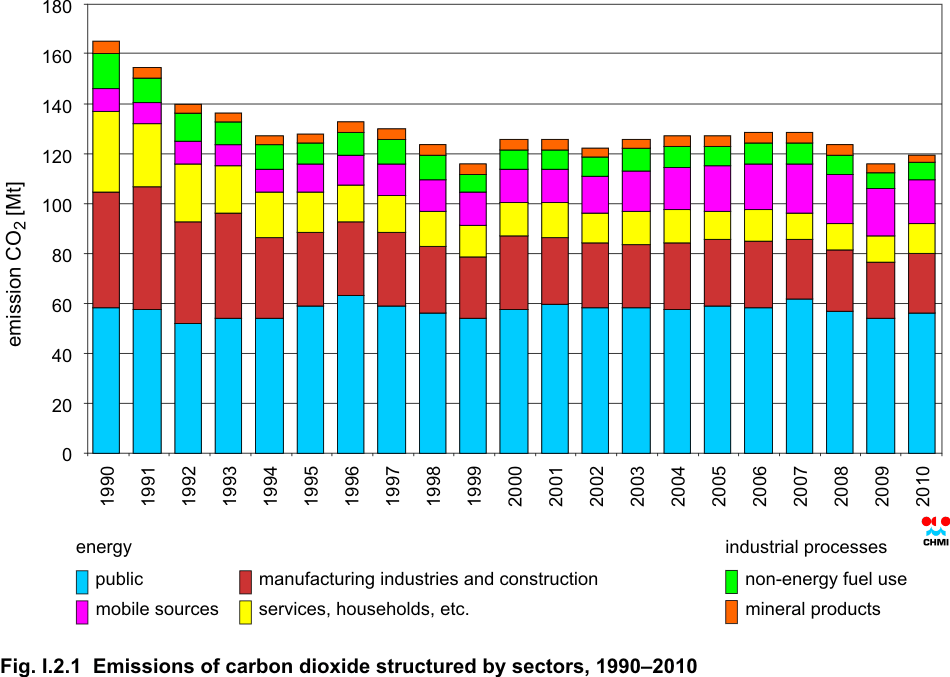
| Fig. I.2.1 |
Emissions of carbon dioxide structured by sectors, 1990–2010 |
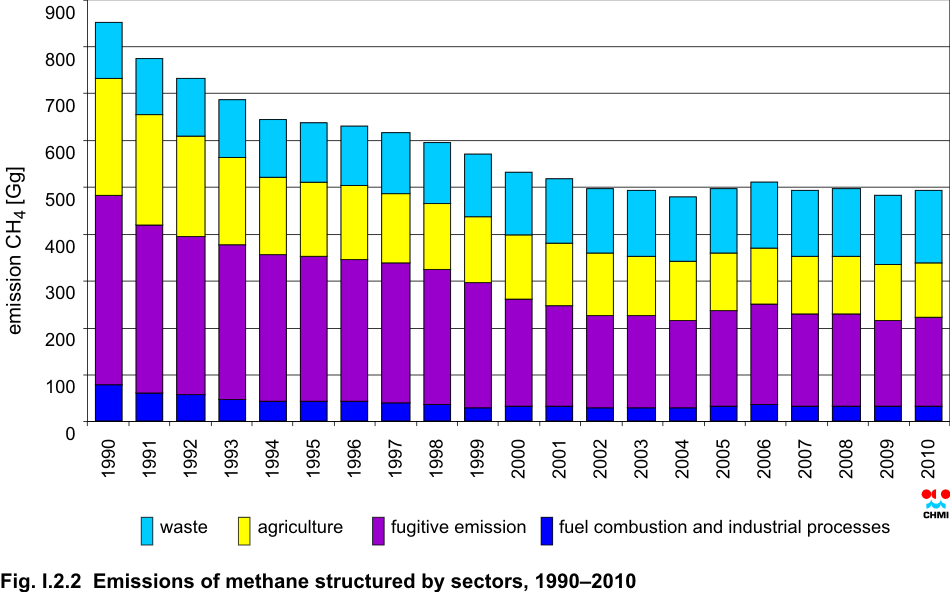
| Fig. I.2.2 |
Emissions of methane structured by sectors, 1990–2010 |
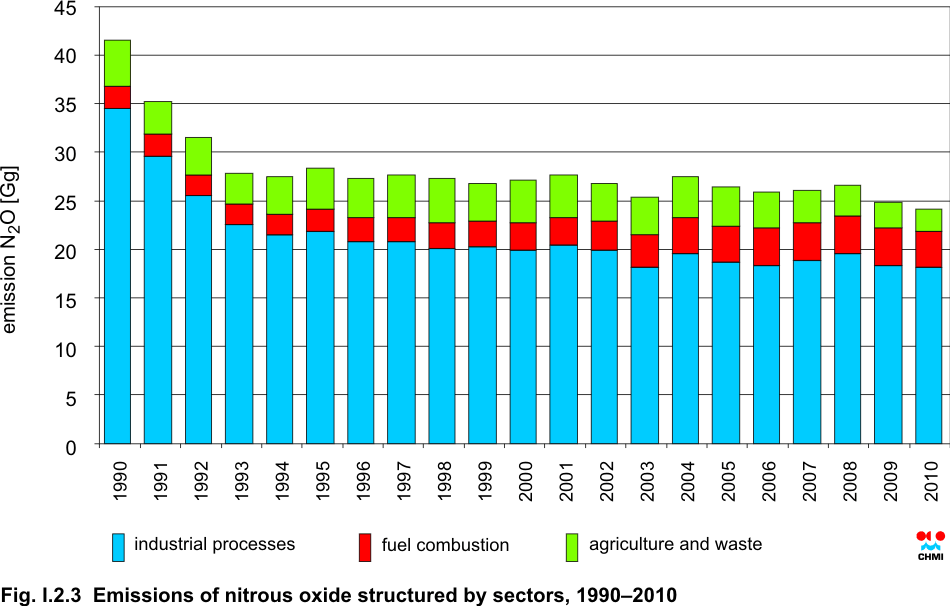
| Fig. I.2.3 |
Emissions of nitrous oxide structured by sectors, 1990–2010 |
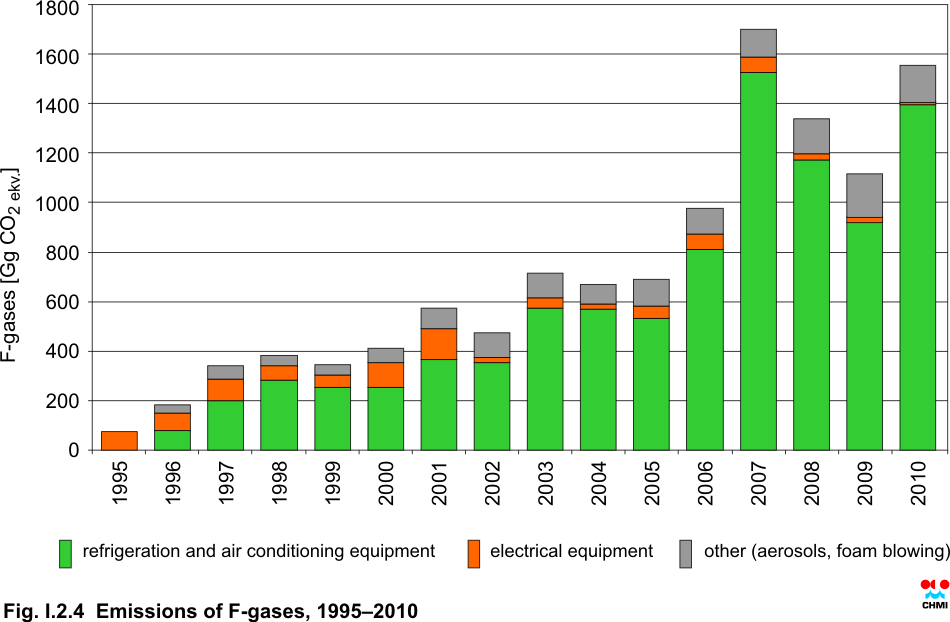
| Fig. I.2.4 |
Emissions of F-gases, 1995–2010 |
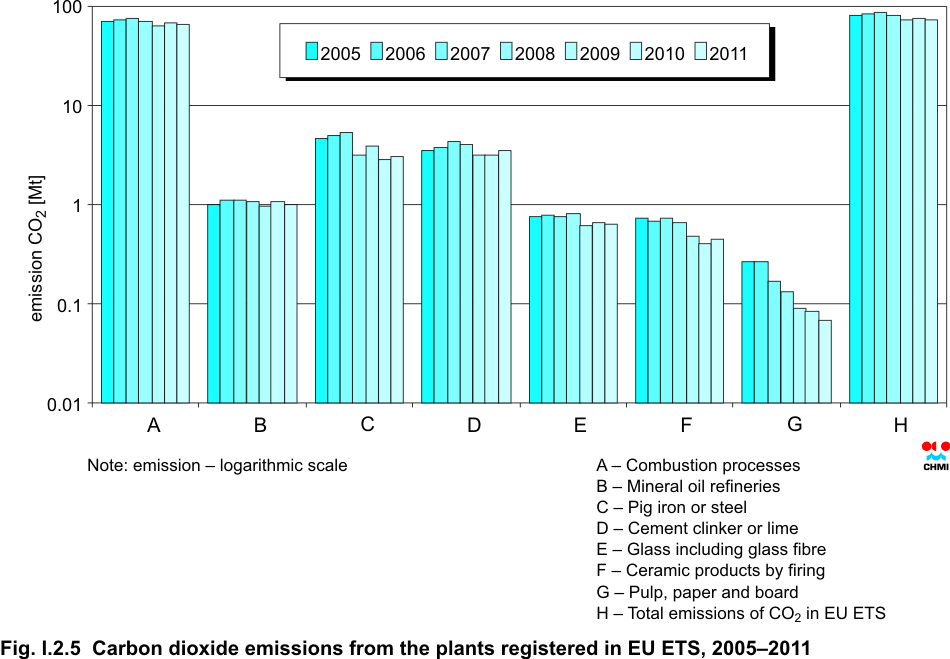
| Fig. I.2.5 |
Carbon dioxide emissions from the plants registered in EU ETS,
1995–2011 |
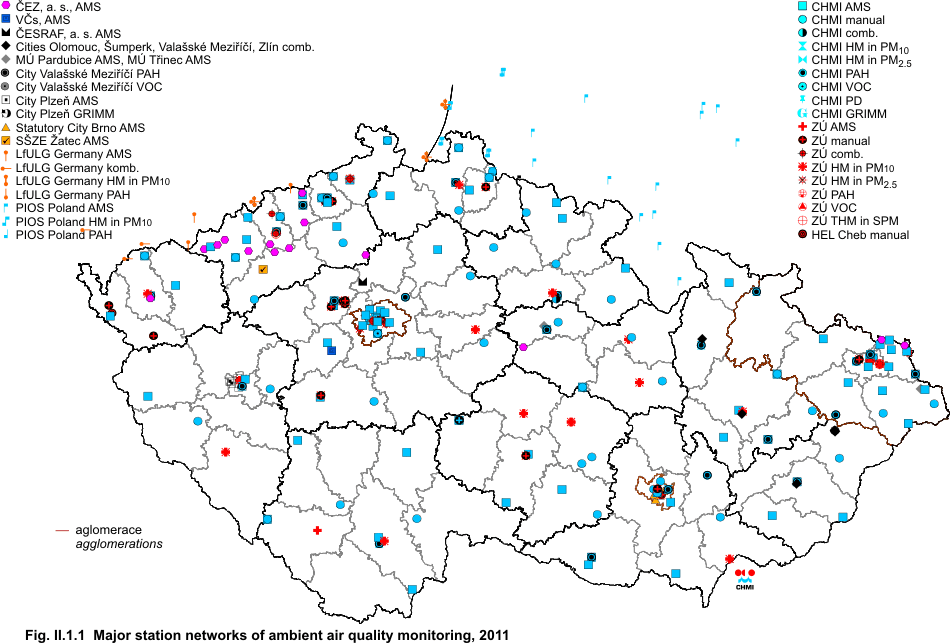
| Fig. II.1.1 |
Major station networks of ambient air quality monitoring, 2011 |
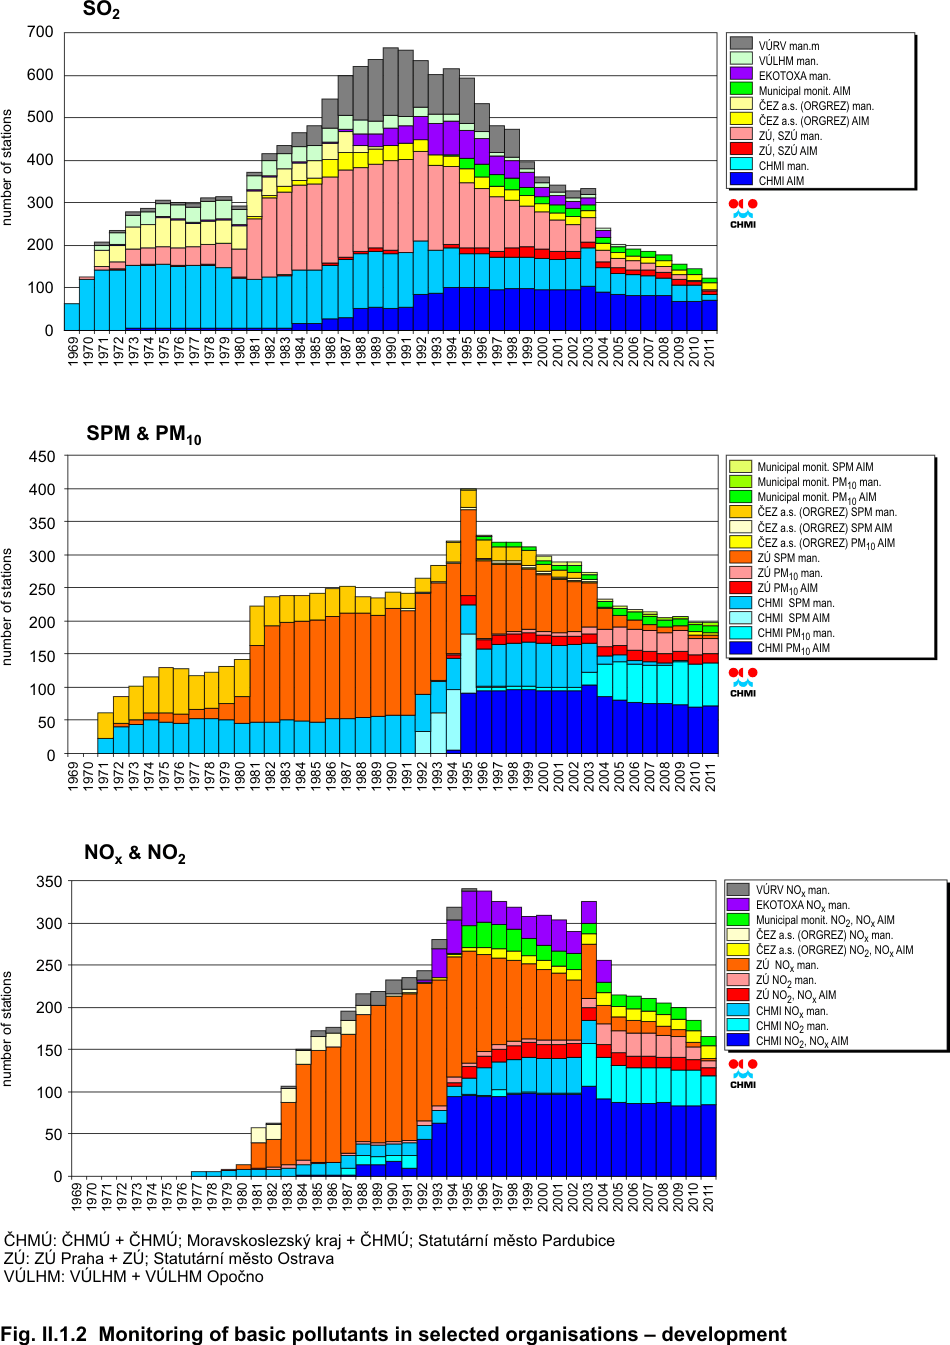
| Fig. II.1.2 |
Monitoring of basic pollutants in selected organisations –
development |
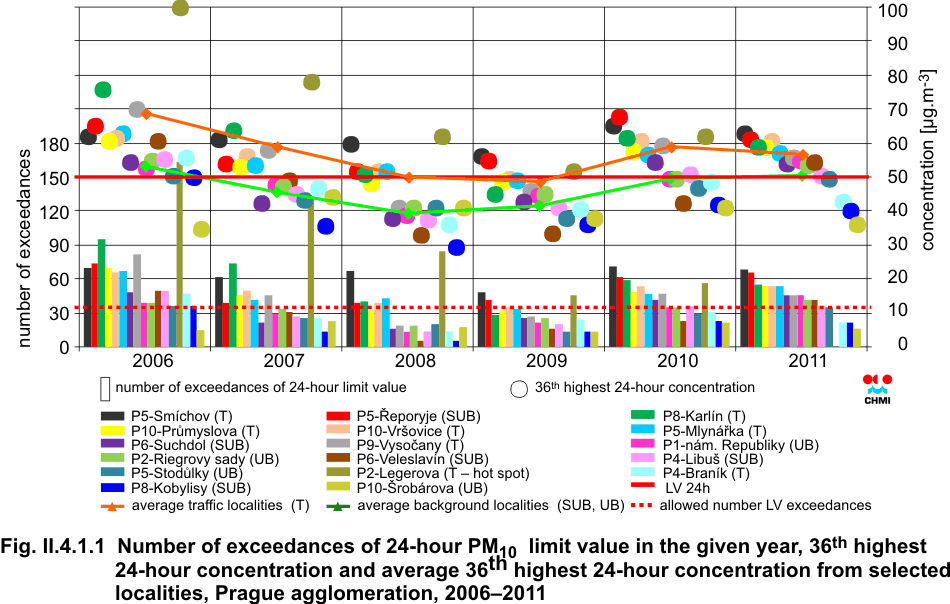
| Fig. II.4.1.1 |
Number of exceedances of 24-hour PM10 limit value in the given year,
36th highest 24-hour concentration and average 36th highest 24-hour
concentration from selected localities, Prague agglomeration, 2006–2011 |
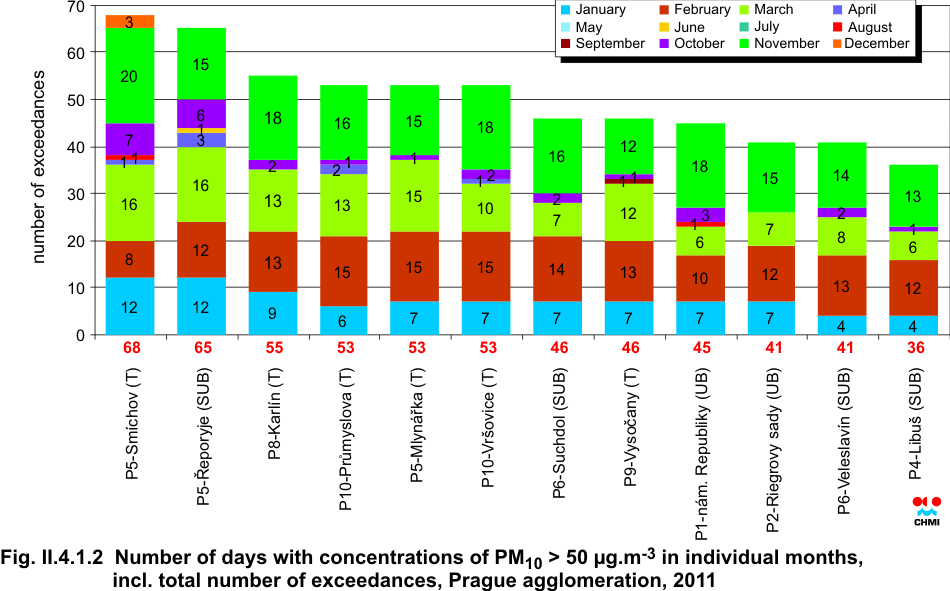
| Fig. II.4.1.2 |
Number of days with concentrations of PM10 > 50 ÎĽg.m-3 in individual
months, incl. total number of exceedances, Prague agglomeration, 2011 |
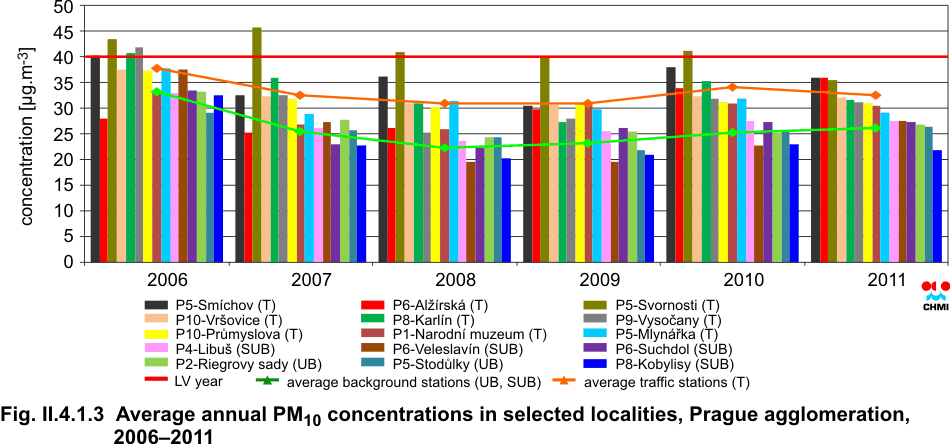
| Fig. II.4.1.3 |
Average annual PM10 concentrations in selected localities, Prague
agglomeration, 2006–2011 |
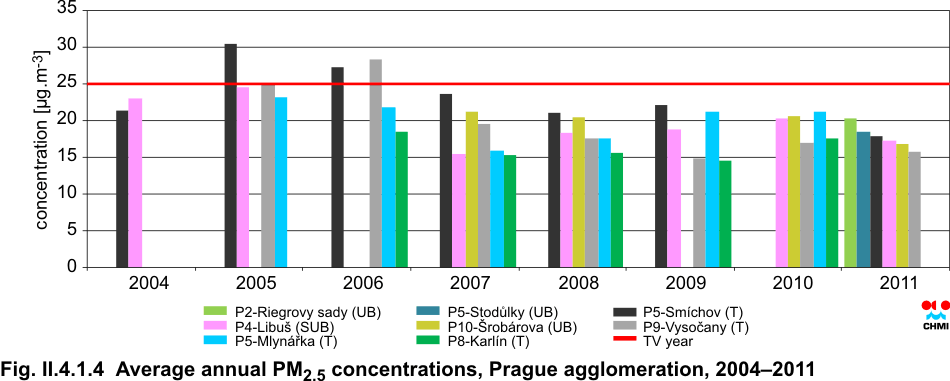
| Fig. II.4.1.4 |
Average annual PM2.5 concentrations, Prague agglomeration, 2004–2011 |
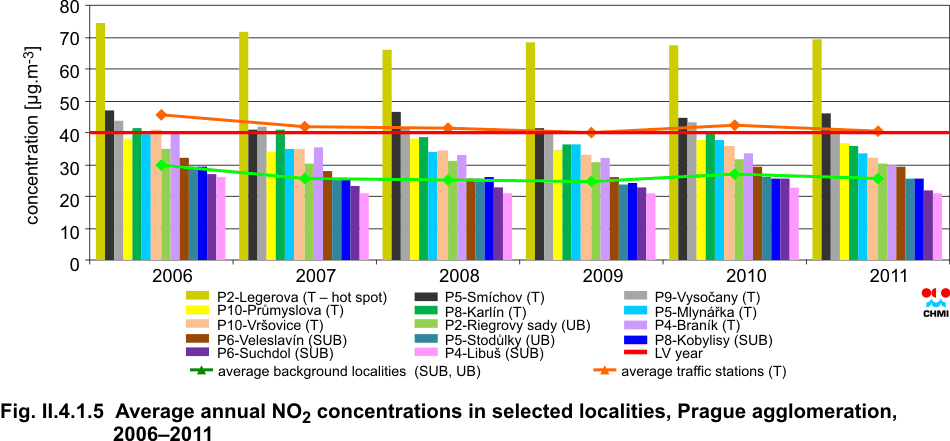
| Fig. II.4.1.5 |
Average annual NO2 concentrations in selected localities, Prague
agglomeration, 2006–2011 |
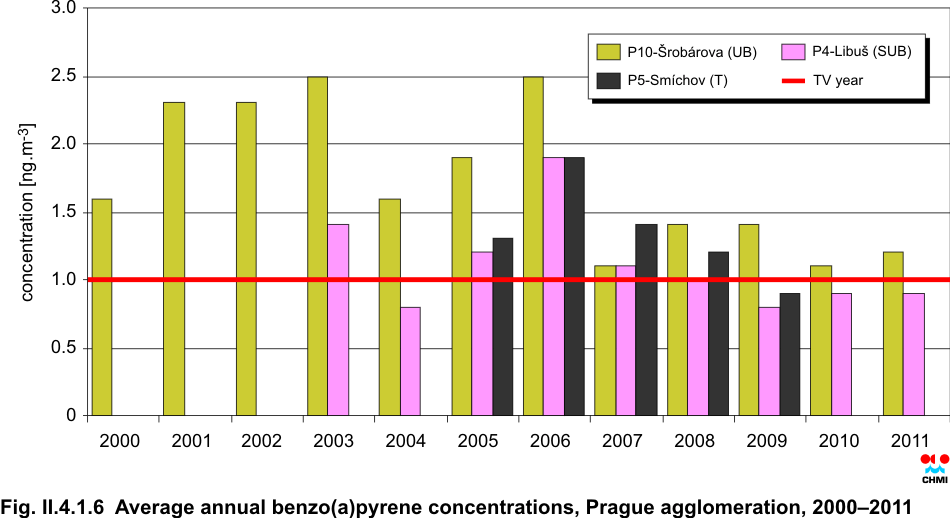
| Fig. II.4.1.6 |
Average annual benzo(a)pyrene concentrations, Prague agglomeration,
2000–2011 |
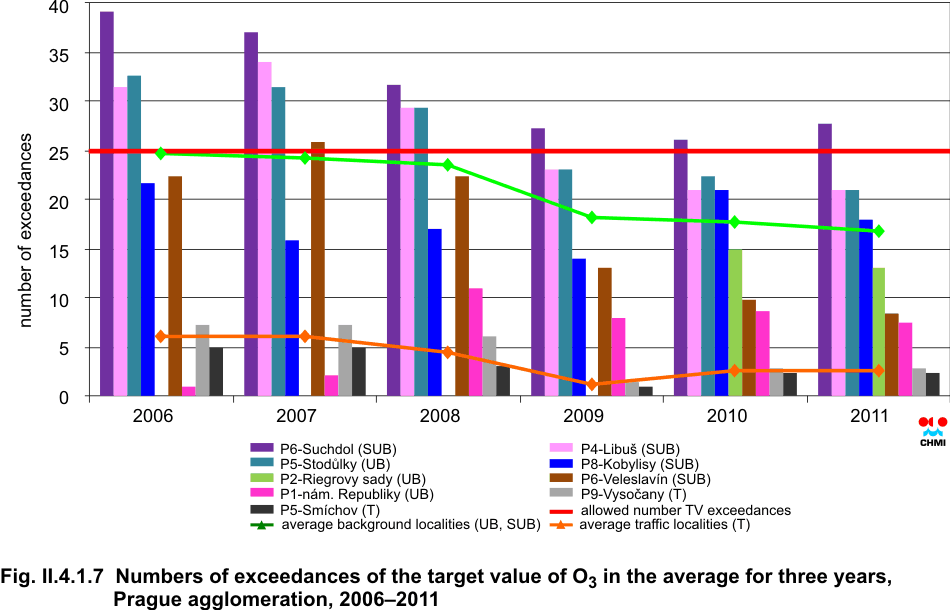
| Fig. II.4.1.7 |
Numbers of exceedances of the target value of O3 in the average for
three years, Prague agglomeration, 2006–2011 |
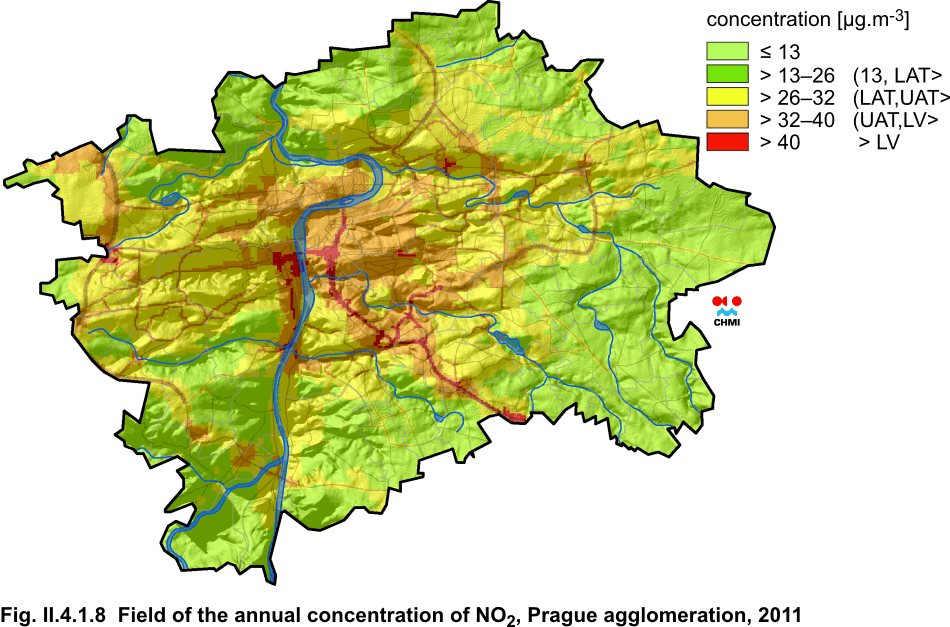
| Fig. II.4.1.8 |
Field of the annual concentration of NO2, Prague agglomeration, 2011 |
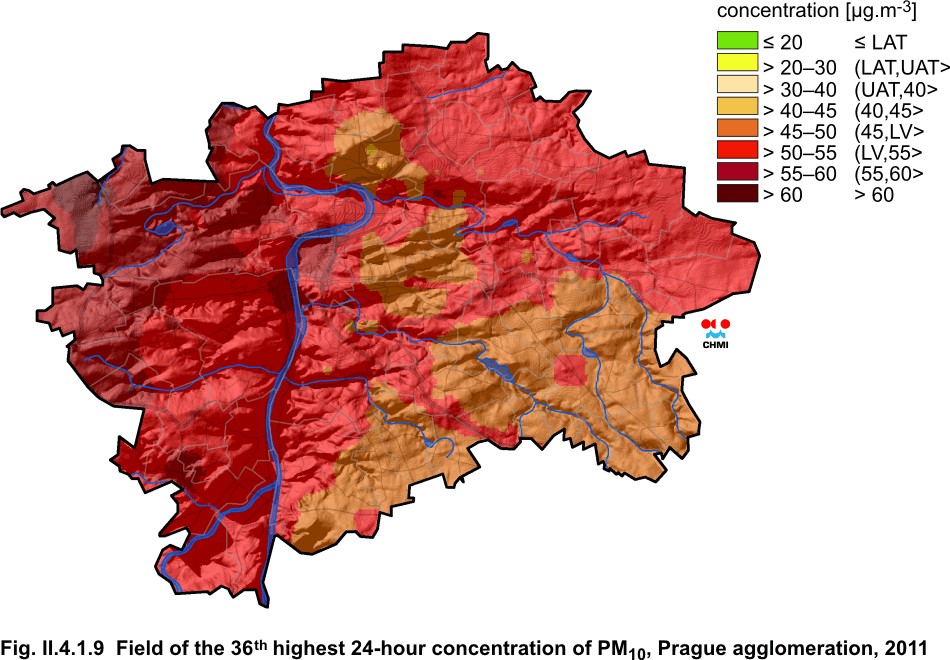
| Fig. II.4.1.9 |
Field of the 36th highest 24-hour concentration of PM10, Prague
agglomeration, 2011 |
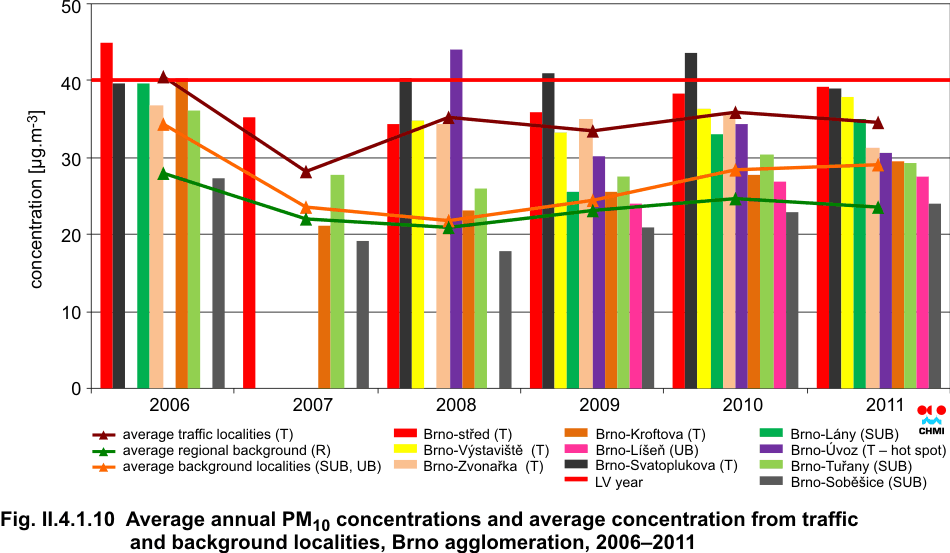
| Fig. II.4.1.10 |
Average annual PM10 concentrations and average concentration from
traffic and background localities, Brno agglomeration, 2006–2011 |
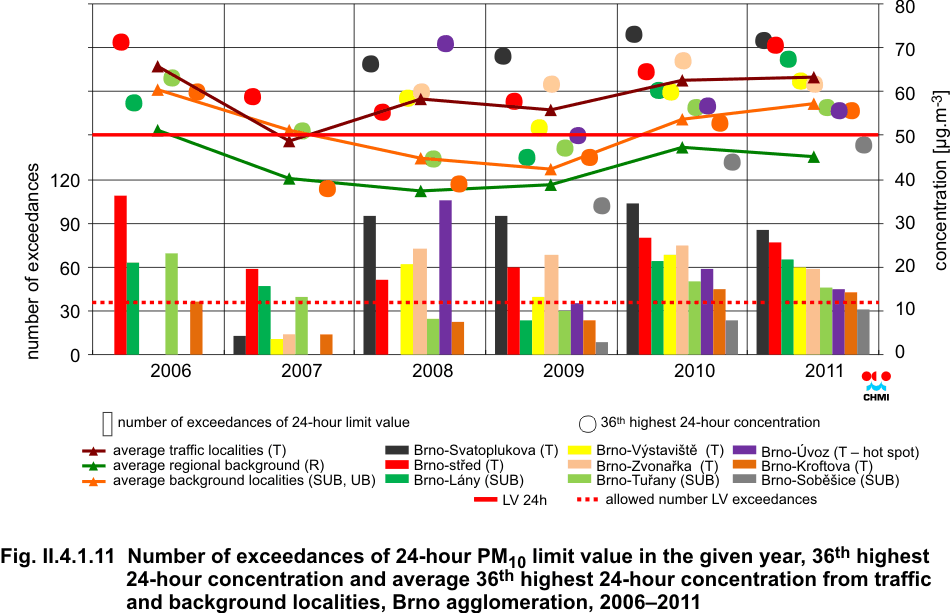
| Fig. II.4.1.11 |
Number of exceedances of 24-hour PM10 limit value in the given year,
36th highest 24-hour concentration and average 36th highest 24-hour
concentration from traffic and background localities, Brno agglomeration,
2006–2011 |
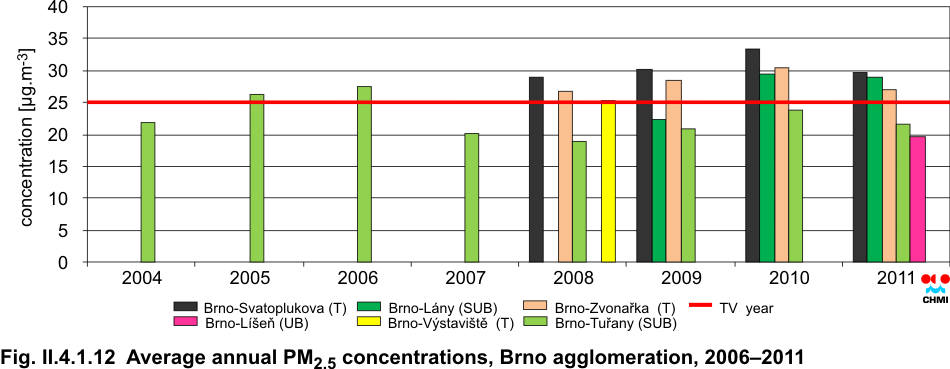
| Fig. II.4.1.12 |
Average annual PM2.5 concentrations, Brno agglomeration, 2006–2011 |
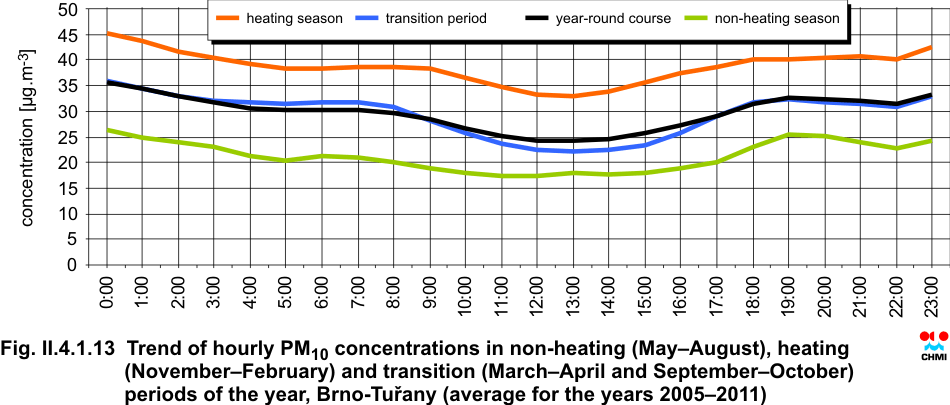
| Fig. II.4.1.13 |
Trend of hourly PM10 concentrations in non-heating (May–August),
heating (November–February) and transition (March–April and September–October)
periods of the year, Brno-Tuřany (average for the years 2005–2011) |
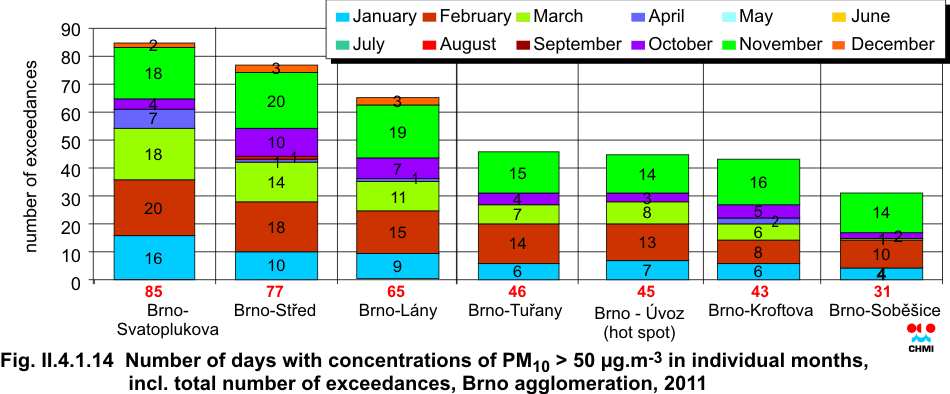
| Fig. II.4.1.14 |
Number of days with concentrations of PM10 > 50 ÎĽg.m-3 in individual
months, incl. total number of exceedances, Brno agglomeration, 2011 |
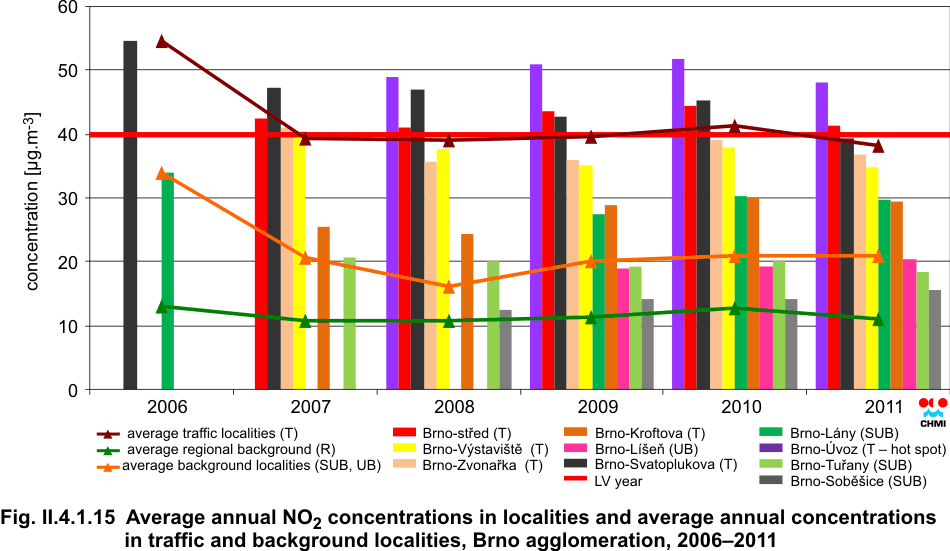
| Fig. II.4.1.15 |
Average annual NO2 concentrations in localities and average annual
concentrations in traffic and background localities, Brno agglomeration,
2006–2011 |
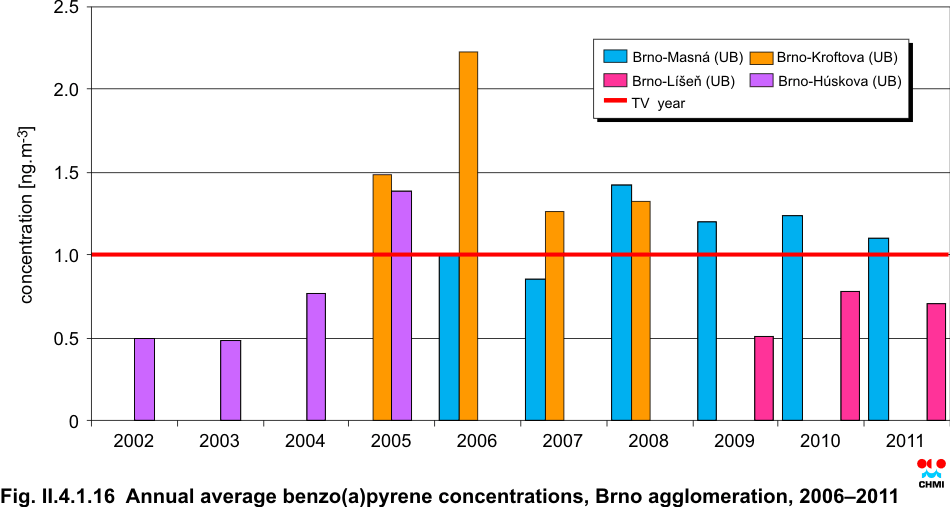
| Fig. II.4.1.16 |
Average annual benzo(a)pyrene concentrations, Brno agglomeration,
2002–2011 |
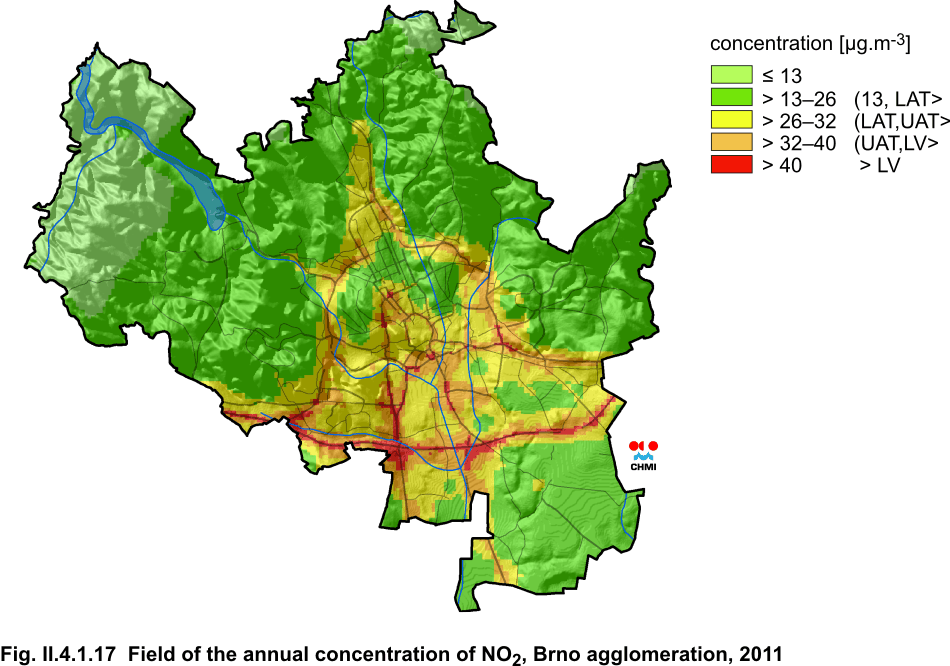
| Fig. II.4.1.17 |
Field of the annual concentration of NO2, Brno agglomeration, 2011 |
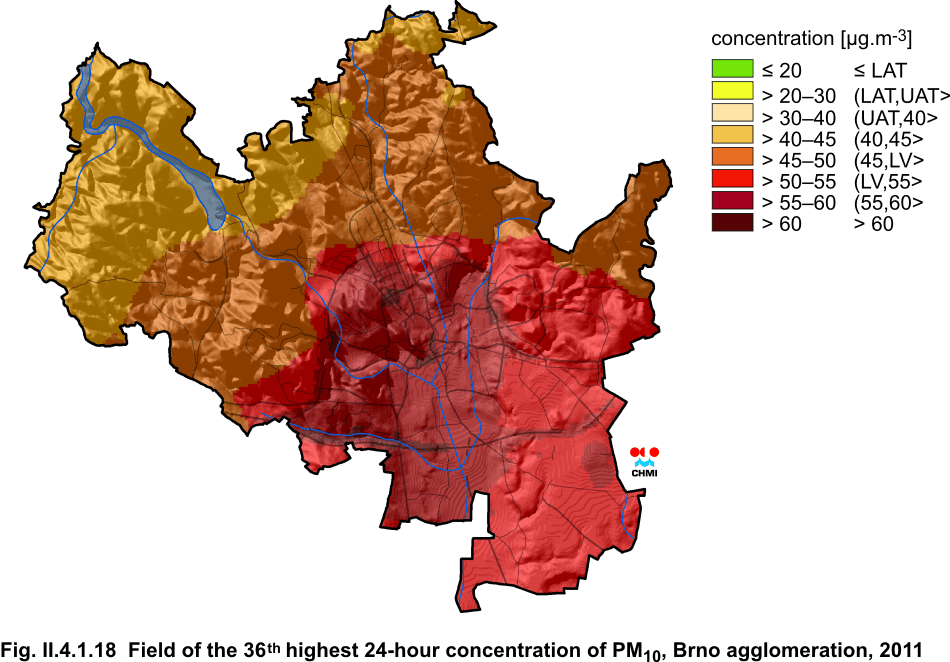
| Fig. II.4.1.18 |
Field of the 36th highest 24-hour concentration of PM10, Brno
agglomeration, 2011 |
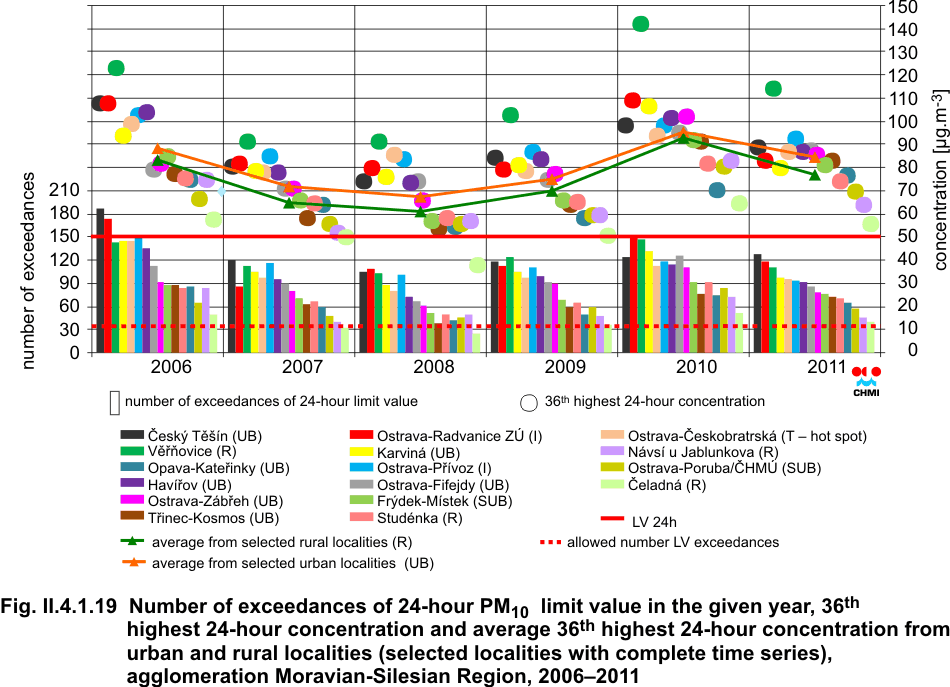
| Fig. II.4.1.19 |
Number of exceedances of 24-hour PM10 limit value in the given year,
36th highest 24-hour concentration and average 36th highest 24-hour
concentration from urban and rural localities (selected localities with
complete time series), agglomeration Moravian-Silesian Region, 2006–2011 |
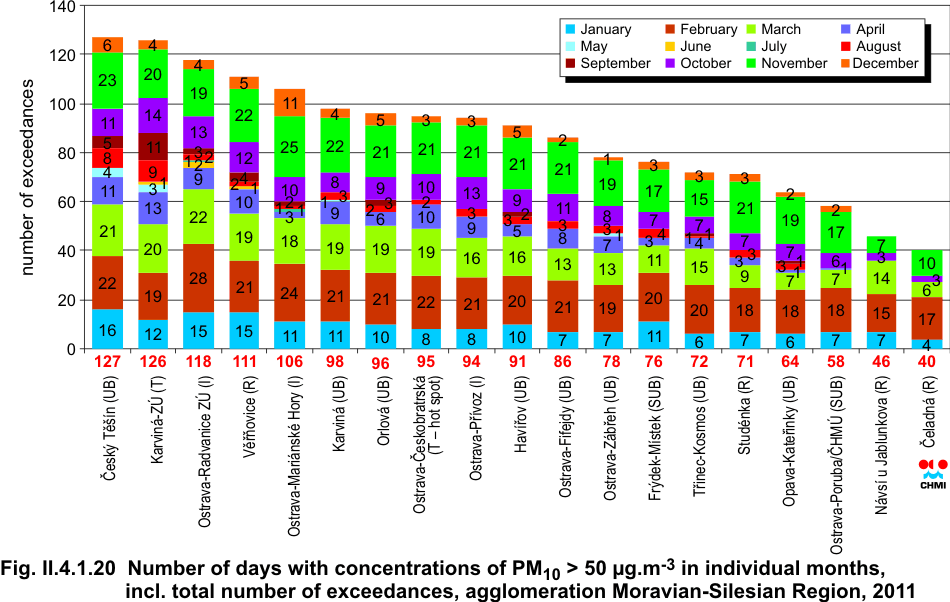
| Fig. II.4.1.20 |
Number of days with concentrations of PM10 > 50 ÎĽg.m-3 in individual
months, incl. total number of exceedances, agglomeration Moravian-Silesian
Region, 2011 |
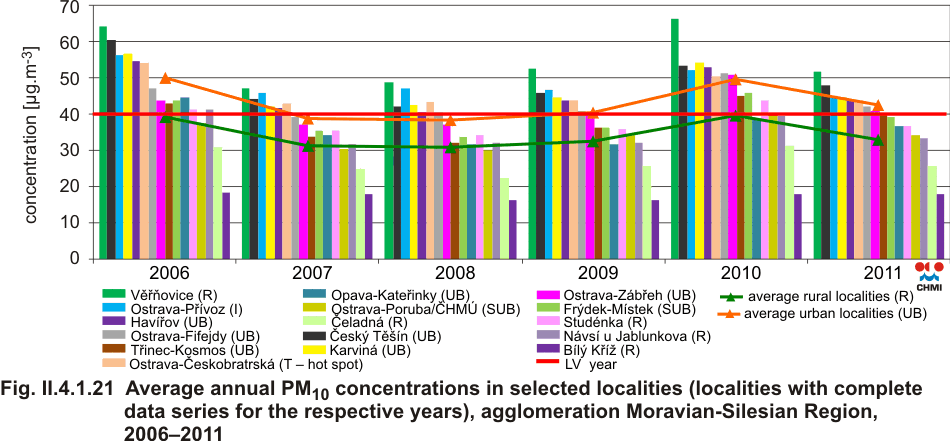
| Fig. II.4.1.21 |
Average annual PM10 concentrations in selected localities (localities
with complete data series for the respective years), agglomeration
Moravian-Silesian Region, 2006–2011 |
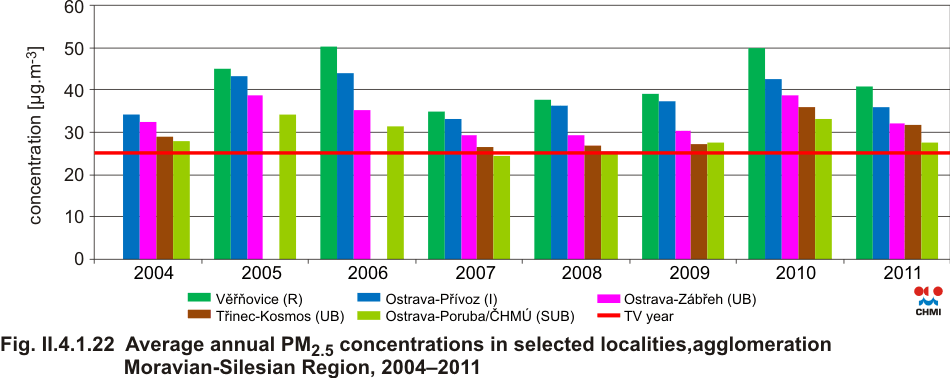
| Fig. II.4.1.22 |
Average annual PM2.5 concentrations in selected localities,
agglomeration Moravian-Silesian Region, 2004–2011 |
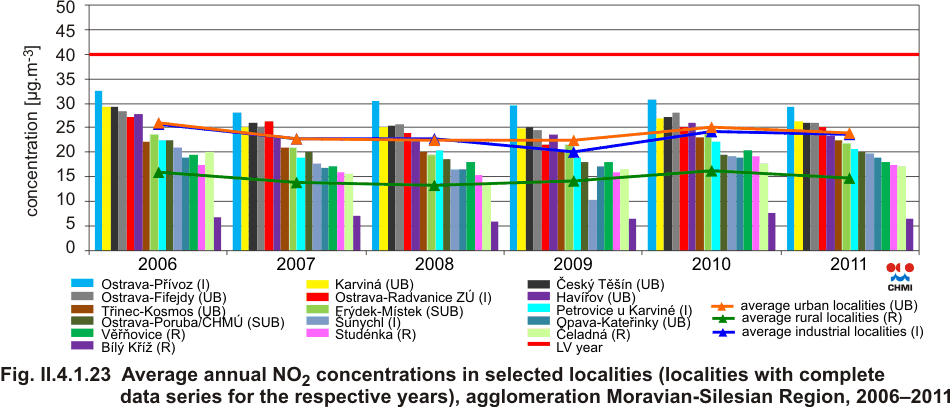
| Fig. II.4.1.23 |
Average annual NO2 concentrations in selected localities (localities
with complete data series for the respective years), agglomeration
Moravian-Silesian Region, 2006–2011 |
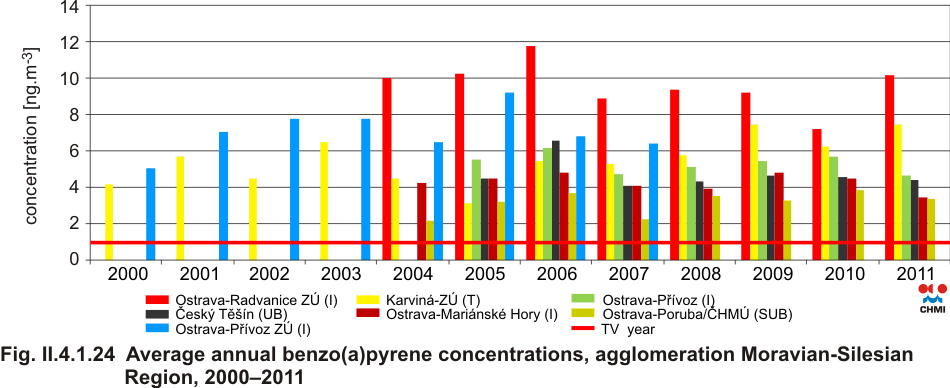
| Fig. II.4.1.24 |
Average annual benzo(a)pyrene concentrations, agglomeration Moravian-Silesian
Region, 2000–2011 |
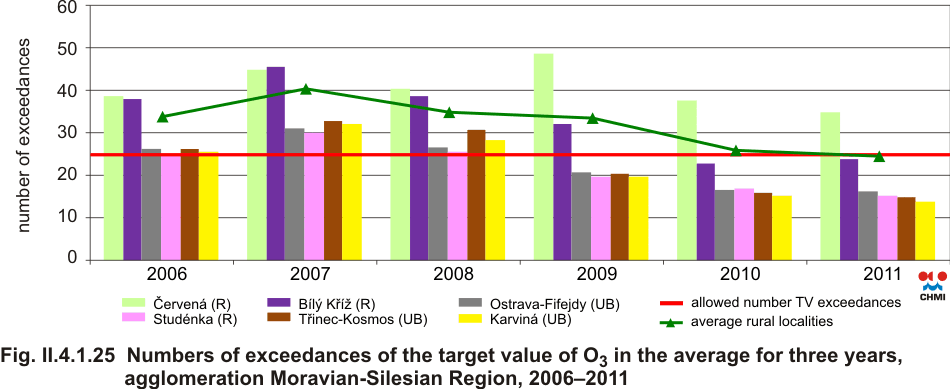
| Fig. II.4.1.25 |
Numbers of exceedances of the target value of O3 in the average for
three years, agglomeration Moravian-Silesian Region, 2006–2011 |
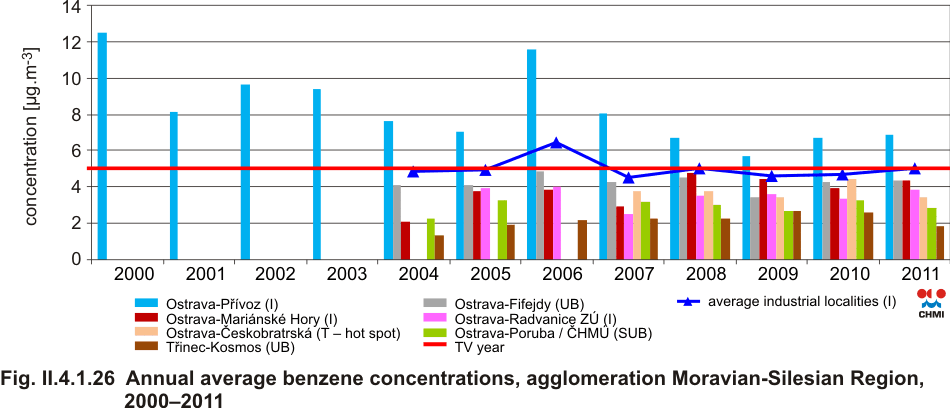
| Fig. II.4.1.26 |
Annual average benzene concentrations, agglomeration Moravian-Silesian
Region, 2000–2011 |
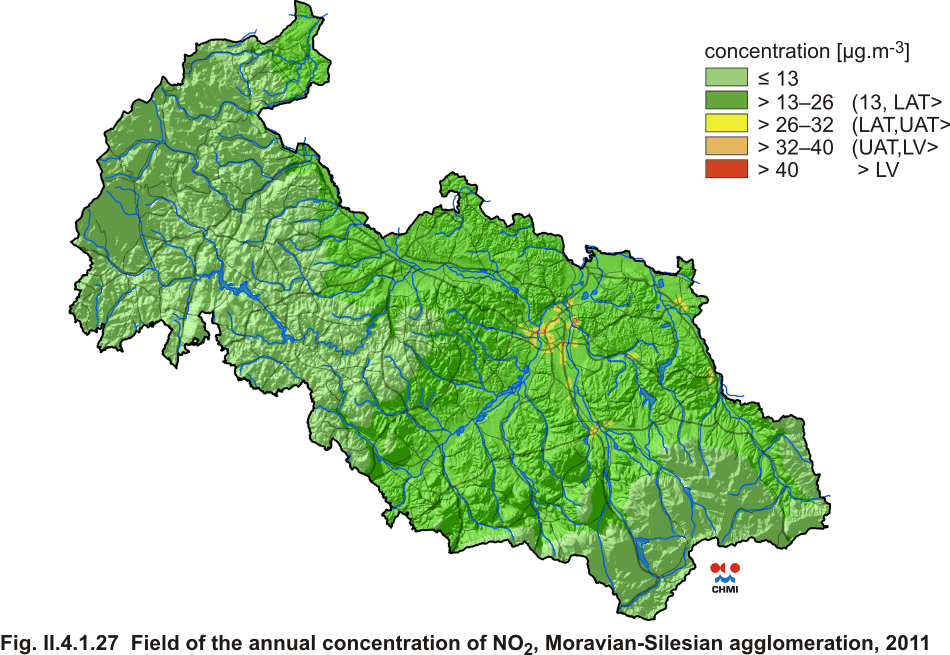
| Fig. II.4.1.27 |
Field of the annual concentration of NO2, Moravian-Silesian
agglomeration, 2011 |
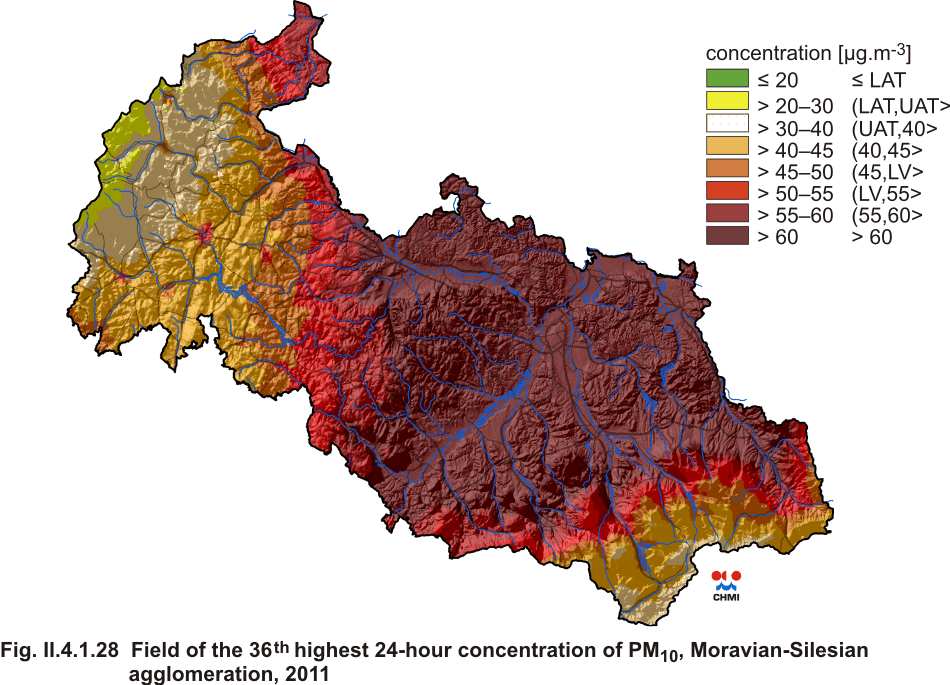
| Fig. II.4.1.28 |
Field of the 36th highest 24-hour concentration of PM10, Moravian-Silesian
agglomeration, 2011 |
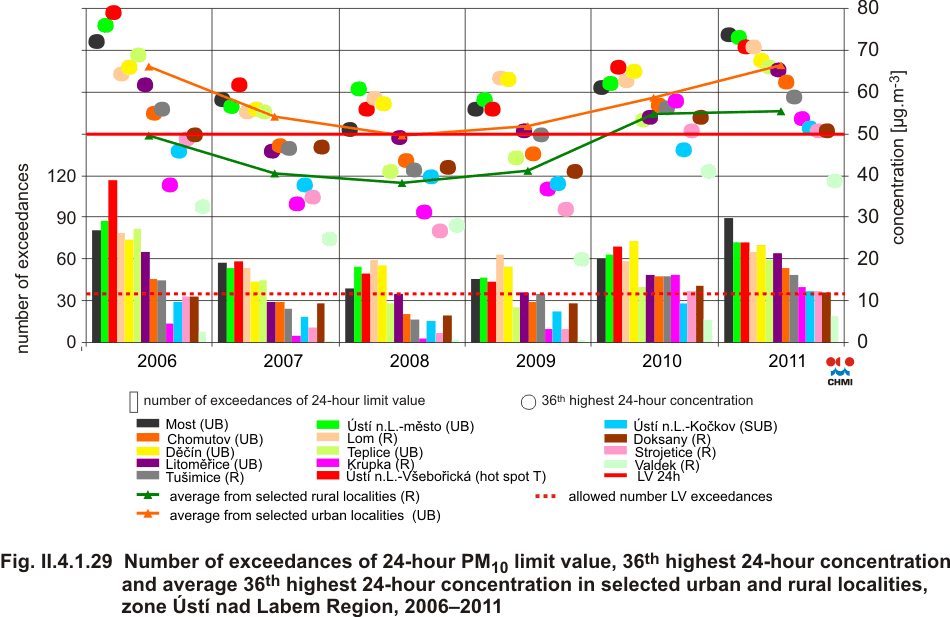
| Fig. II.4.1.29 |
Number of exceedances of 24-hour PM10 limit value, 36th highest 24-hour
concentration and average 36th highest 24-hour concentration in selected
urban and rural localities, zone Ústà nad Labem Region, 2006–2011 |
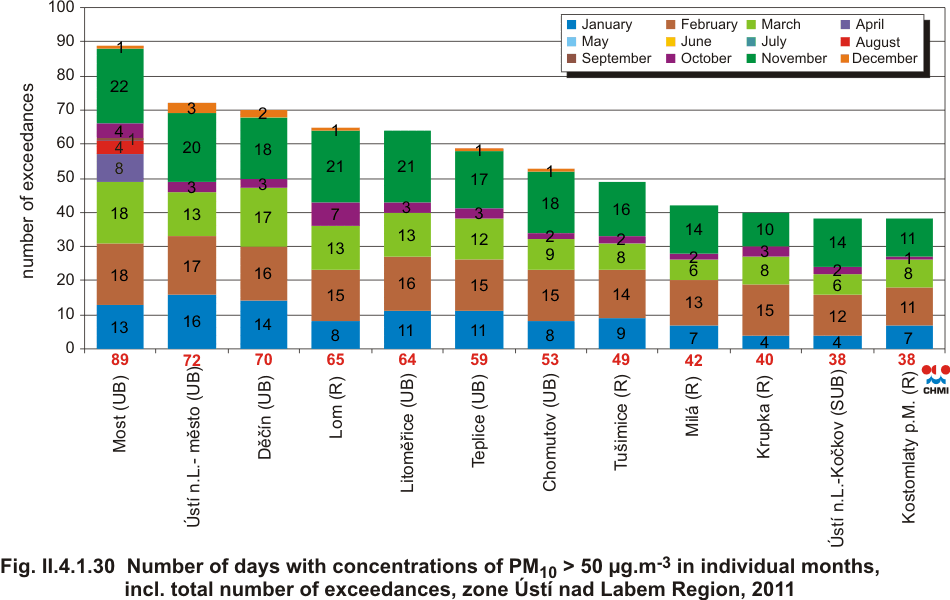
| Fig. II.4.1.30 |
Number of days with concentrations of PM10 > 50 ÎĽg.m-3 in individual
months, incl. total number of exceedances, zone ĂšstĂ nad Labem Region,
2011 |
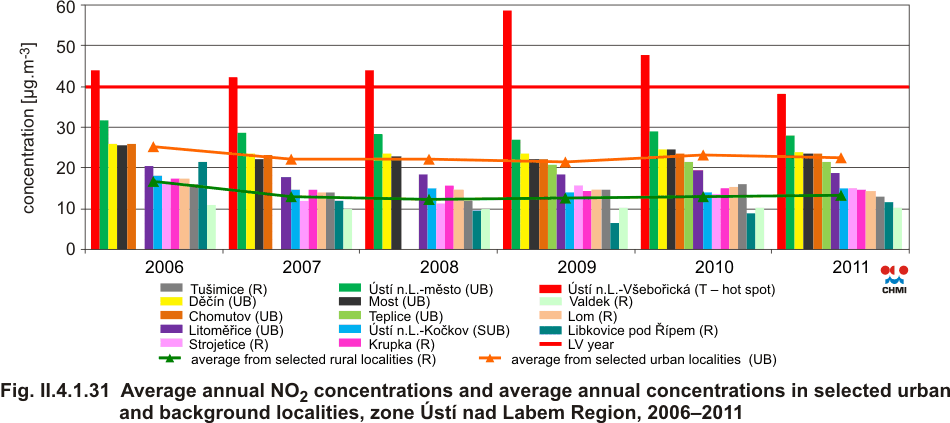
| Fig. II.4.1.31 |
Average annual NO2 concentrations and average annual concentrations
in selected urban and background localities, zone ĂšstĂ nad Labem Region,
2006–2011 |
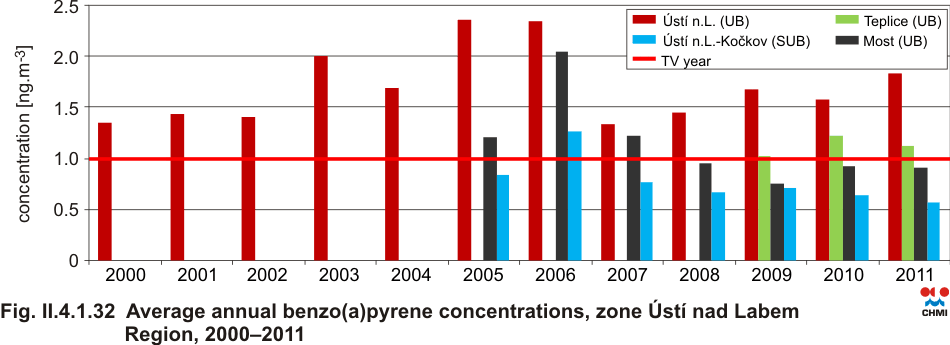
| Fig. II.4.1.32 |
Average annual benzo(a)pyrene concentrations, zone ĂšstĂ nad Labem
Region, 2000–2011 |
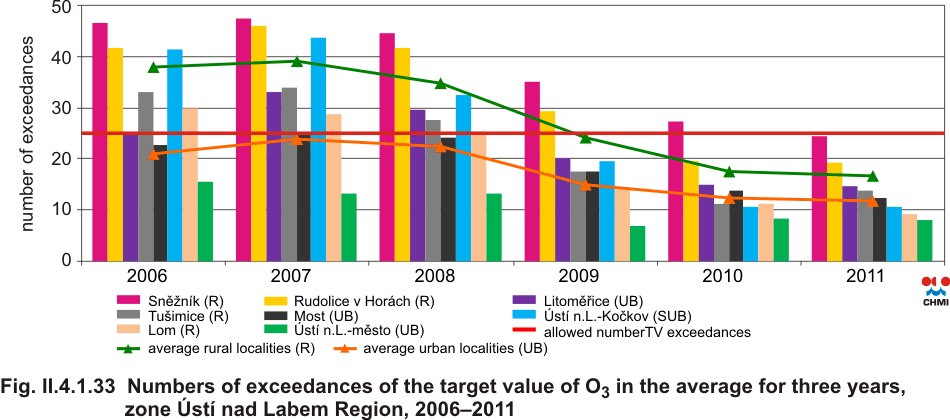
| Fig. II.4.1.33 |
Numbers of exceedances of the target value of O3 in the average for
three years, zone Ústà nad Labem Region, 2006–2011 |
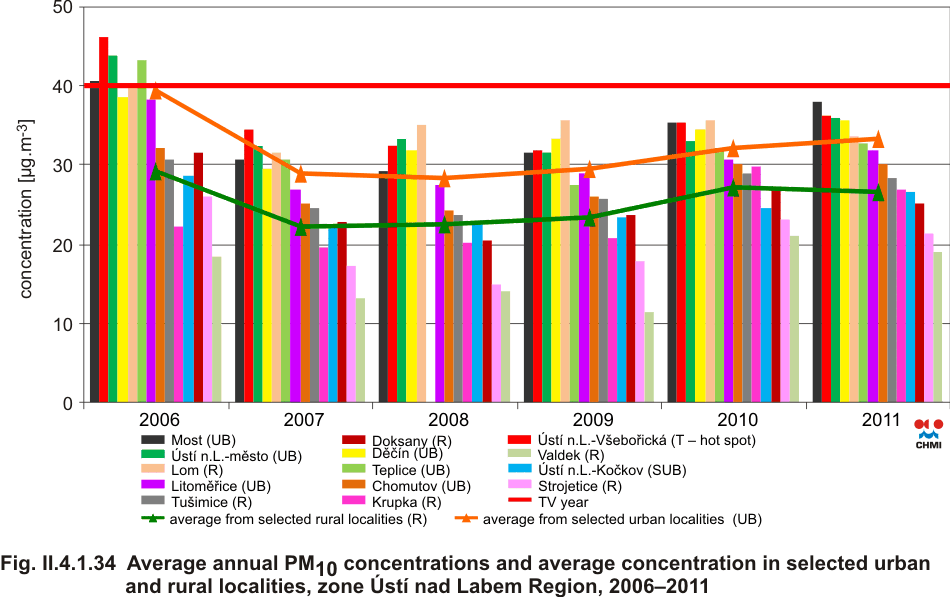
| Fig. II.4.1.34 |
Average annual PM10 concentrations and average concentration in
selected urban and rural localities, zone ĂšstĂ nad Labem Region,
2006–2011 |
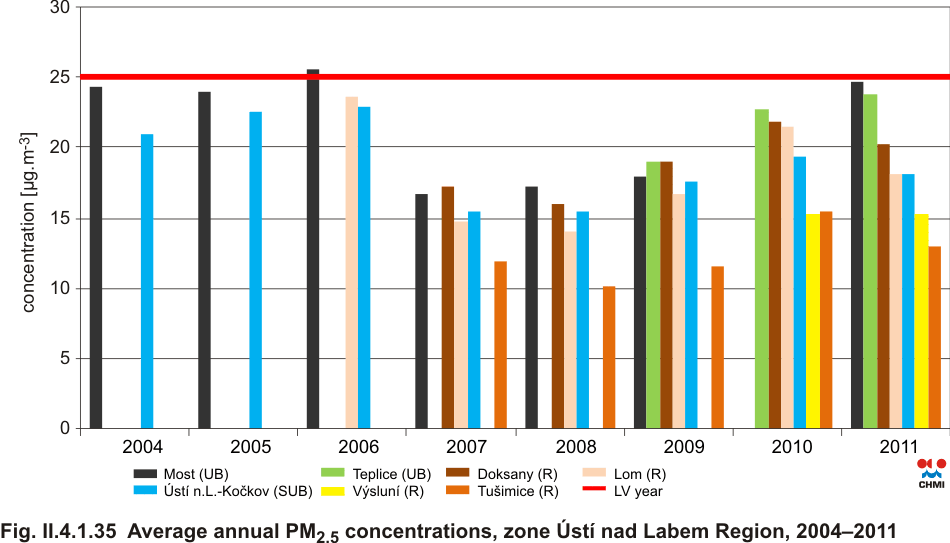
| Fig. II.4.1.35 |
Average annual PM2.5 concentrations, zone ĂšstĂ nad Labem Region,
2004–2011 |
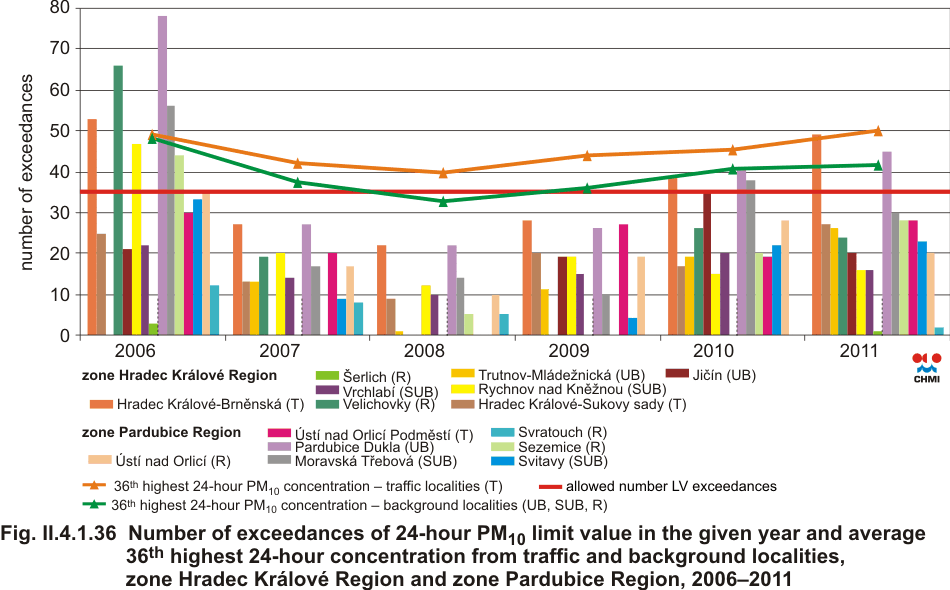
| Fig. II.4.1.36 |
Number of exceedances of 24-hour PM10 limit value in the given year
and average 36th highest 24-hour concentration from traffic and
background localities, zone Hradec Králové Region and zone Pardubice
Region, 2006–2011 |
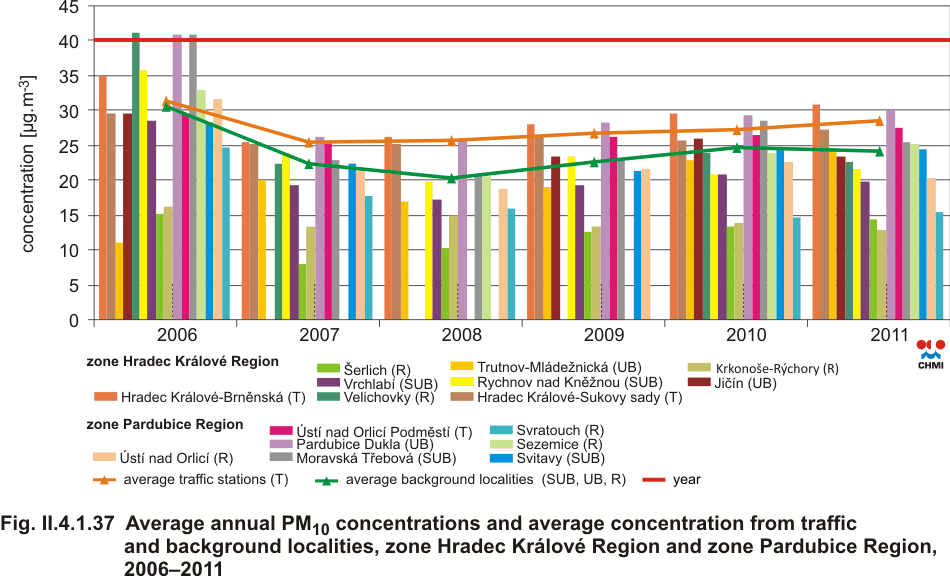
| Fig. II.4.1.37 |
Average annual PM10 concentrations and average concentration from
traffic and background localities, zone Hradec Králové Region and zone
Pardubice Region, 2006–2011 |
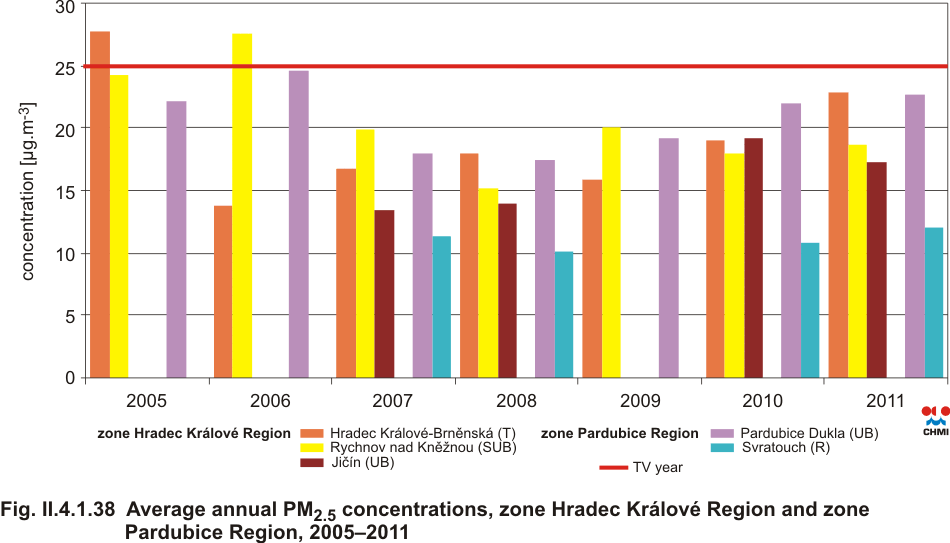
| Fig. II.4.1.38 |
Average annual PM2.5 concentrations, zone Hradec Králové Region and
zone Pardubice Region, 2005–2011 |
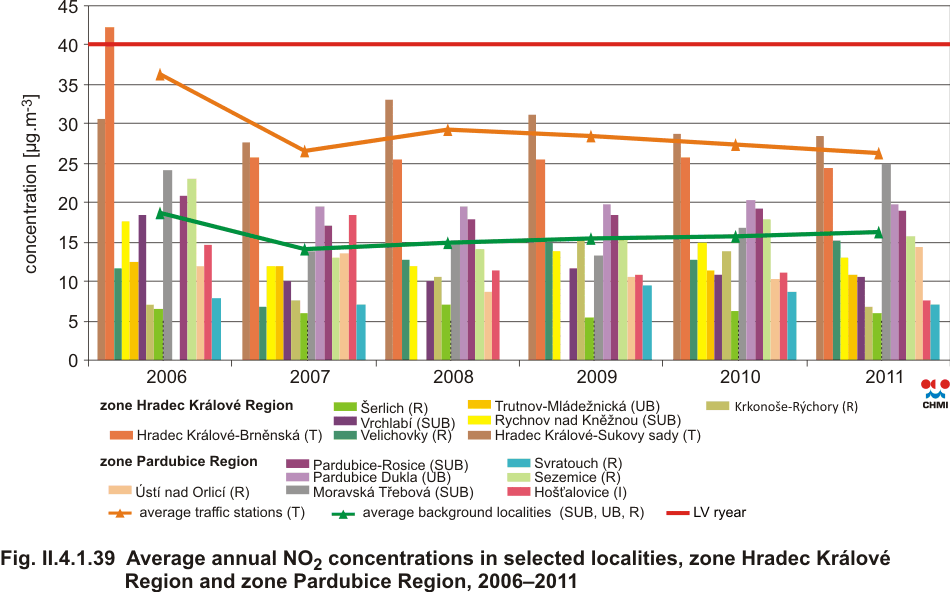
| Fig. II.4.1.39 |
Average annual NO2 concentrations in selected localities, zone
Hradec Králové Region and zone Pardubice Region, 2006–2011 |
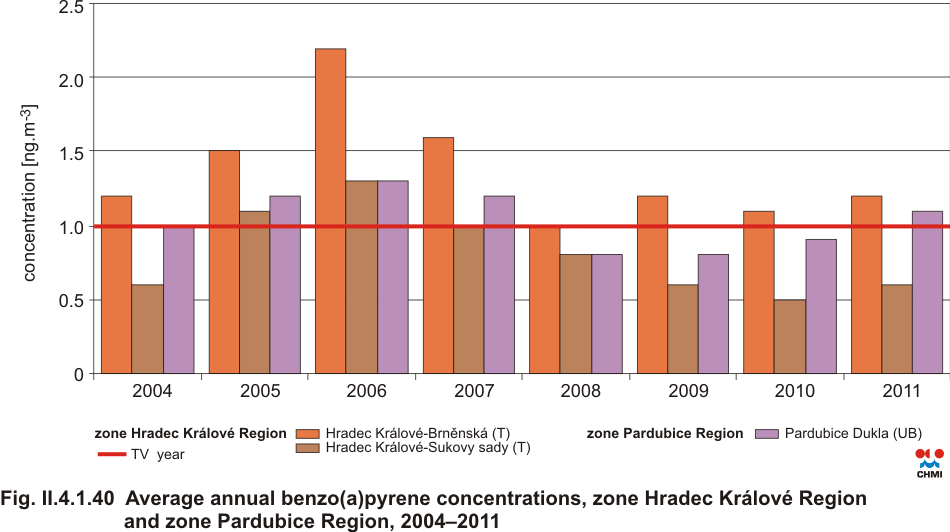
| Fig. II.4.1.40 |
Average annual benzo(a)pyrene concentrations, zone Hradec Králové
Region and zone Pardubice Region, 2004–2011 |
| Fig. II.4.1.41 |
Numbers of exceedances of the target value of O3 in the average for
three years, zone Hradec Králové Region and zone Pardubice Region,
2006–2011 |
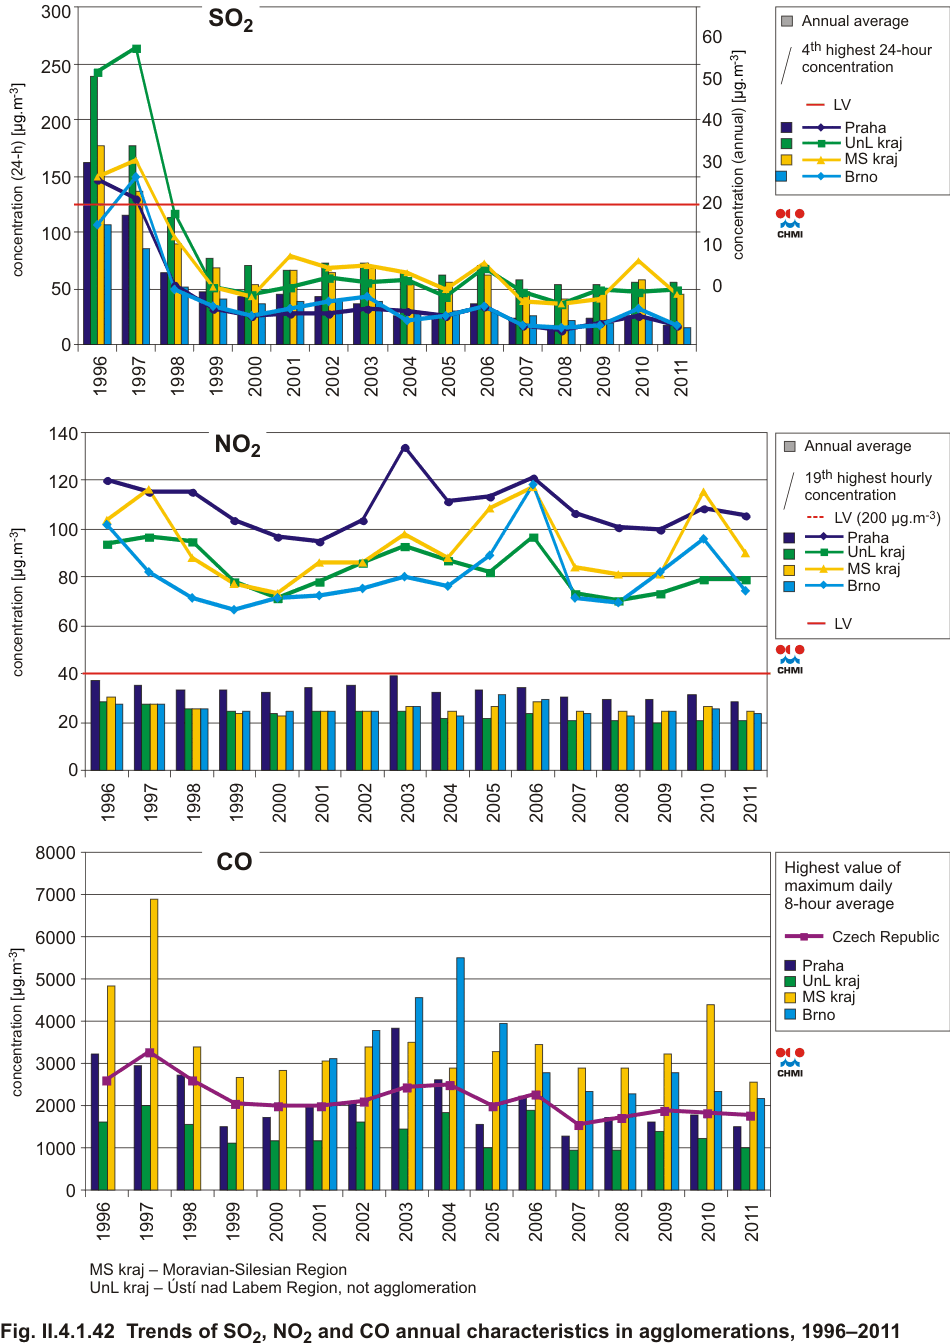
| Fig. II.4.1.42 |
Trends of SO2, NO2 and CO annual characteristics in agglomerations,
1996–2011 |
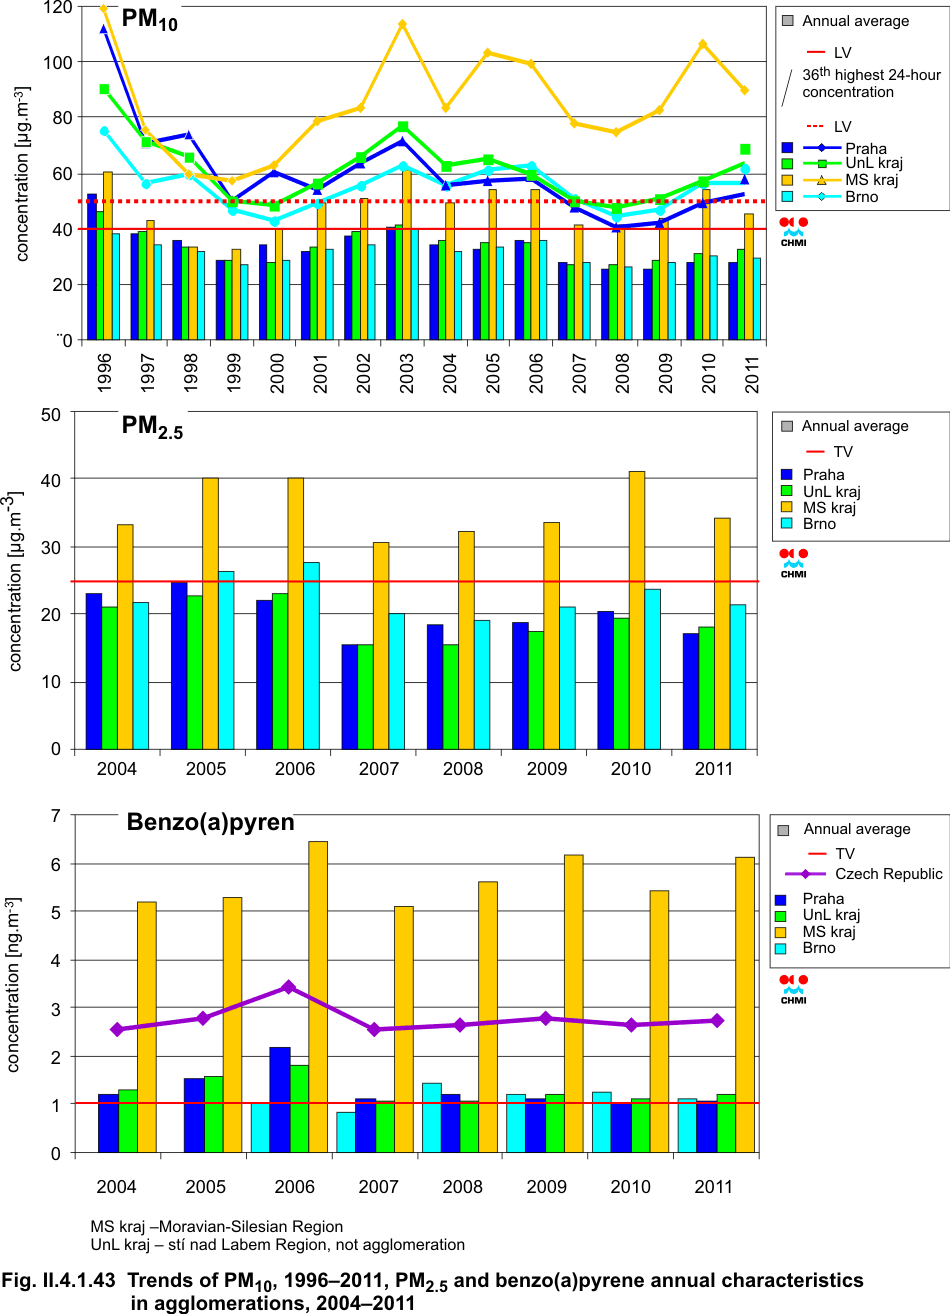
| Fig. II.4.1.43 |
Trends of PM10, PM2.5 and benzo(a)pyrene annual characteristics in
agglomerations, 1996–2011 |
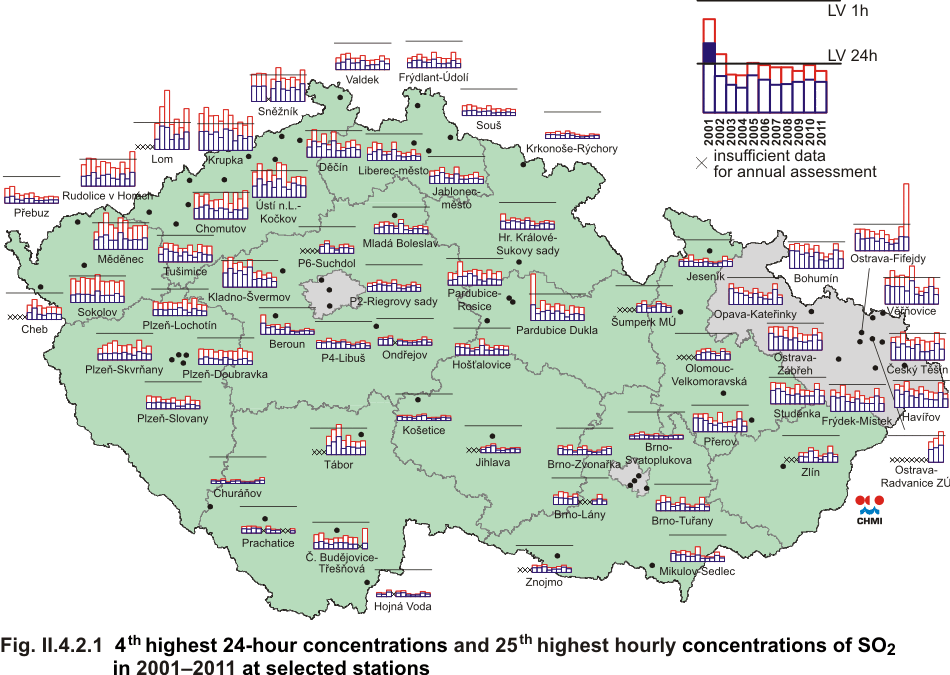
| Fig. II.4.2.1 |
4th highest 24-hour concentrations and 25th highest hourly
concentrations of SO2 in 2001–2011 at selected stations |
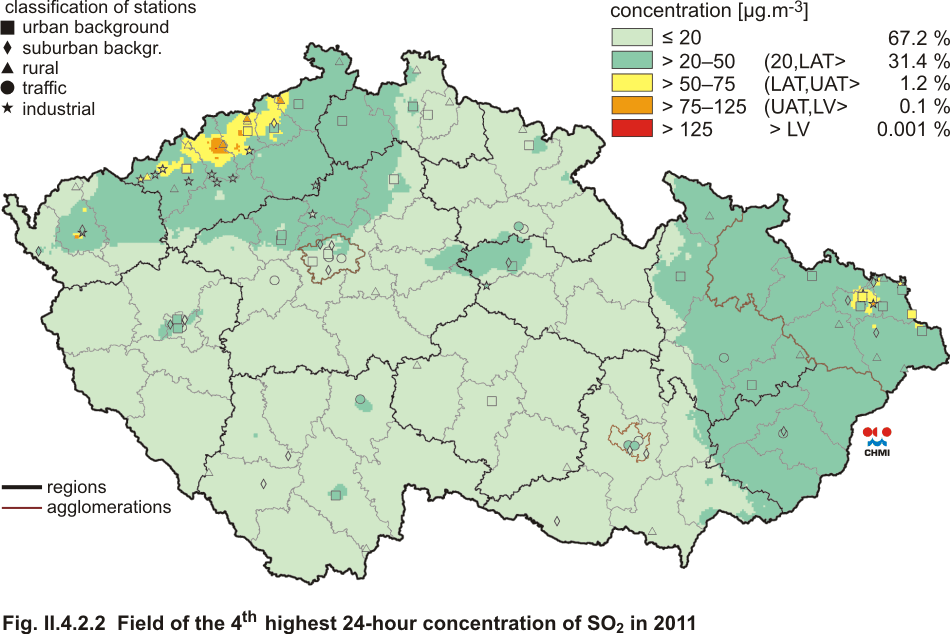
| Fig. II.4.2.2 |
Field of the 4th highest 24-hour concentration of SO2 in 2011 |
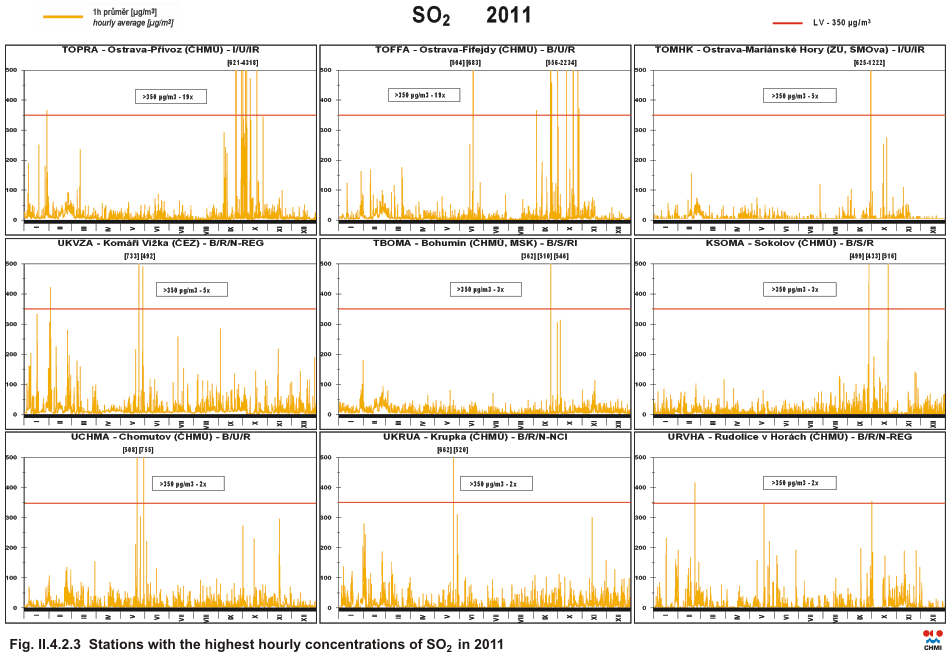
| Fig. II.4.2.3 |
Stations with the highest hourly concentrations of SO2 in 2011 |
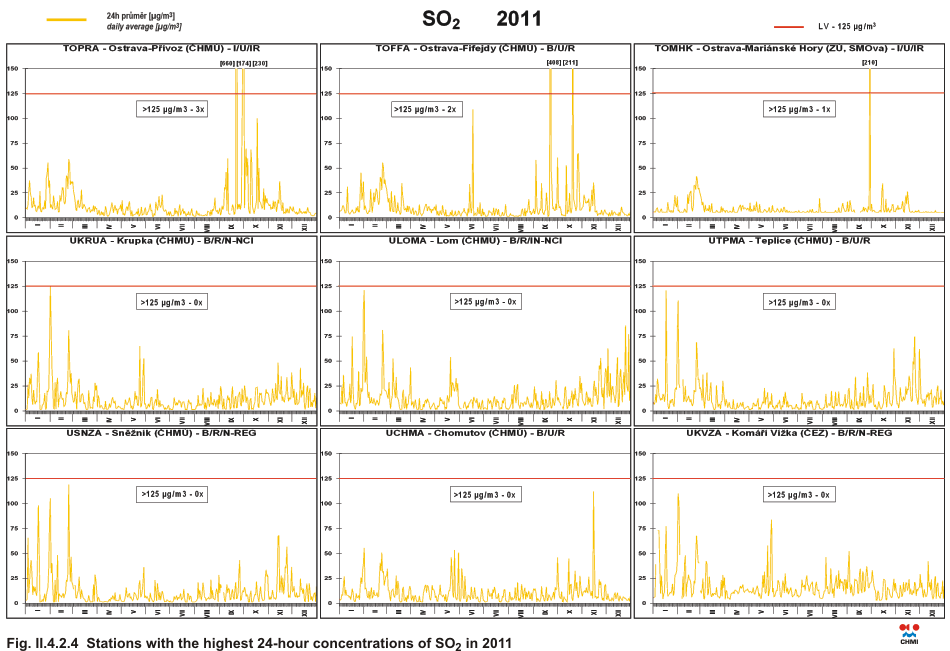
| Fig. II.4.2.4 |
Stations with the highest 24-hour concentrations of SO2 in 2011 |
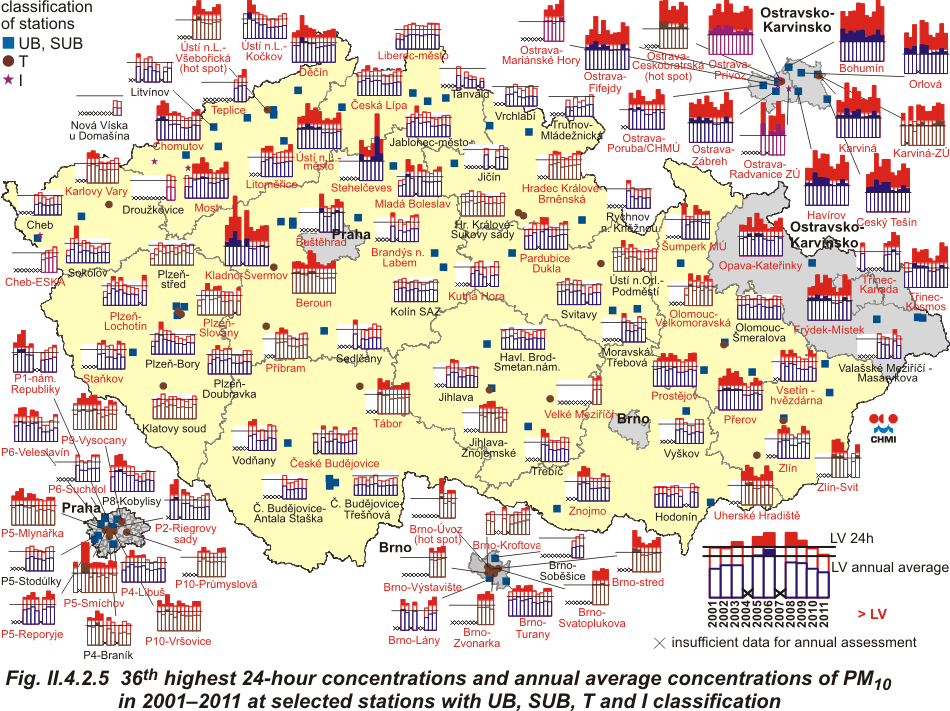
| Fig. II.4.2.5 |
36th highest 24-hour concentrations and annual average
concentrations of PM10 in 2001–2011 at selected stations with UB, SUB, I
and T classification |
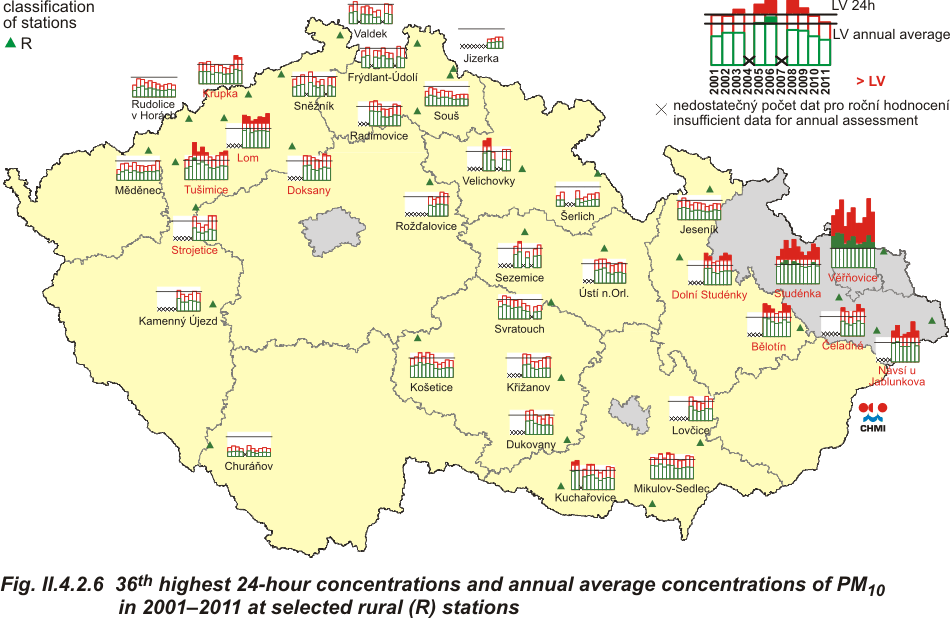
| Fig. II.4.2.6 |
36th highest 24-hour concentrations and annual average
concentrations of PM10 in 2001–2011 at selected rural (R) stations |
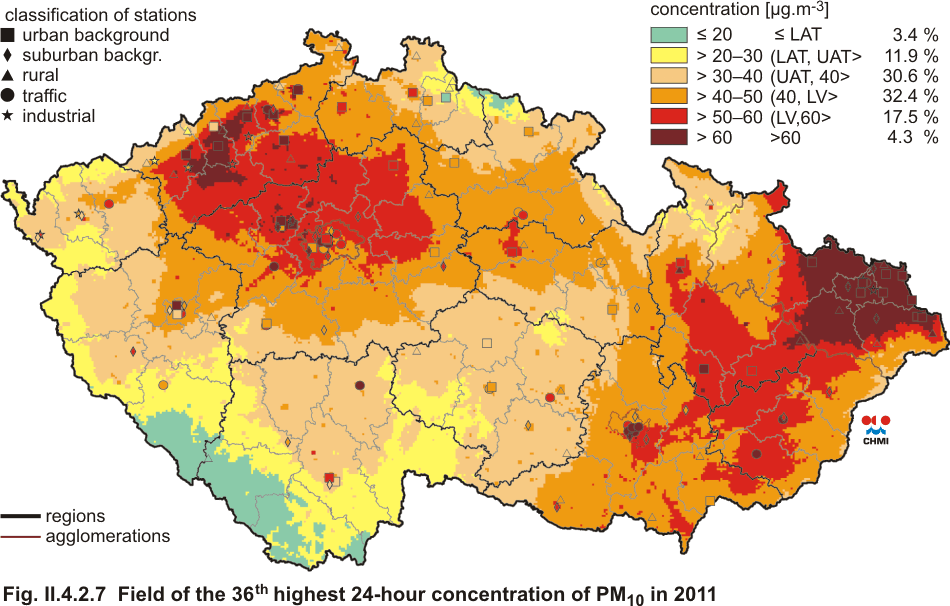
| Fig. II.4.2.7 |
Field of the 36th highest 24-hour concentration of PM10 in 2011 |
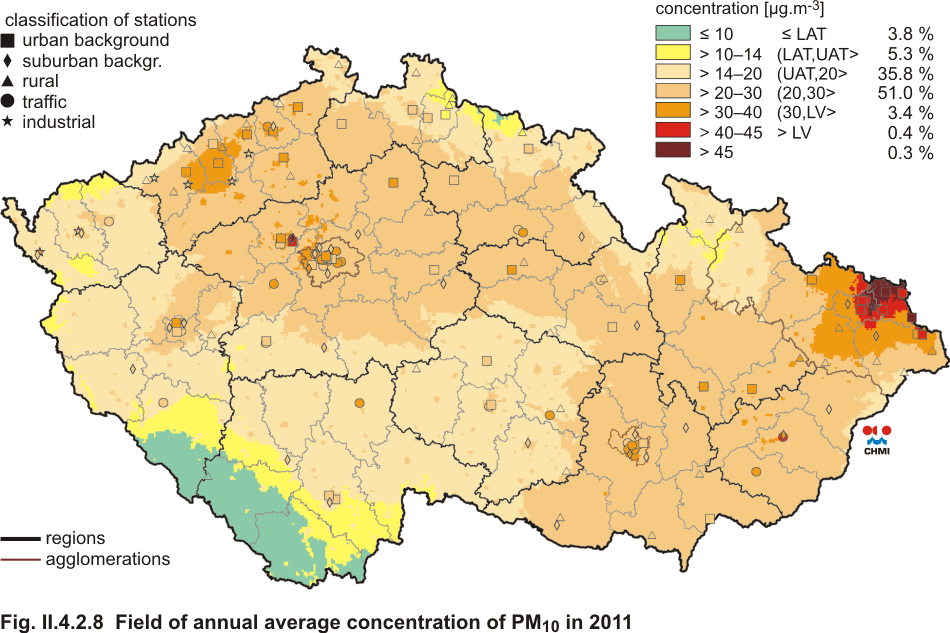
| Fig. II.4.2.8 |
Field of annual average concentration of PM10 in 2011 |
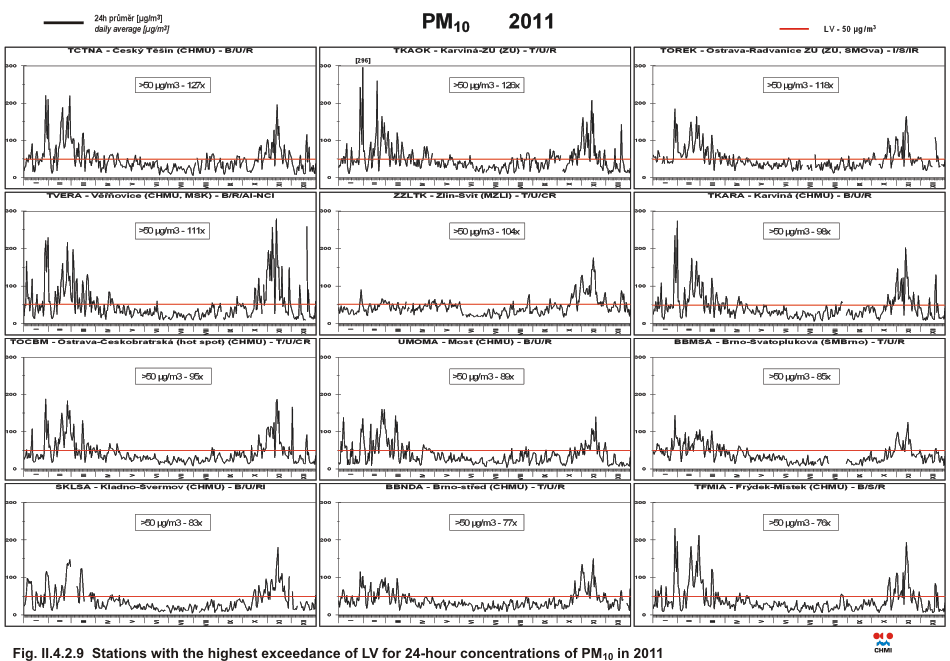
| Fig. II.4.2.9 |
Stations with the highest exceedance of LV for 24-hour
concentrations of PM10 in 2011 |
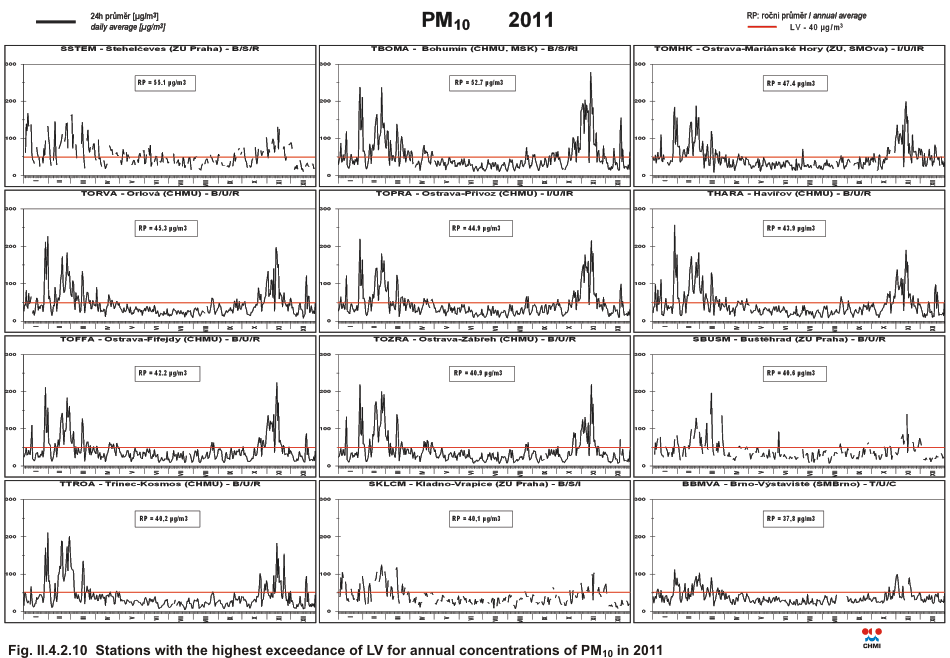
| Fig. II.4.2.10 |
Stations with the highest exceedance of LV for annual concentrations
of PM10 in 2011 |
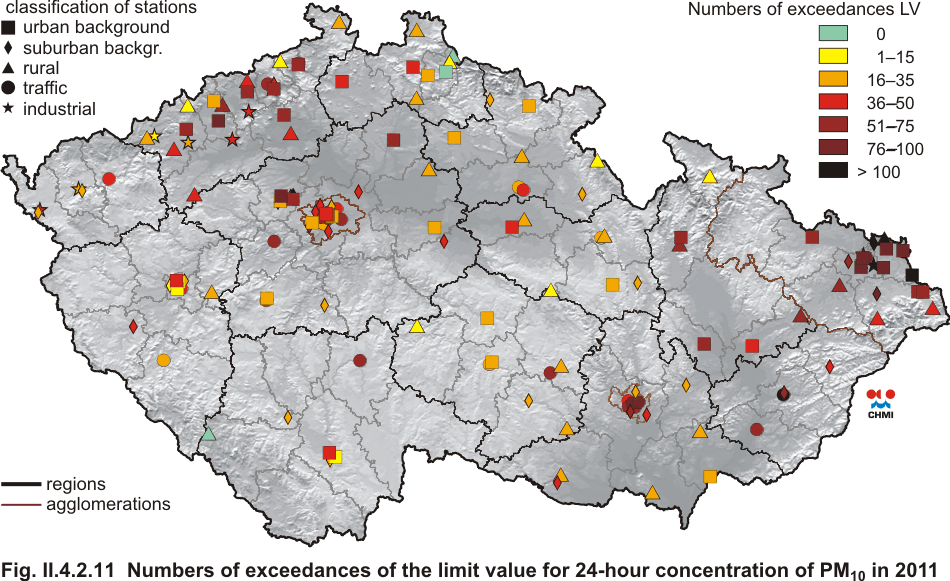
| Fig. II.4.2.11 |
Numbers of exceedances of the limit value for 24-hour concentration
of PM10 in 2011 |
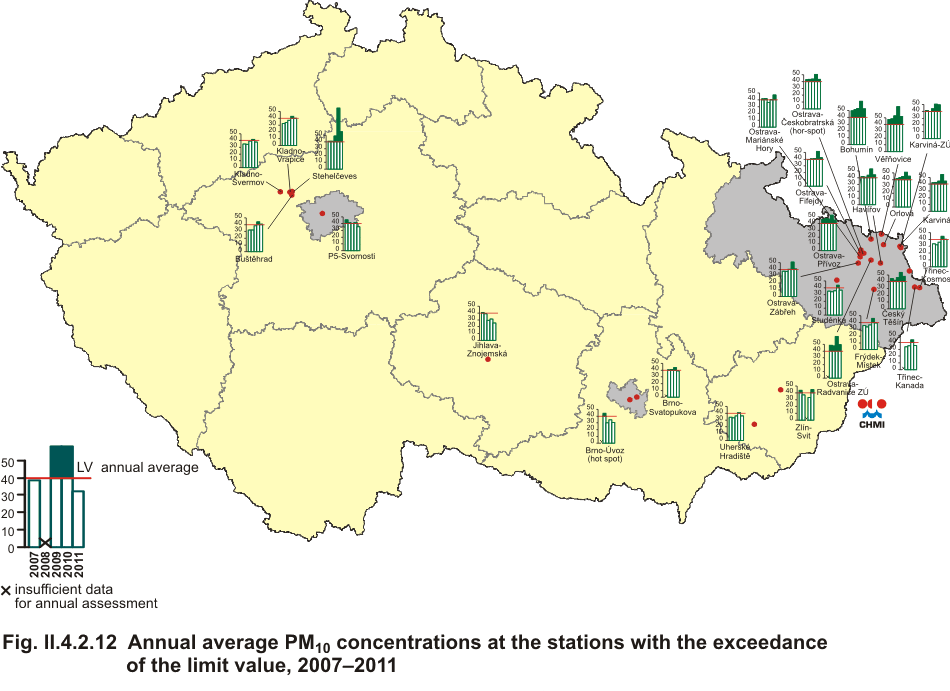
| Fig. II.4.2.12 |
Annual average PM10 concentrations at the stations with the
exceedance of the limit value, 2007–2011 |
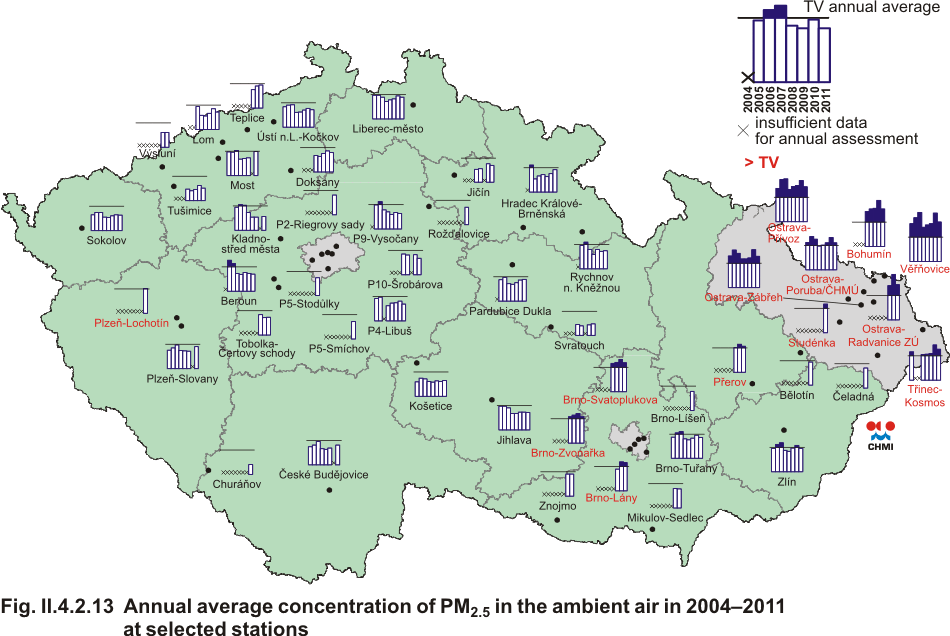
| Fig. II.4.2.13 |
Annual average concentrations of PM2.5 in the ambient air in
2004–2011 at selected stations |
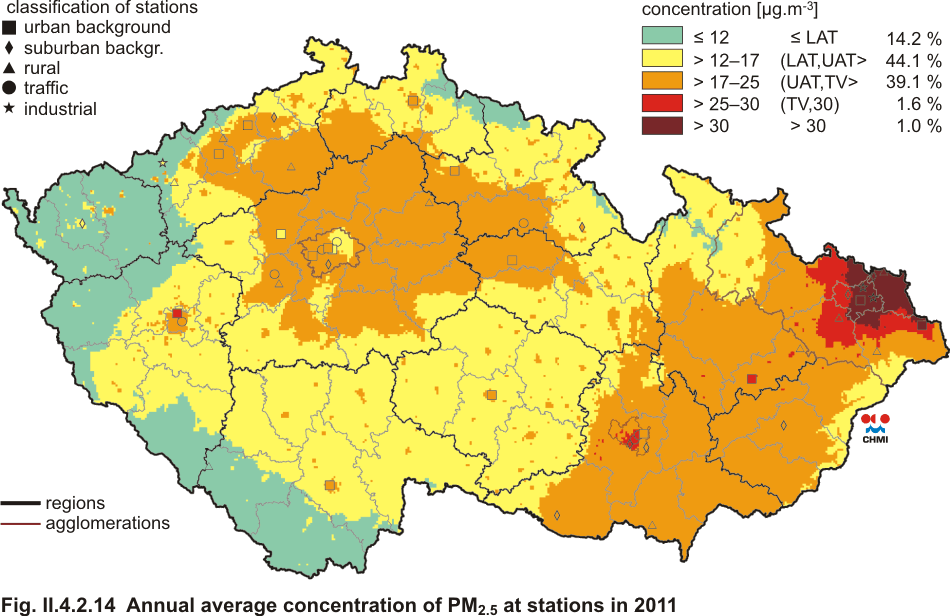
| Fig. II.4.2.14 |
Field of annual average concentration of PM2.5 in 2011 |
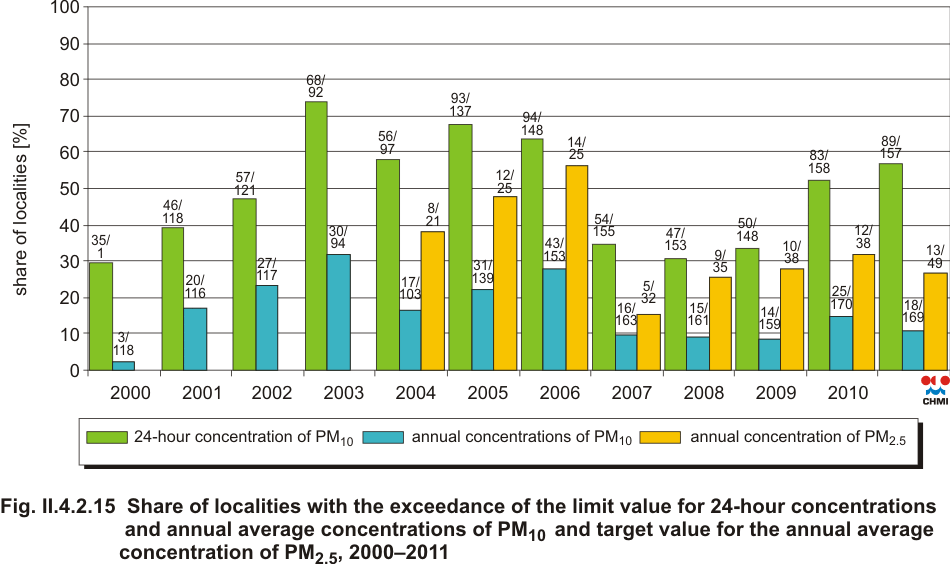
| Fig. II.4.2.15 |
Share of localities with the exceedance of the limit value for 24-hour
concentrations and annual average concentrations of PM10 and target
value for the annual average concentration of PM2.5, 2000–2011 |
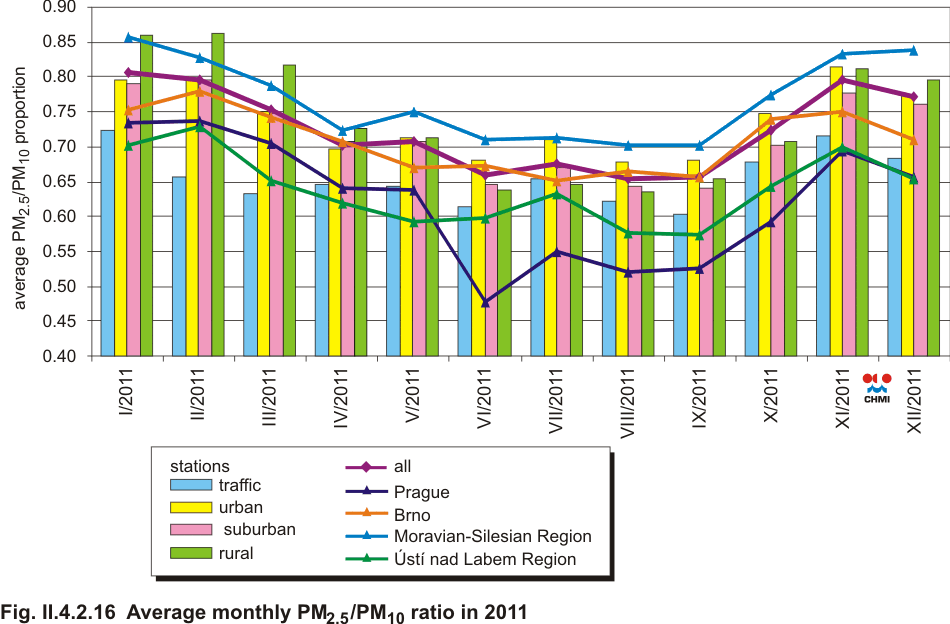
| Fig. II.4.2.16 |
Average monthly PM2.5/PM10 ratio in 2011 |
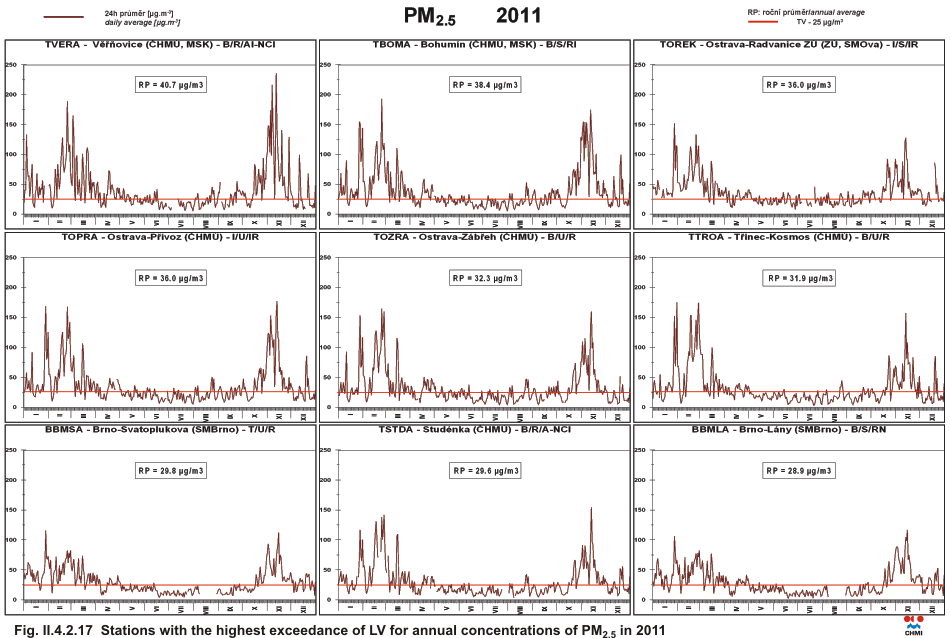
| Fig. II.4.2.17 |
Stations with the highest exceedance of LV for annual concentrations
of PM2.5 in 2011 |
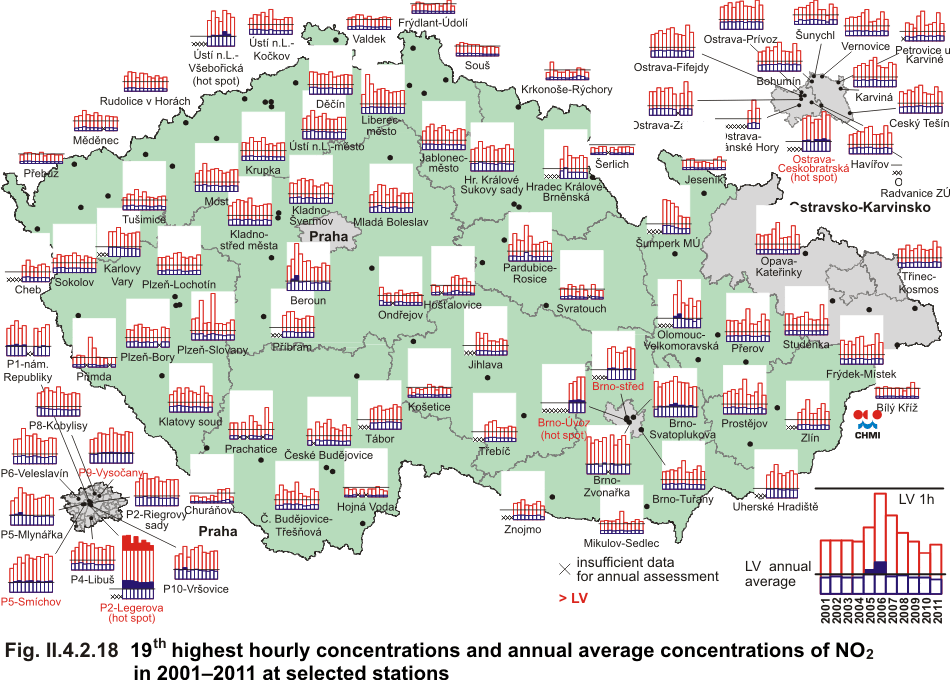
| Fig. II.4.2.18 |
19th highest hourly concentrations and annual average concentrations
of NO2 in 2001–2011 at selected stations |
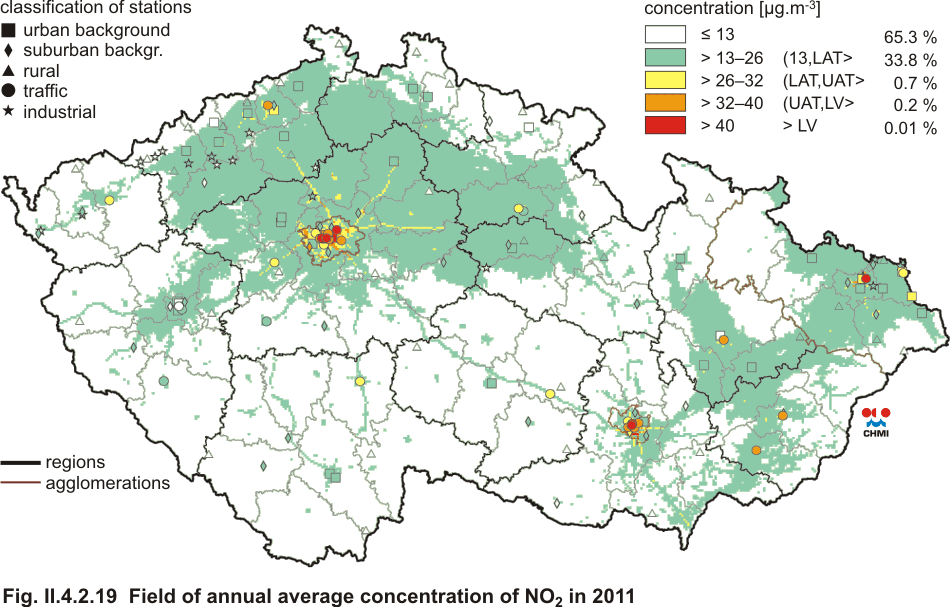
| Fig. II.4.2.19 |
Field of annual average concentration of NO2 in 2011 |
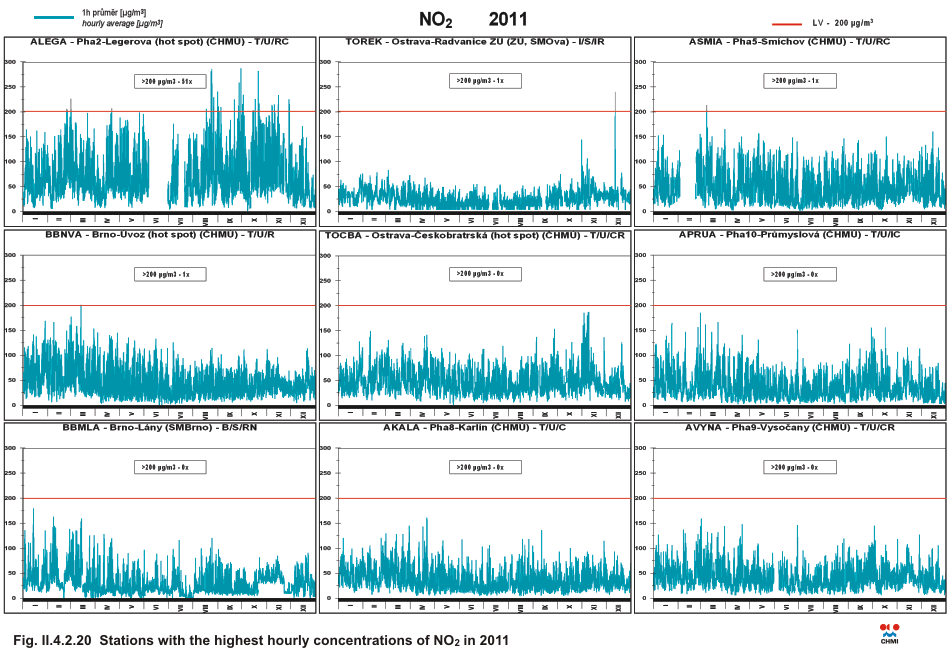
| Fig. II.4.2.20 |
Stations with the highest hourly concentrations of NO2 in 2011 |
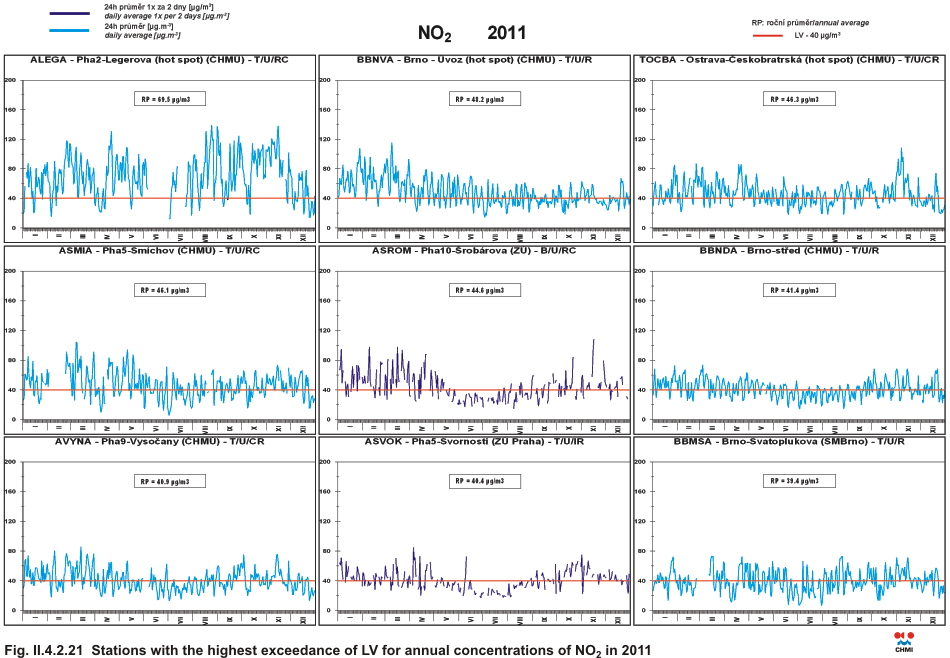
| Fig. II.4.2.21 |
Stations with the highest exceedance of LV for annual concentrations
of NO2 in 2011 |
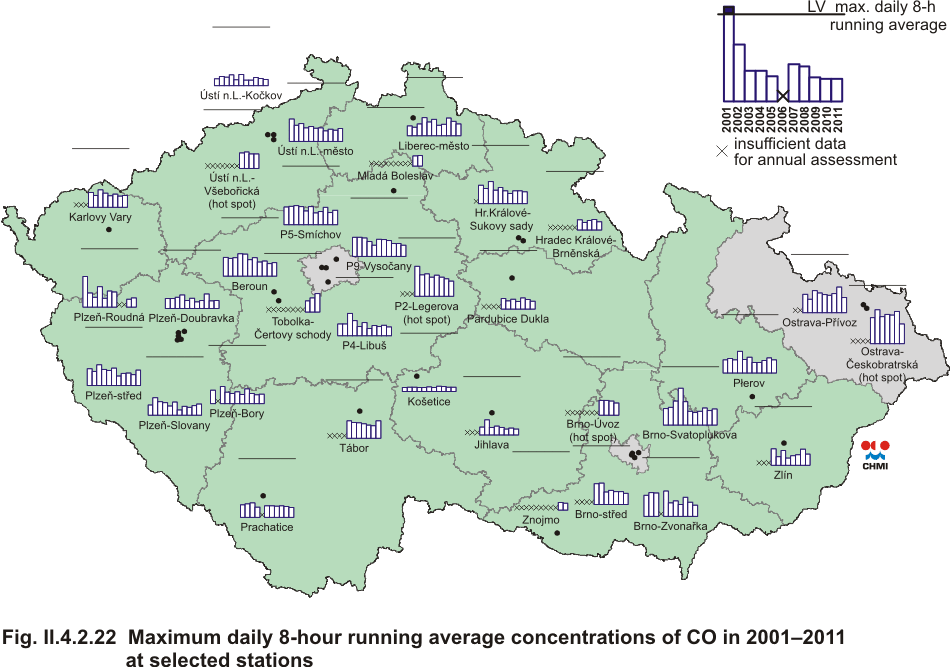
| Fig. II.4.2.22 |
Maximum daily 8-hour running average concentrations of CO in
2001–2011 at selected stations |
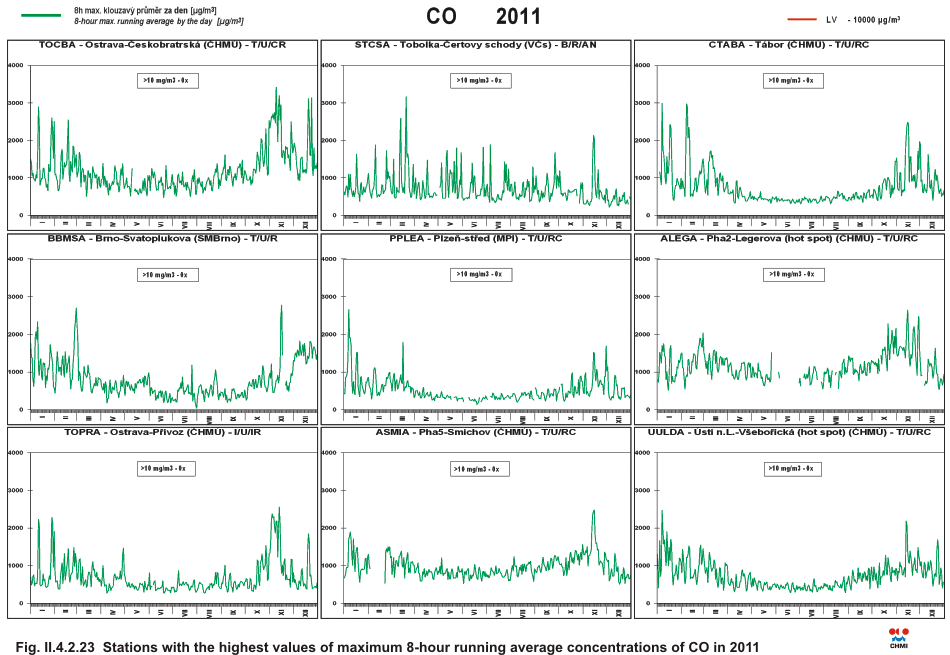
| Fig. II.4.2.23 |
Stations with the highest values of maximum daily 8-hour running
average concentrations of CO in 2011 |
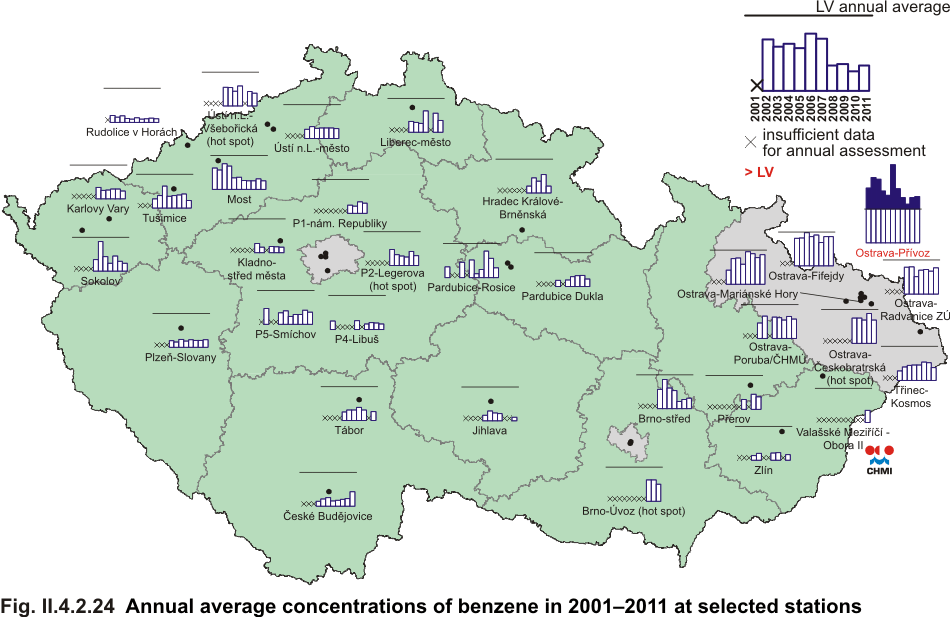
| Fig. II.4.2.24 |
Annual average concentrations of benzene in 2001–2011 at selected
stations |
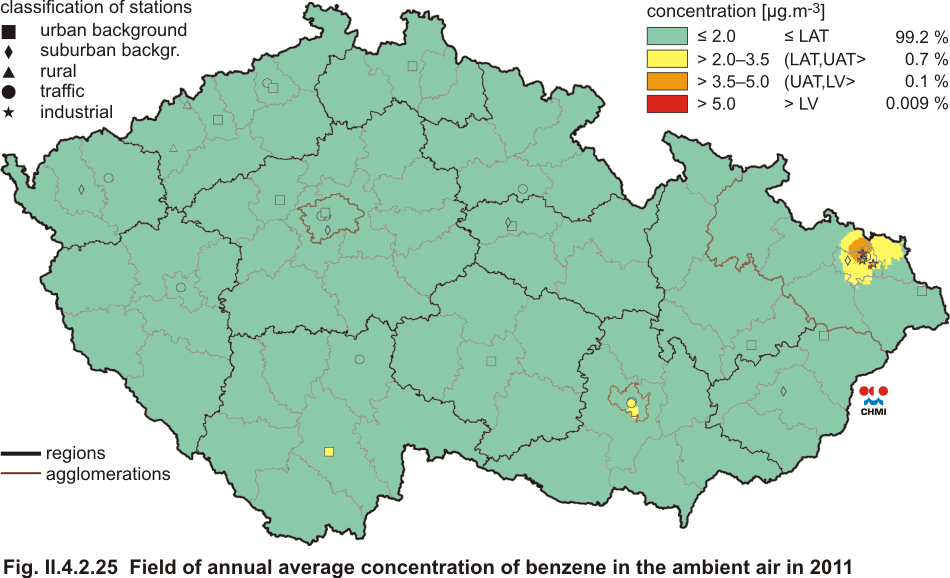
| Fig. II.4.2.25 |
Field of annual average concentration of benzene in the ambient air
in 2011 |
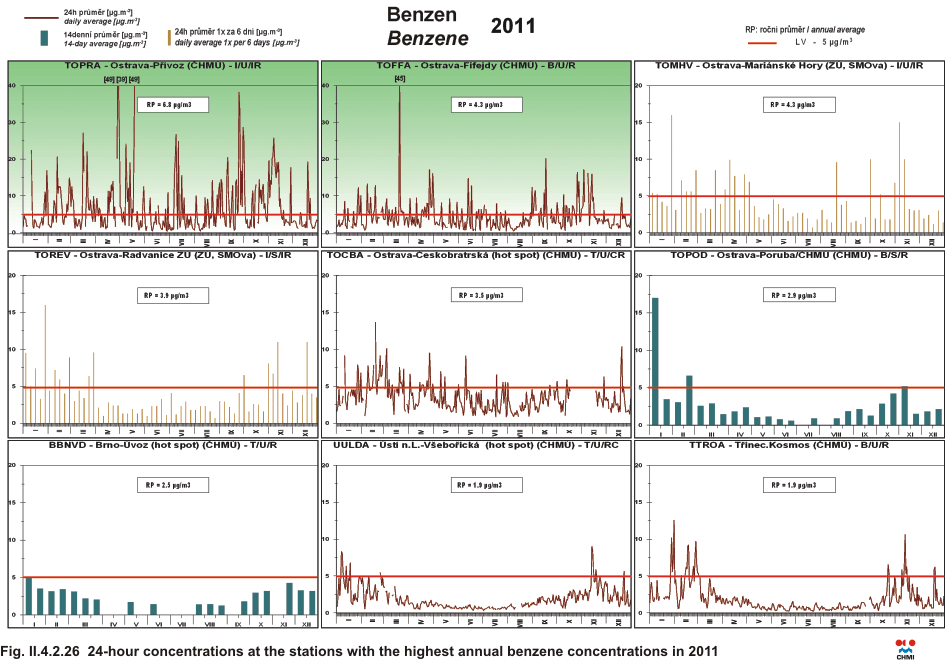
| Fig. II.4.2.26 |
24-hour concentrations at the stations with the highest annual
benzene concentrations in 2011 |
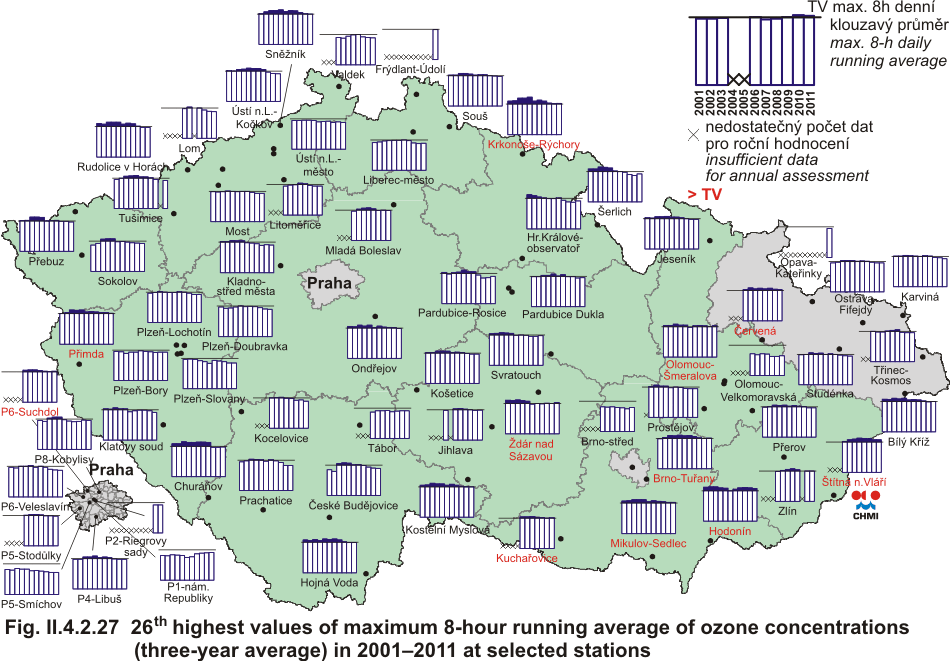
| Fig. II.4.2.27 |
26th highest values of maximum daily 8-hour running average of
ground-level ozone concentrations (three-year average) in 2001–2011 at
selected stations |
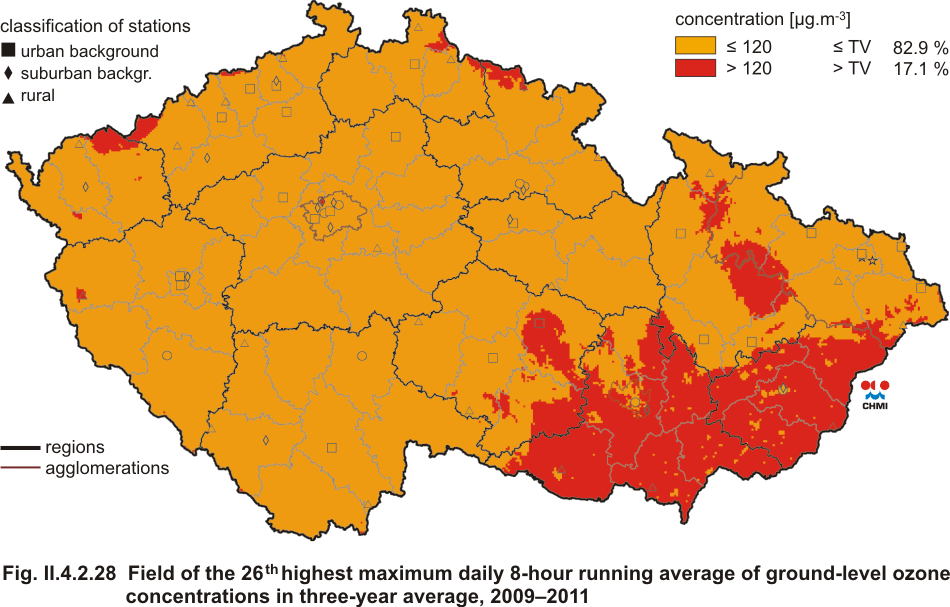
| Fig. II.4.2.28 |
Field of the 26th highest maximum daily 8-hour running average of
ground-level ozone concentrations in three-year average, 2009–2011 |
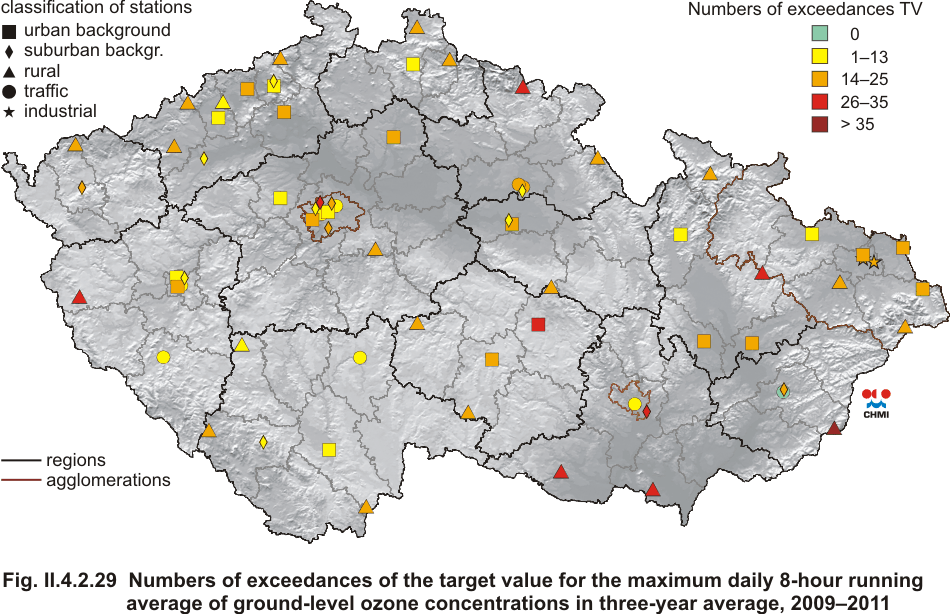
| Fig. II.4.2.29 |
Numbers of exceedances of the target value for the maximum daily 8-hour
running average of ground-level ozone concentrations in three-year
average, 2009–2011 |
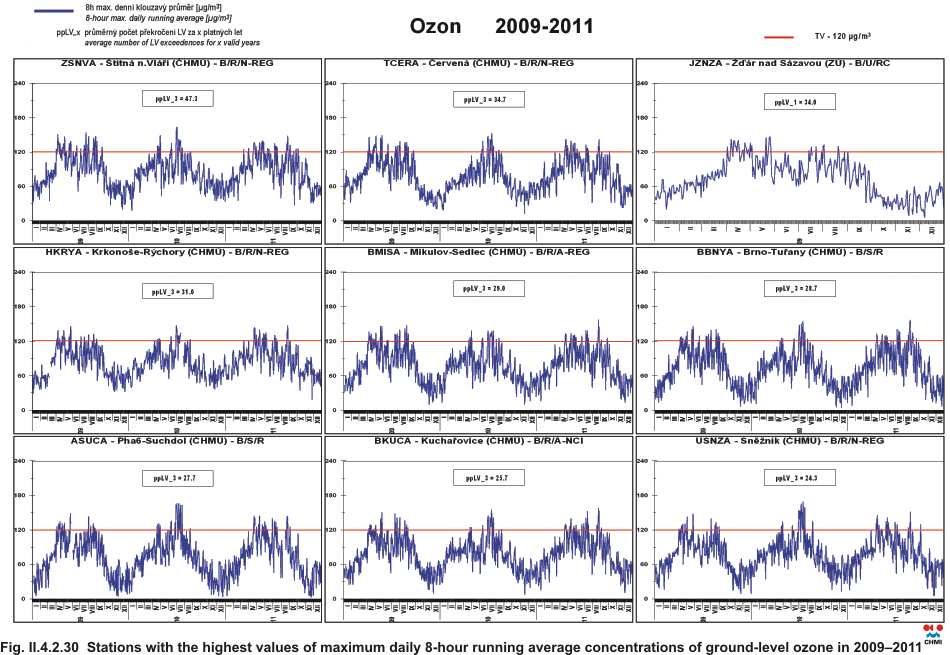
| Fig. II.4.2.30 |
Stations with the highest values of maximum daily 8-hour running
average concentrations of ground-level ozone in 2009–2011 |
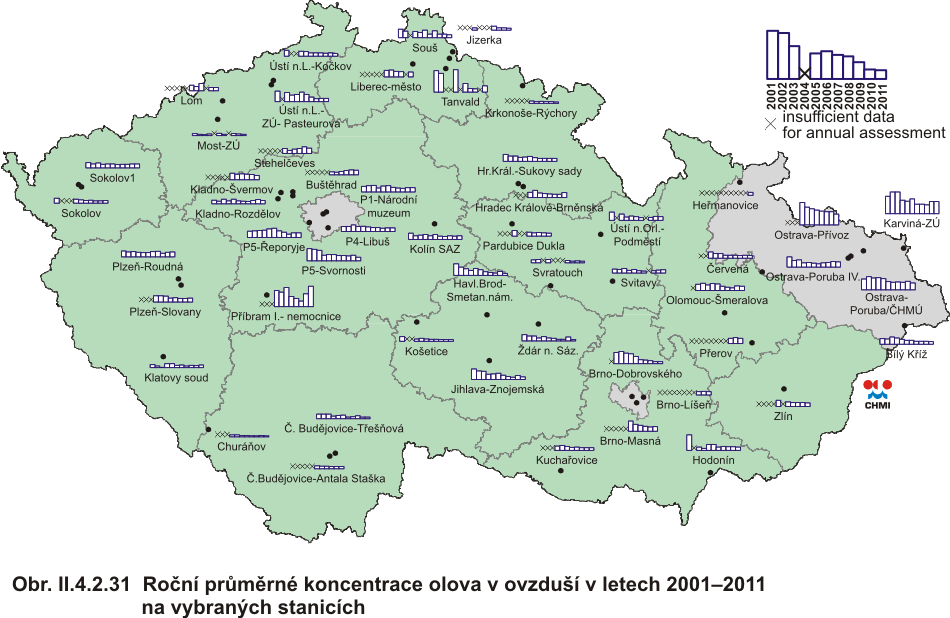
| Fig. II.4.2.31 |
Annual average concentrations of lead in the ambient air in
2001–2011 at selected stations |
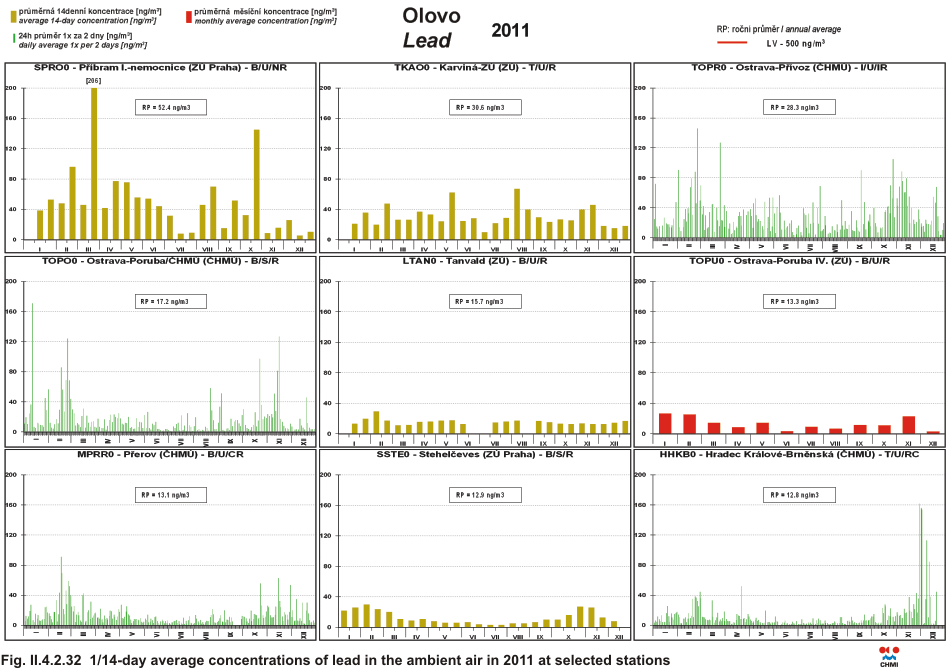
| Fig. II.4.2.32 |
1/14-day average concentrations of lead in the ambient air in 2011
at selected stations |
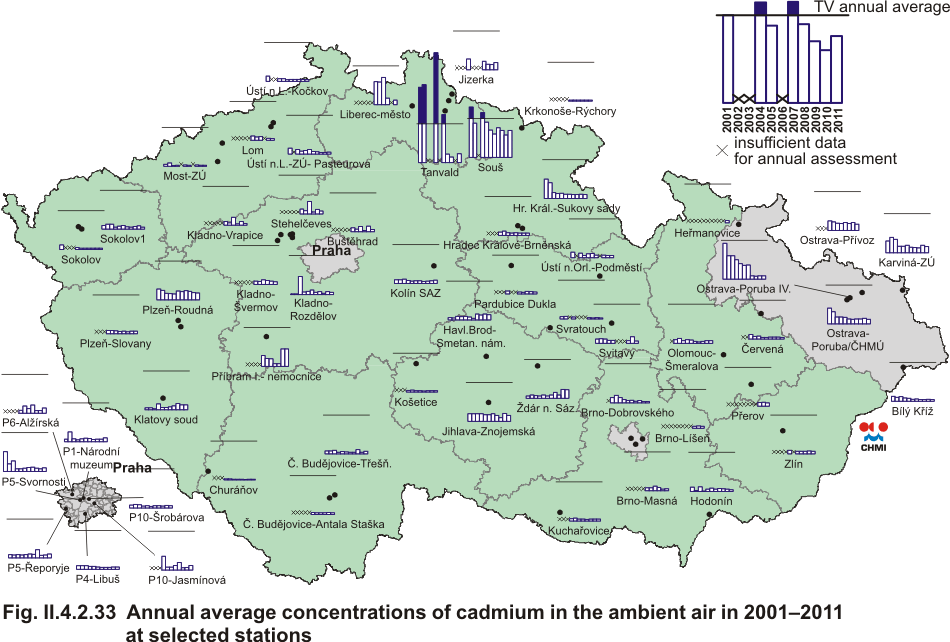
| Fig. II.4.2.33 |
Annual average concentrations of cadmium in the ambient air in
2001–2011 at selected stations |
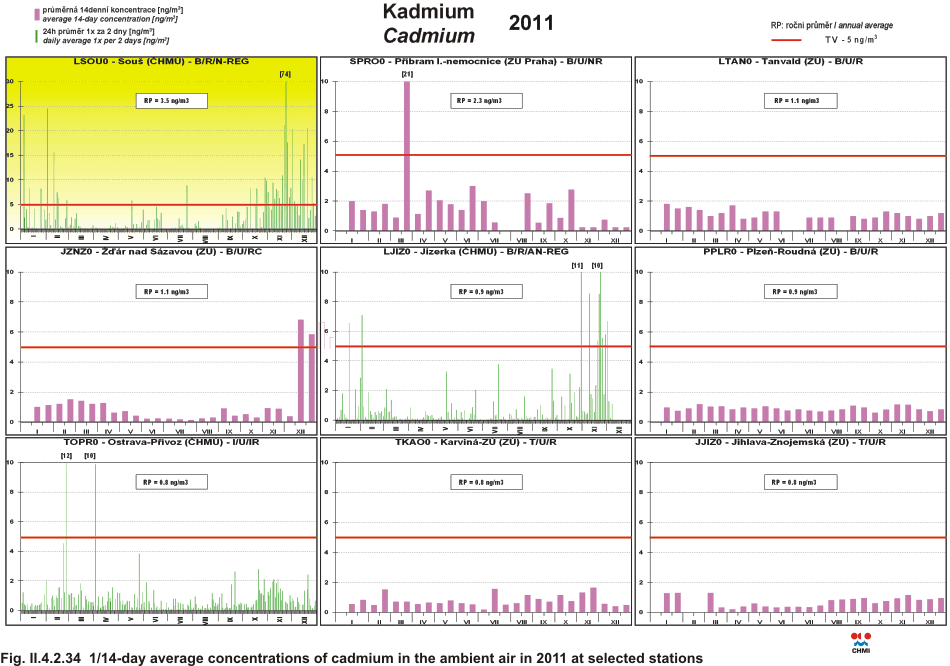
| Fig. II.4.2.34 |
1/14-day average concentrations of cadmium in the ambient air in
2011 at selected stations |
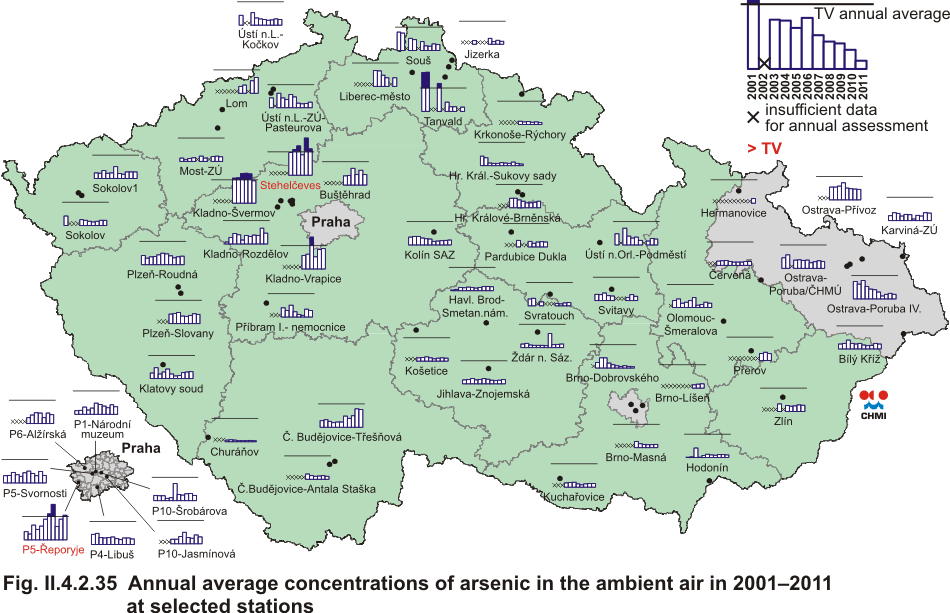
| Fig. II.4.2.35 |
Annual average concentrations of arsenic in the ambient air in
2001–2011 at selected stations |
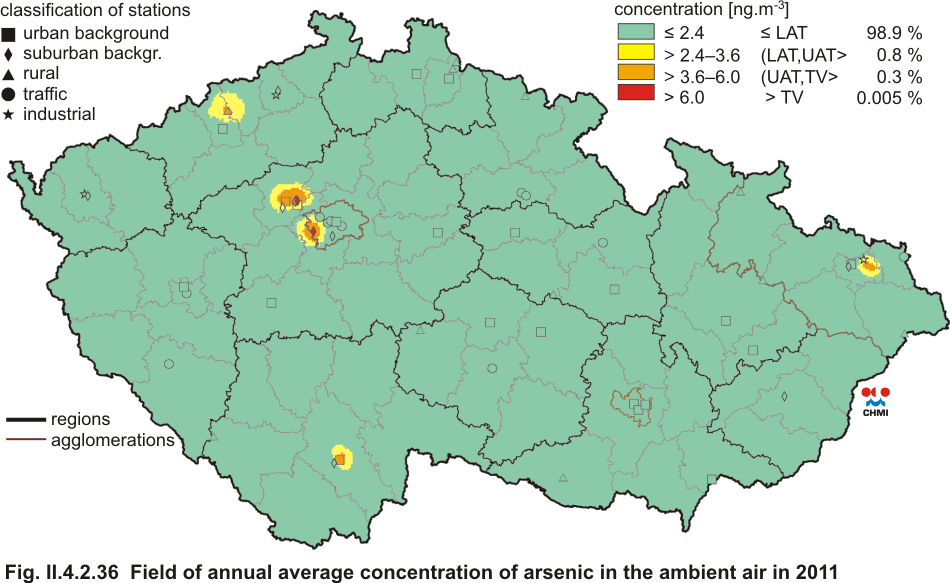
| Fig. II.4.2.36 |
Field of annual average concentration of arsenic in the ambient air
in 2011 |
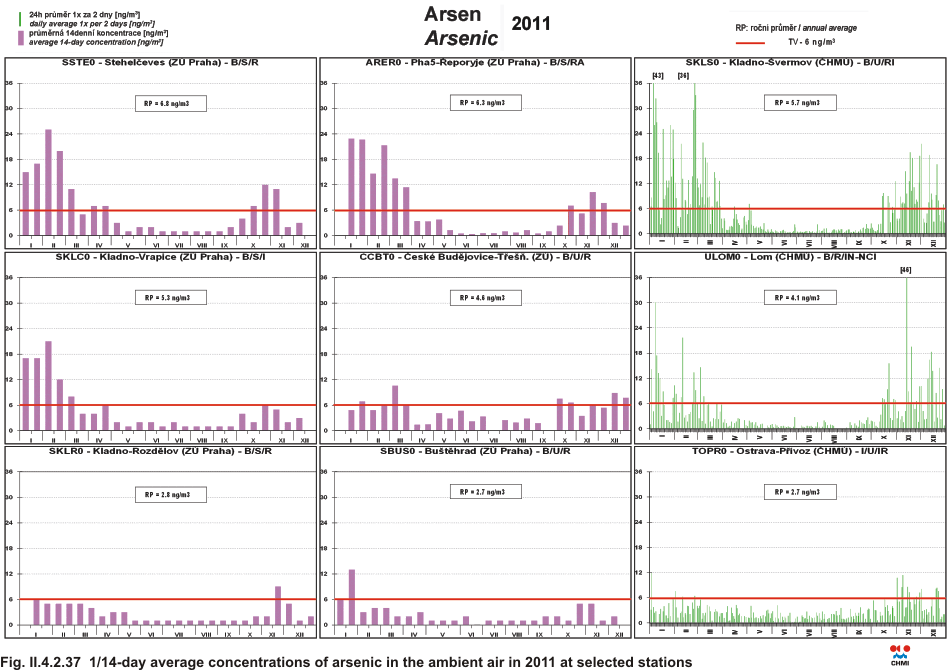
| Fig. II.4.2.37 |
1/14-day average concentrations of arsenic in the ambient air in
2011 at selected stations |
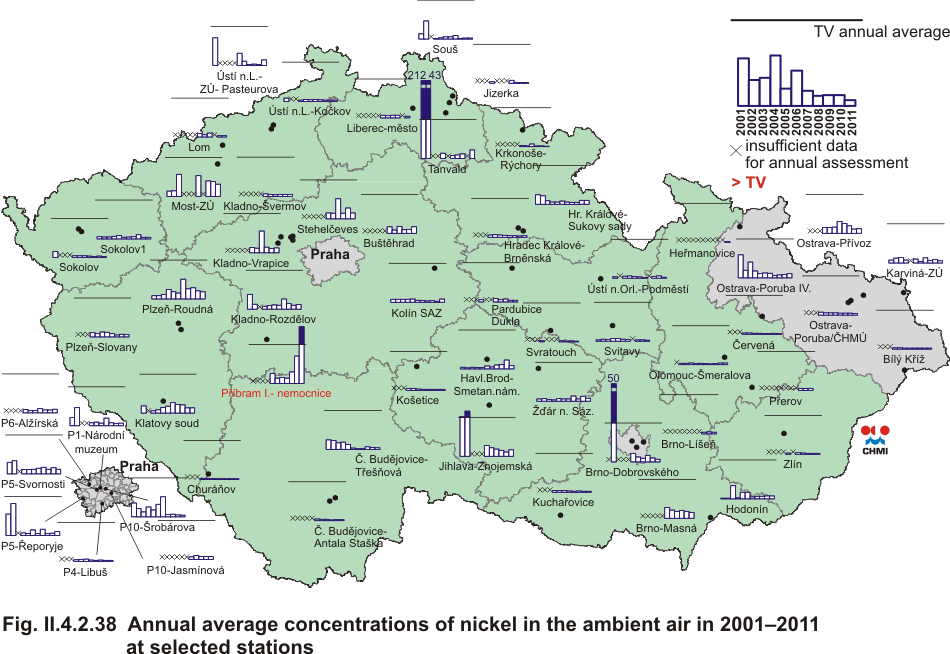
| Fig. II.4.2.38 |
Annual average concentrations of nickel in the ambient air in
2001–2011 at selected stations |
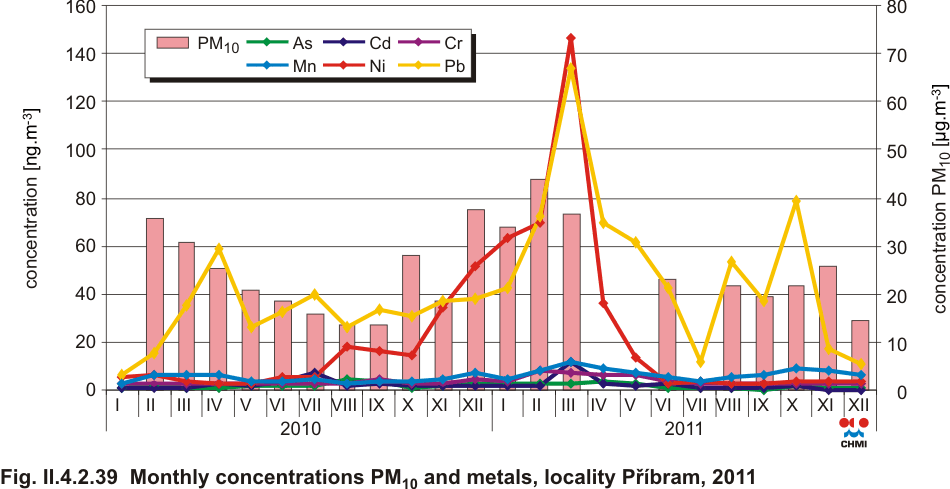
| Fig. II.4.2.39 |
Monthly concentrations PM10 and metals, locality PĹ™Ăbram, 2011 |
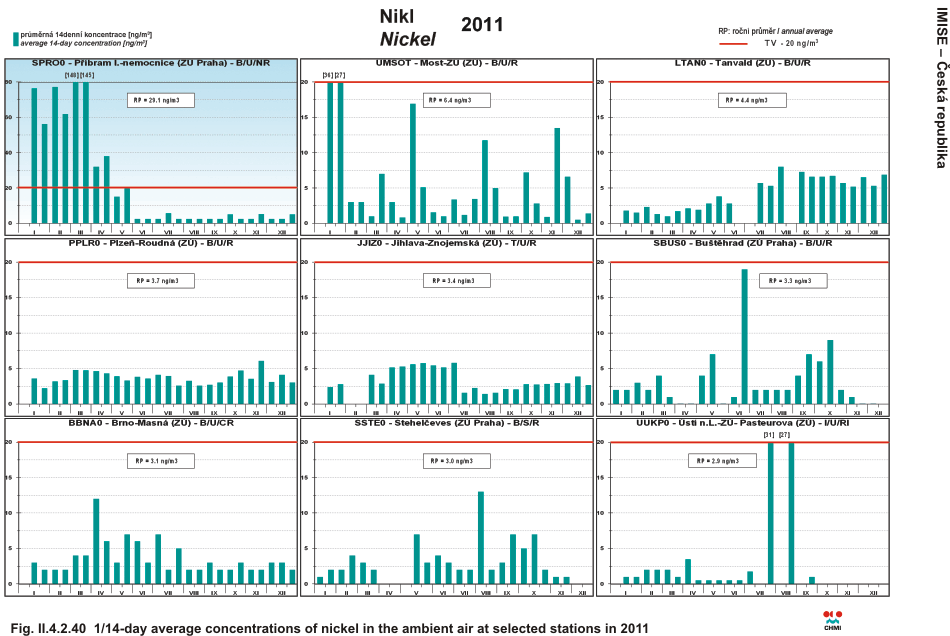
| Fig. II.4.2.40 |
1/14-day average concentrations of nickel in the ambient air in 2011
at selected stations |
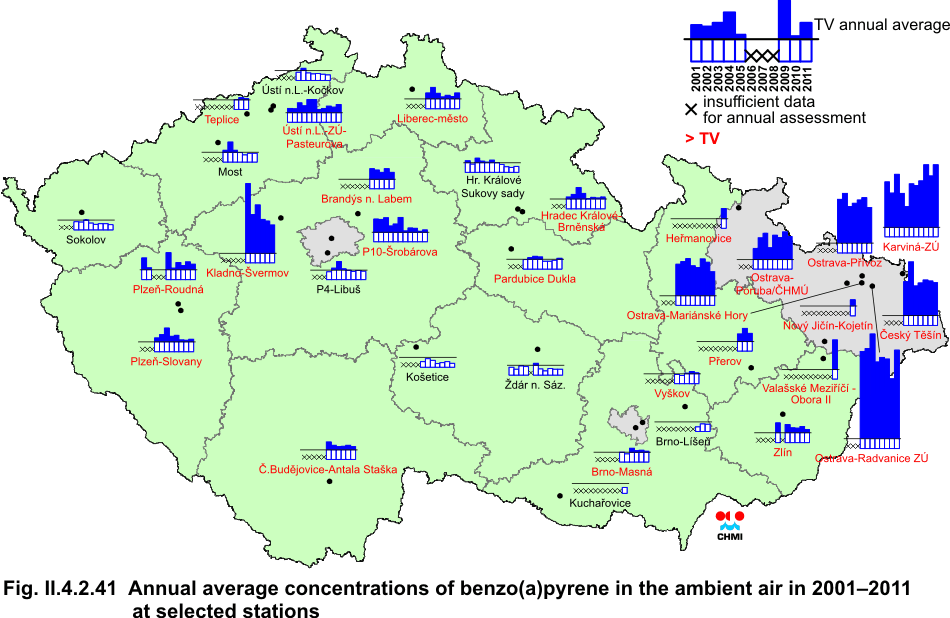
| Fig. II.4.2.41 |
Annual average concentrations of benzo(a)pyrene in the ambient air
in 2001–2011 at selected stations |
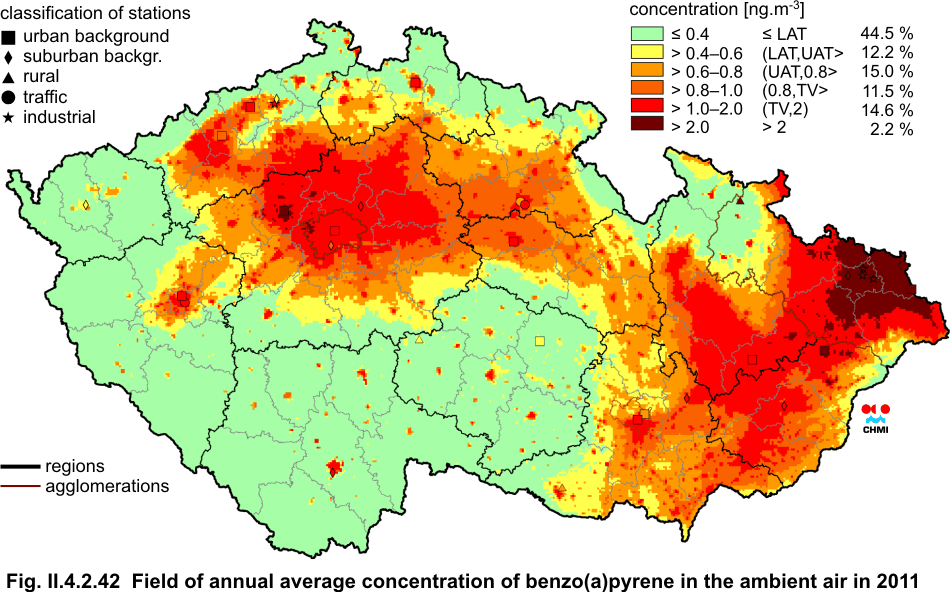
| Fig. II.4.2.42 |
Field of annual average concentration of benzo(a)pyrene in the
ambient air in 2011 |
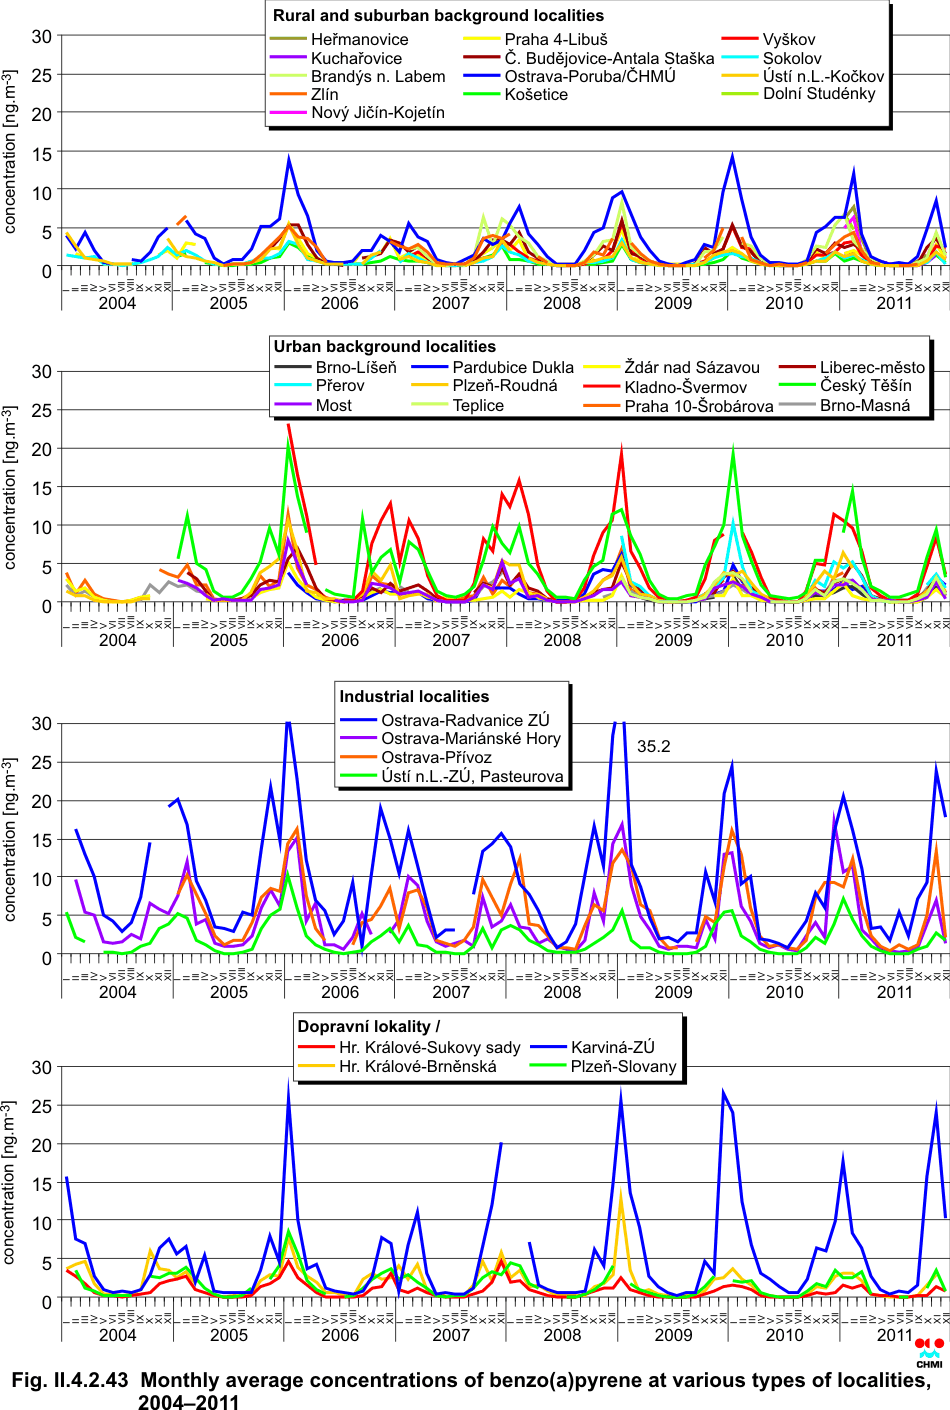
| Fig. II.4.2.43 |
Monthly average concentrations of benzo(a)pyrene in various types of
localities, 2004–2011 |
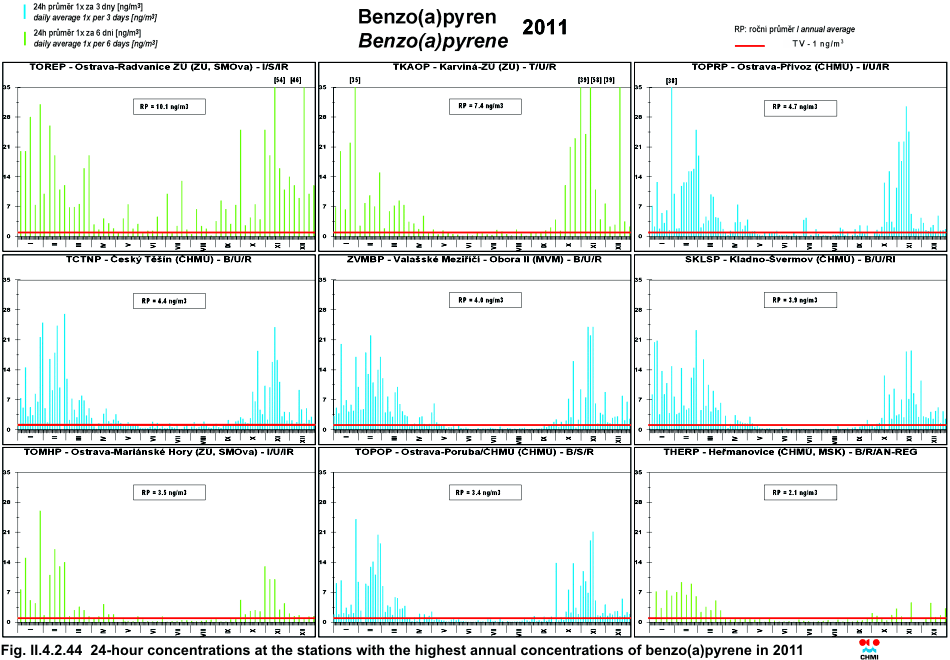
| Fig. II.4.2.44 |
24-hour concentrations at the stations with the highest annual
concentrations of benzo(a)pyrene in 2011 |
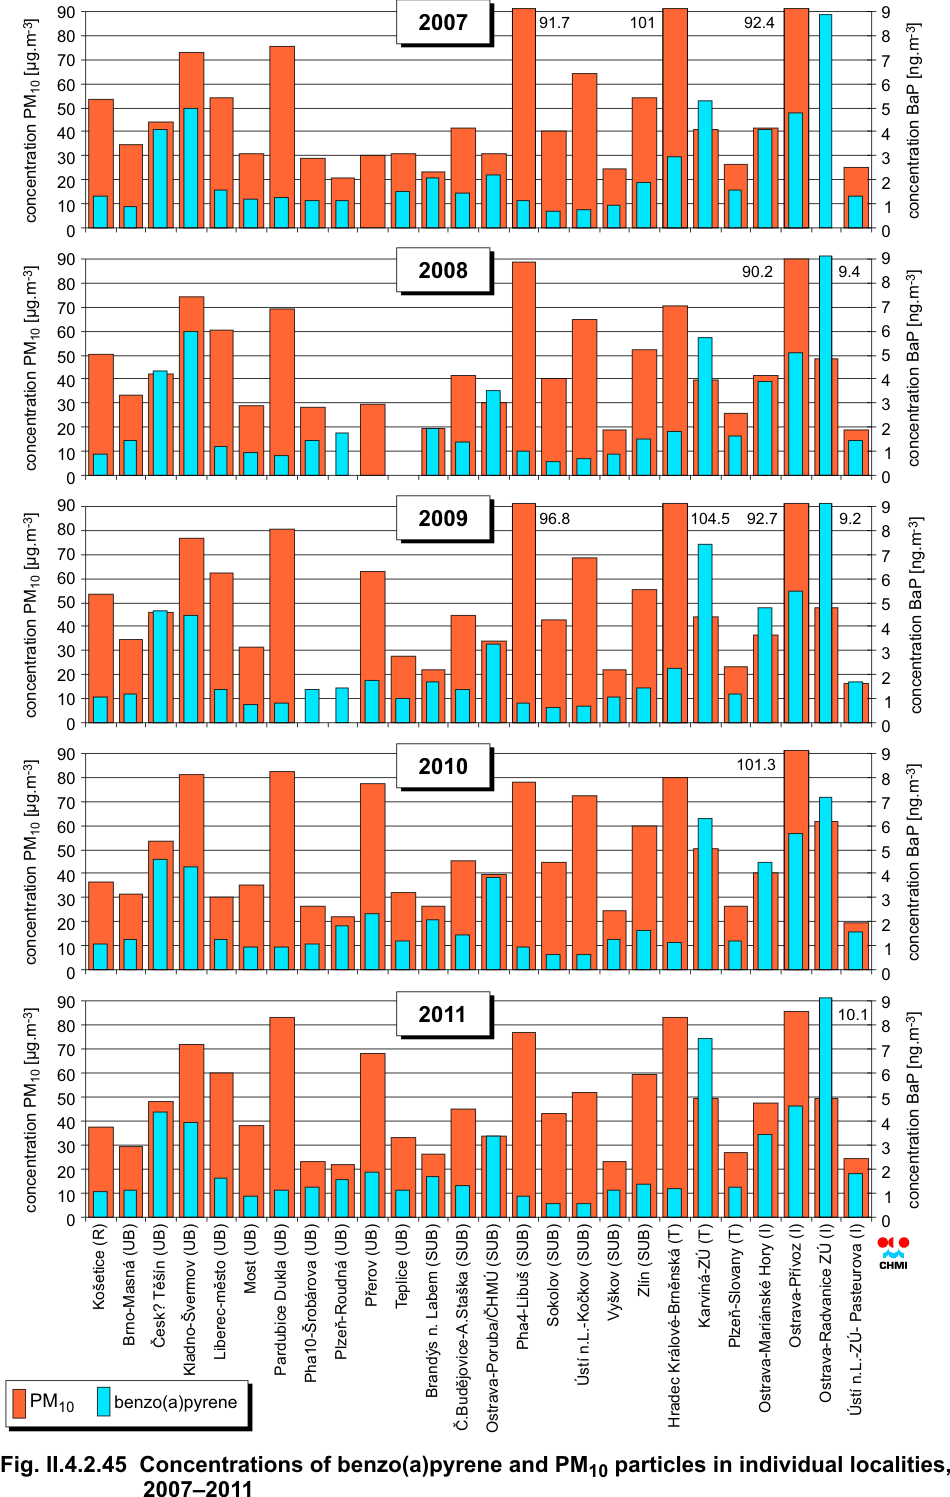
| Fig. II.4.2.45 |
Concentrations of benzo(a)pyrene and PM10 particles in individual
localities, 2007–2011 |
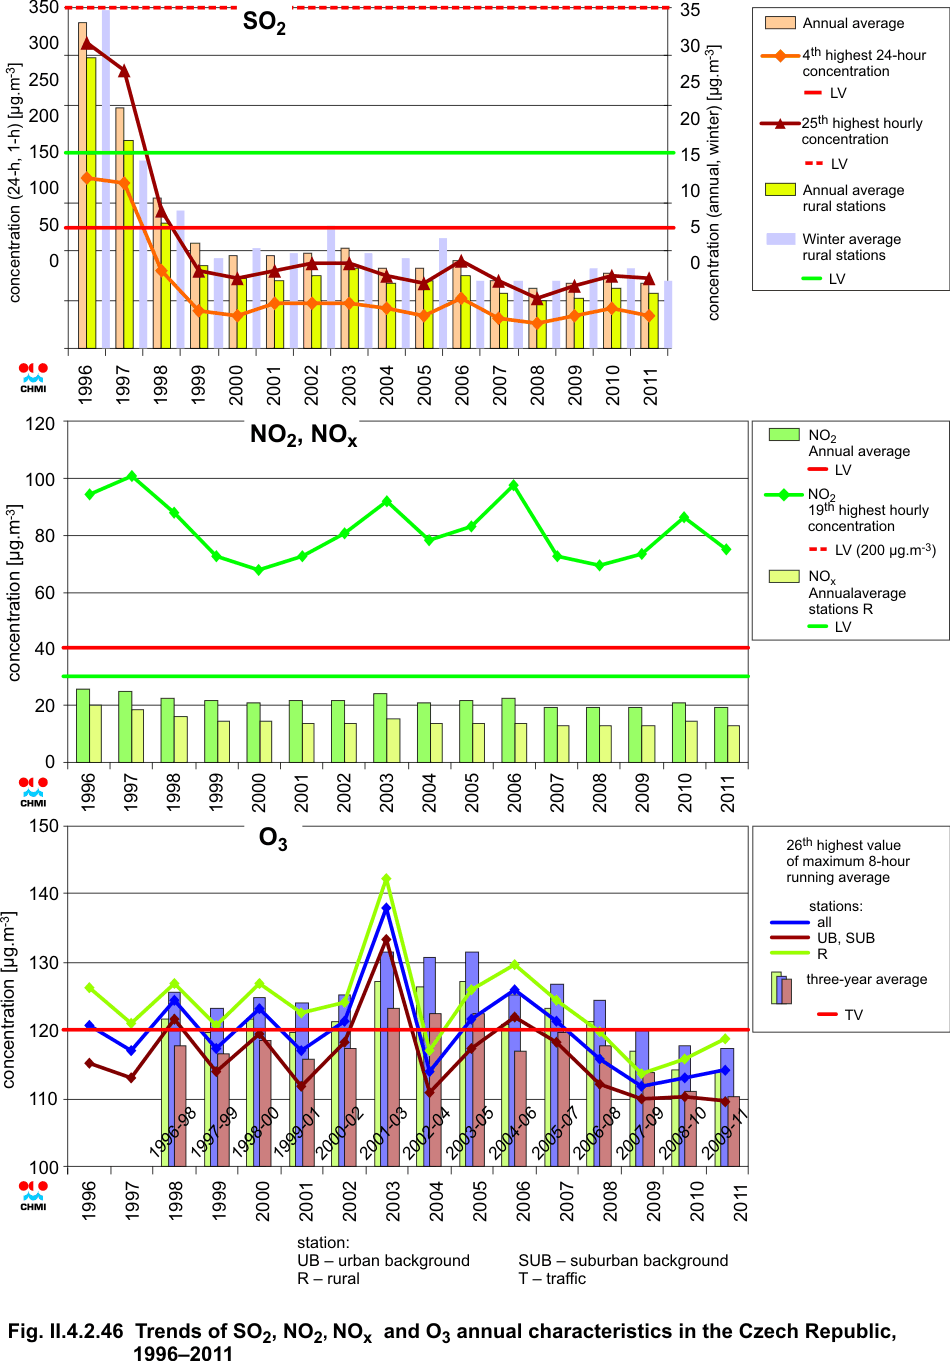
| Fig. II.4.2.46 |
Trends of SO2, NO2, NOx and O3 annual characteristics in the Czech
Republic, 1996–2011 |
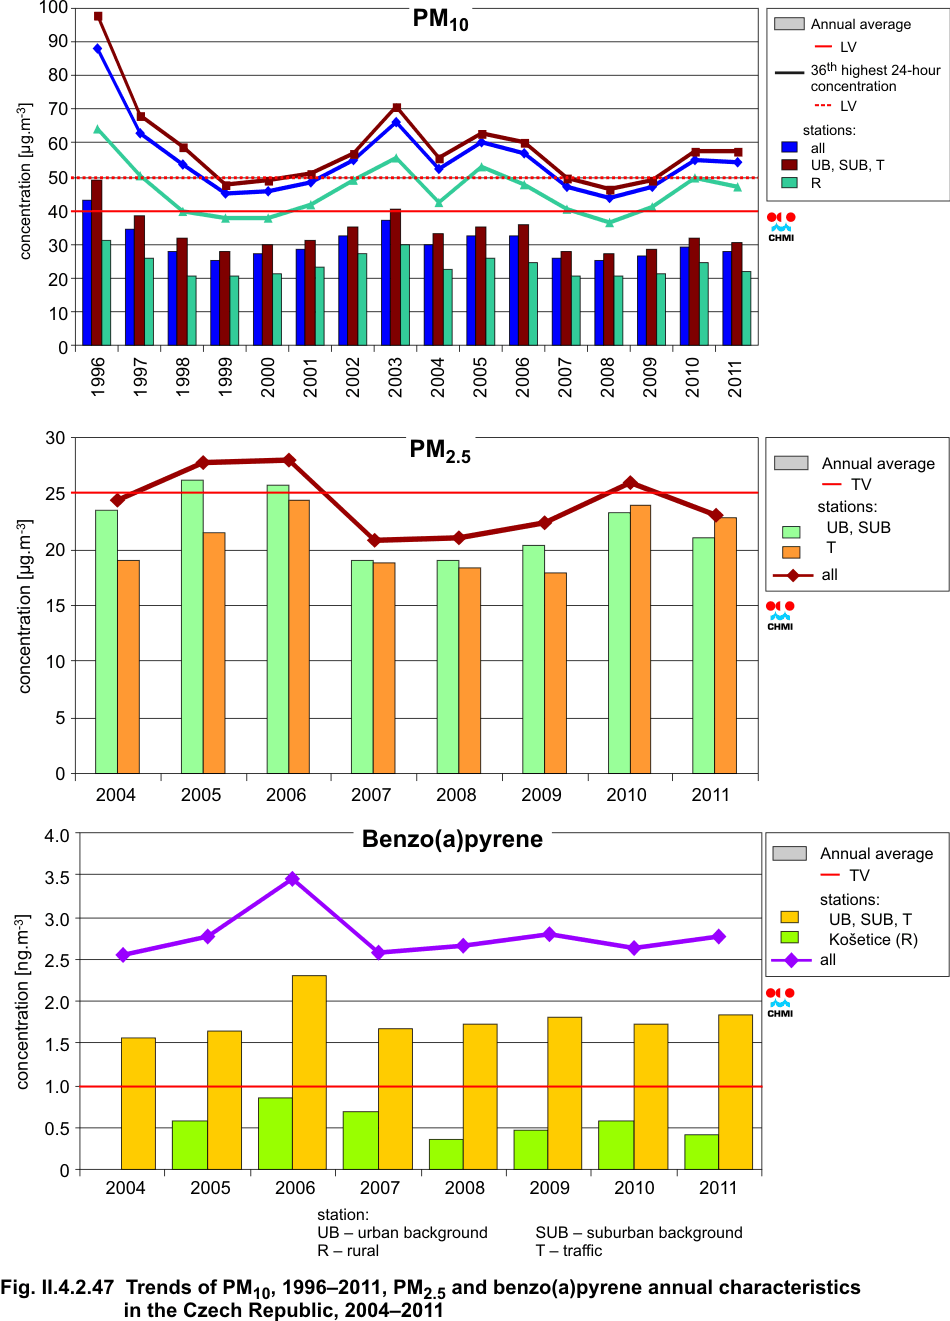
| Fig. II.4.2.47 |
Trends of PM10 , PM2.5 and benzo(a)pyrene annual characteristics in
the Czech Republic, 1996–2011 |
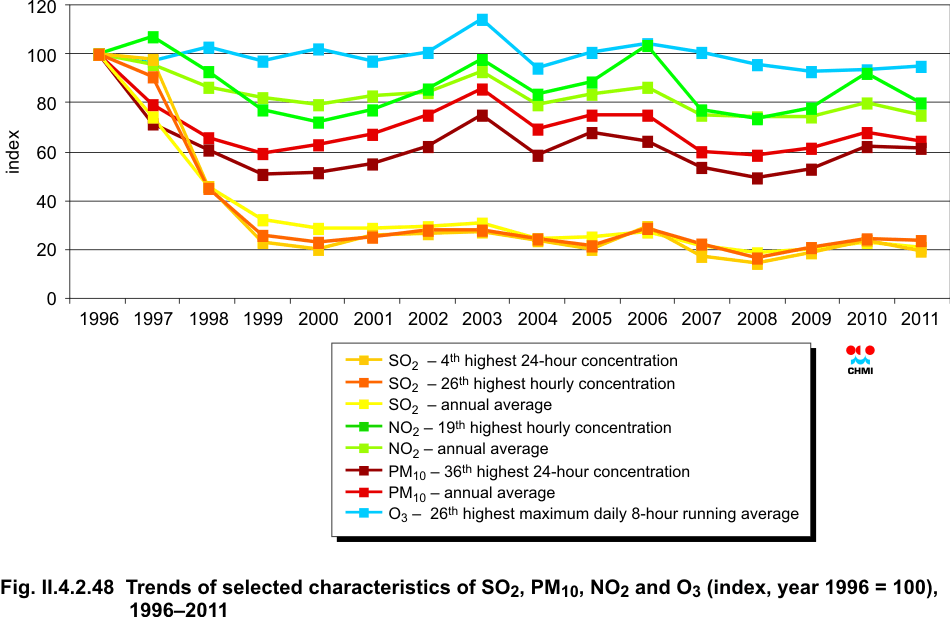
| Fig. II.4.2.48 |
Trends of selected characteristics of SO2, PM10, NO2 and O3 (index,
year 1996 = 100), 1996–2011 |
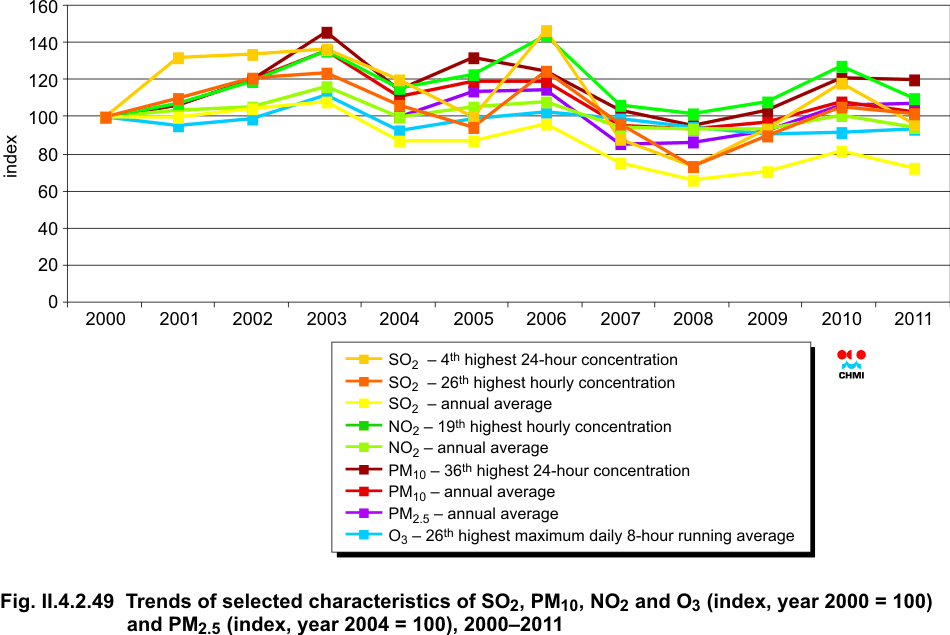
| Fig. II.4.2.49 |
Trends of selected characteristics of SO2, PM10, NO2 and O3 (index,
year 2000 = 100) and PM2.5 (index, year 2004=100), 2000–2011 |
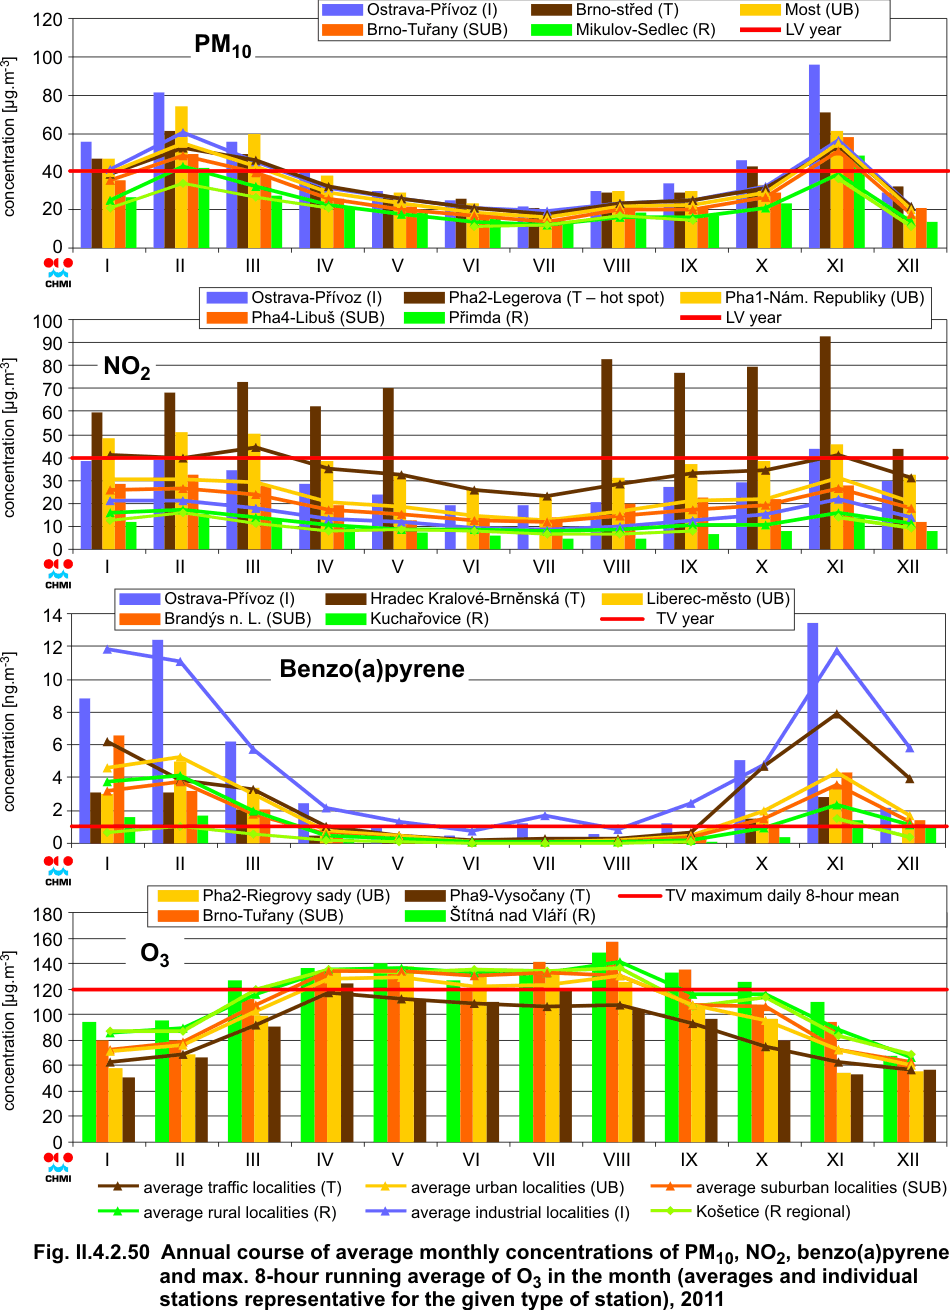
| Fig. II.4.2.50 |
Annual course of average monthly concentrations of PM10, NO2,
benzo(a)pyrene and max. 8-hour running average of O3 in the month
(averages and individual stations representative for the given type of
station), 2011 |
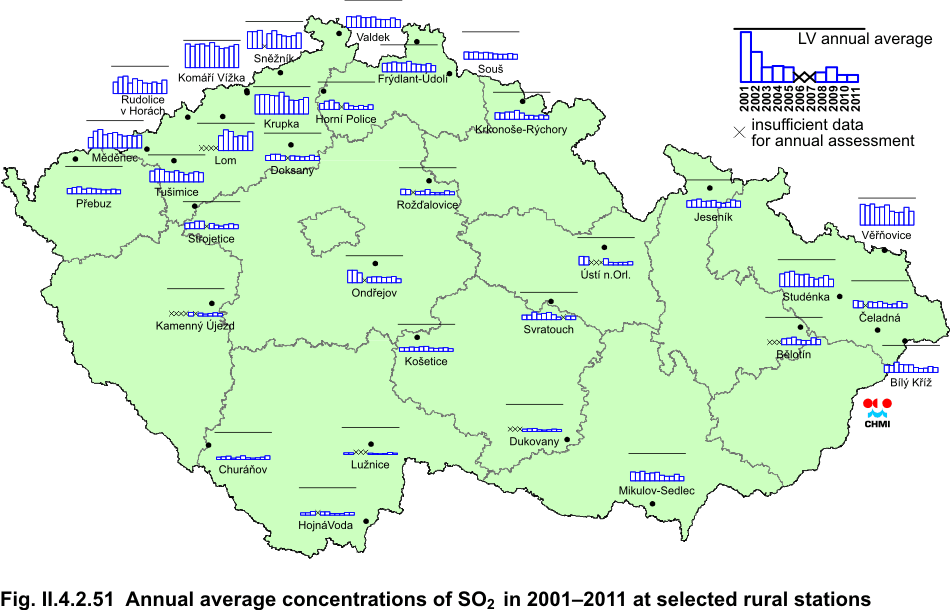
| Fig. II.4.2.51 |
Annual average concentrations of SO2 in 2001–2011 at selected rural
stations |
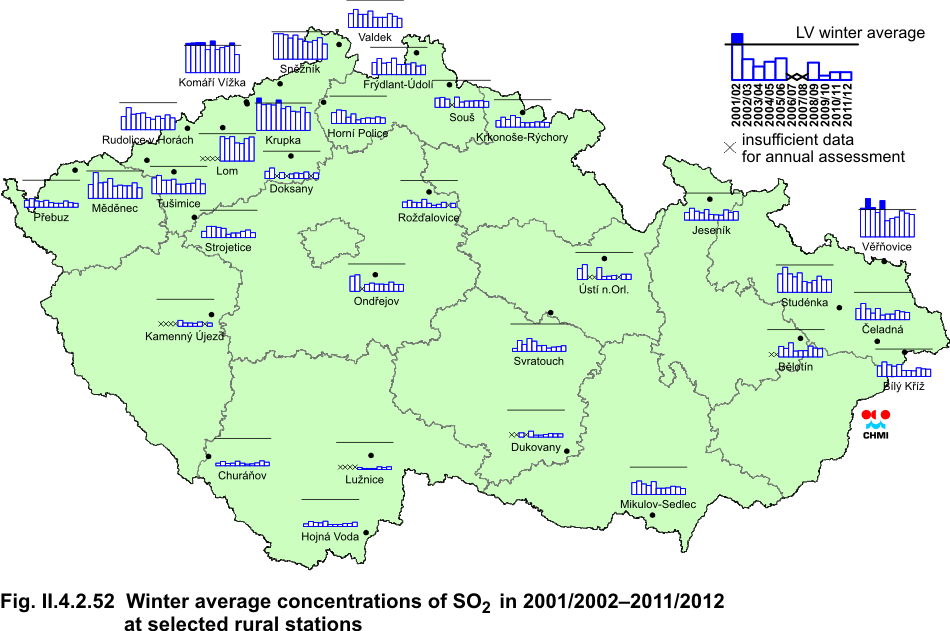
| Fig. II.4.2.52 |
Winter average concentrations of SO2 in 2001/2002–2011/2012 at
selected rural stations |
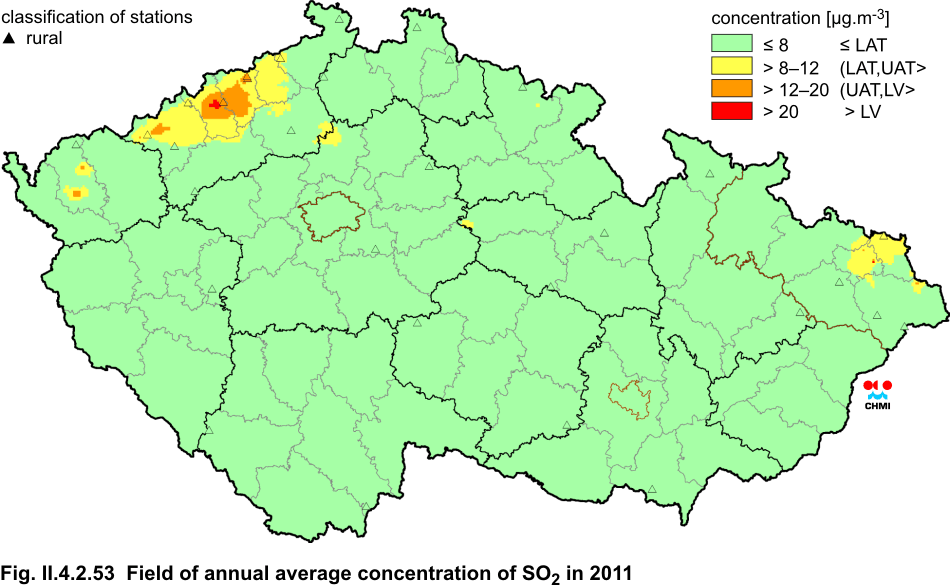
| Fig. II.4.2.53 |
Field of annual average concentration of SO2 in 2011 |
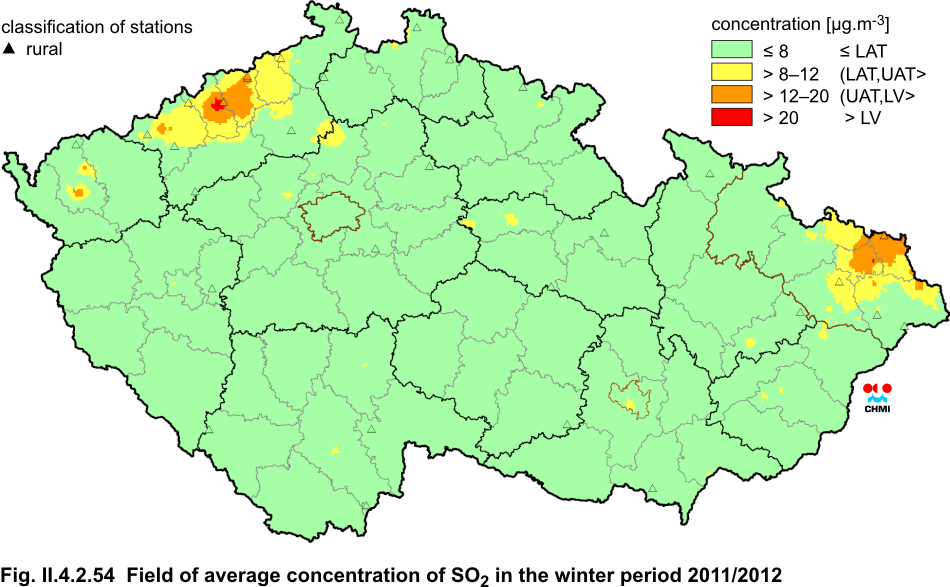
| Fig. II.4.2.54 |
Field of average concentration of SO2 in the winter period 2011/2012 |
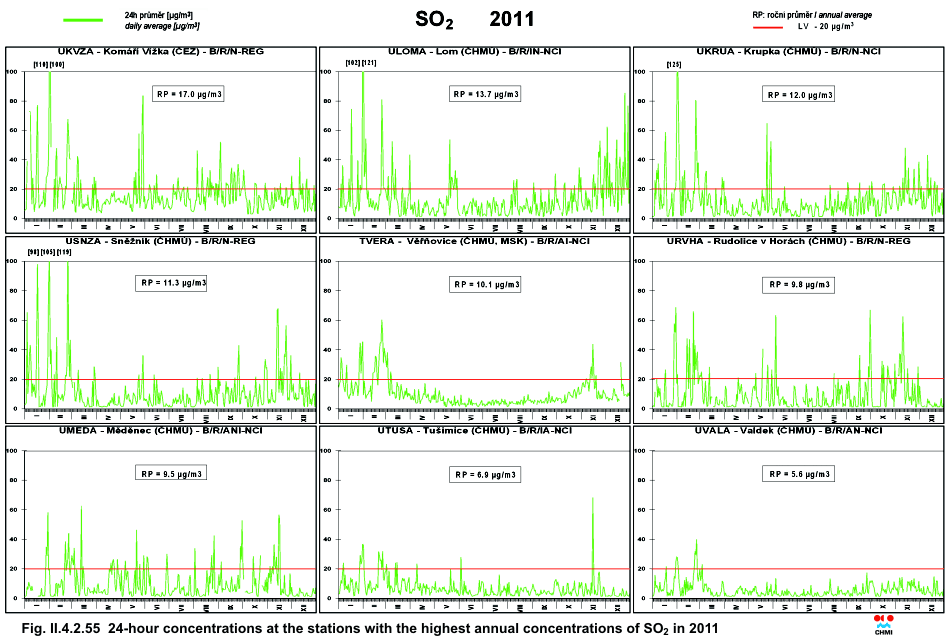
| Fig. II.4.2.55 |
24-hour concentrations at the stations with the highest annual
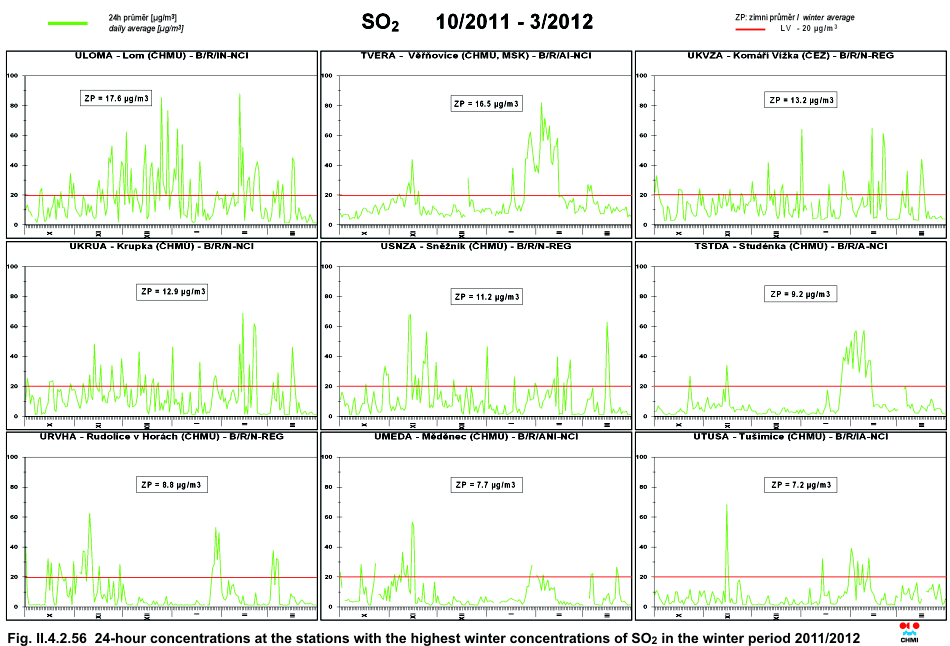
concentrations of SO2 in 2011 |
| Fig. II.4.2.56 |
24-hour concentrations at the stations with the highest winter
concentrations of SO2 in the winter period 2011/2012 |
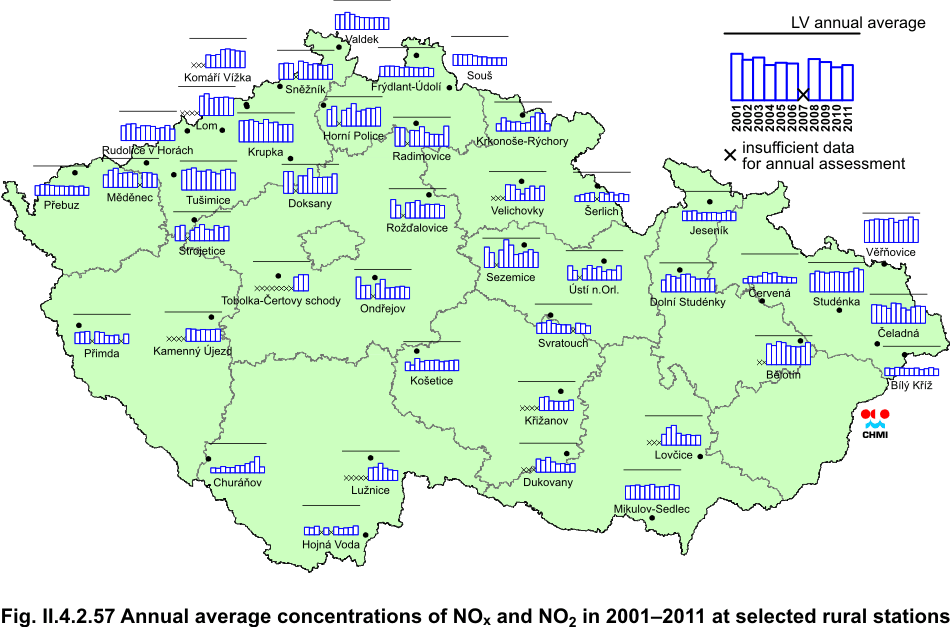
| Fig. II.4.2.57 |
Annual average concentrations of NOx and NO2 in 2001–2011 at
selected rural stations |
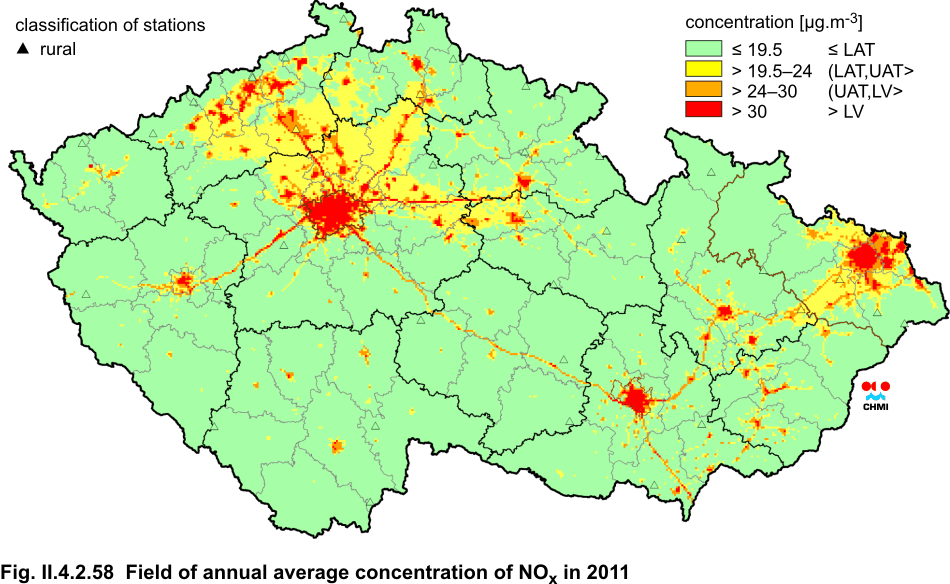
| Fig. II.4.2.58 |
Field of annual average concentration of NOx in 2011 |
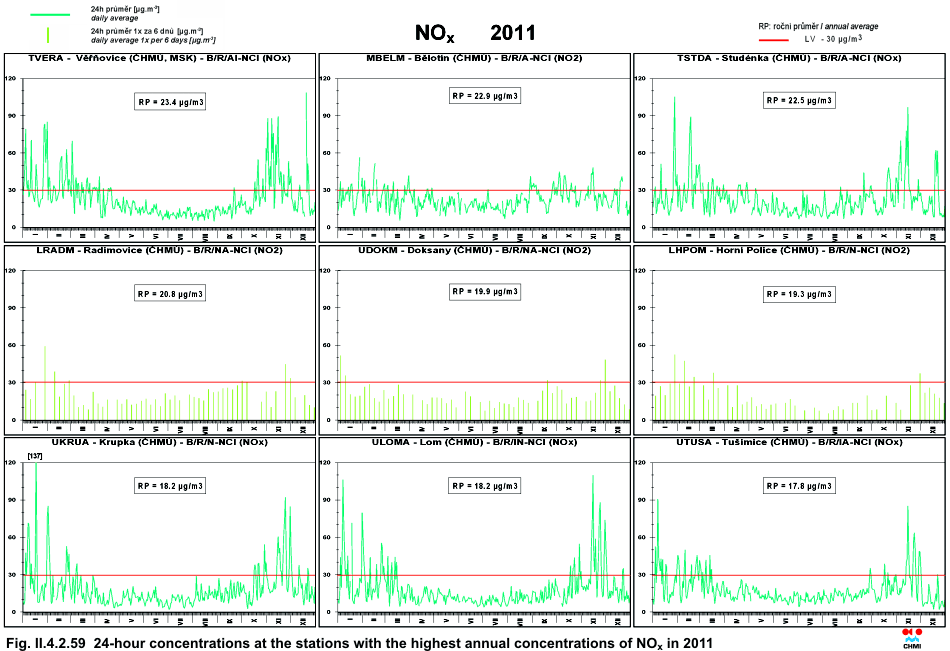
| Fig. II.4.2.59 |
24-hour concentrations at the stations with the highest annual
concentrations of NOx in 2011 |
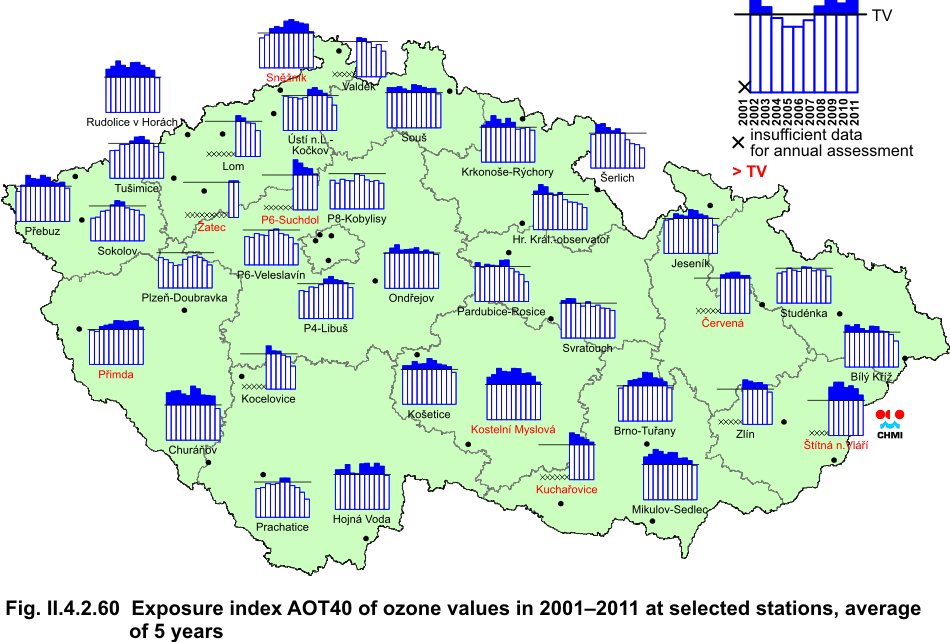
| Fig. II.4.2.60 |
Annual values of ozone exposure index AOT40 in 2001–2011 at selected
stations, average for 5 years |
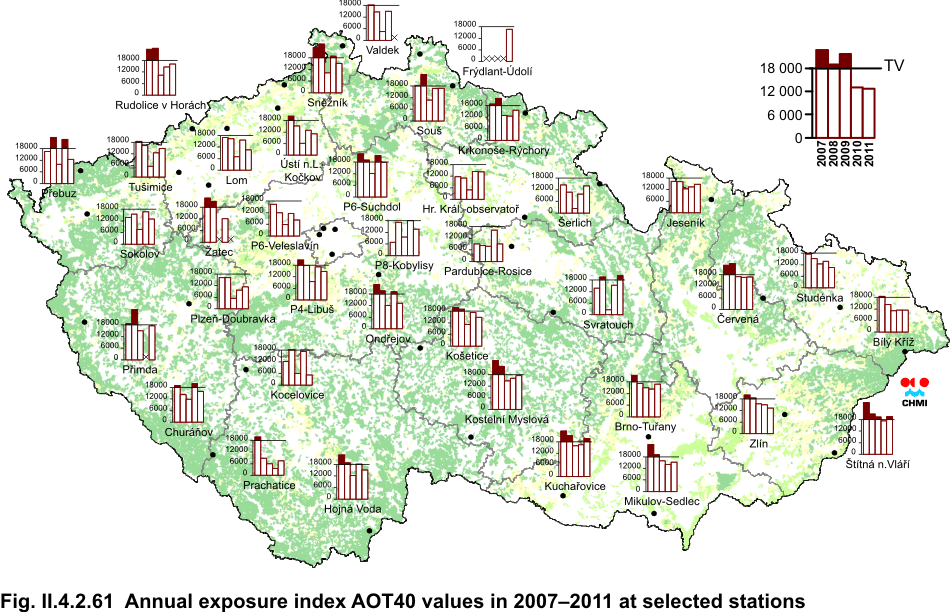
| Fig. II.4.2.61 |
Annual values of ozone exposure index AOT40 in 2007–2011 at selected
stations |
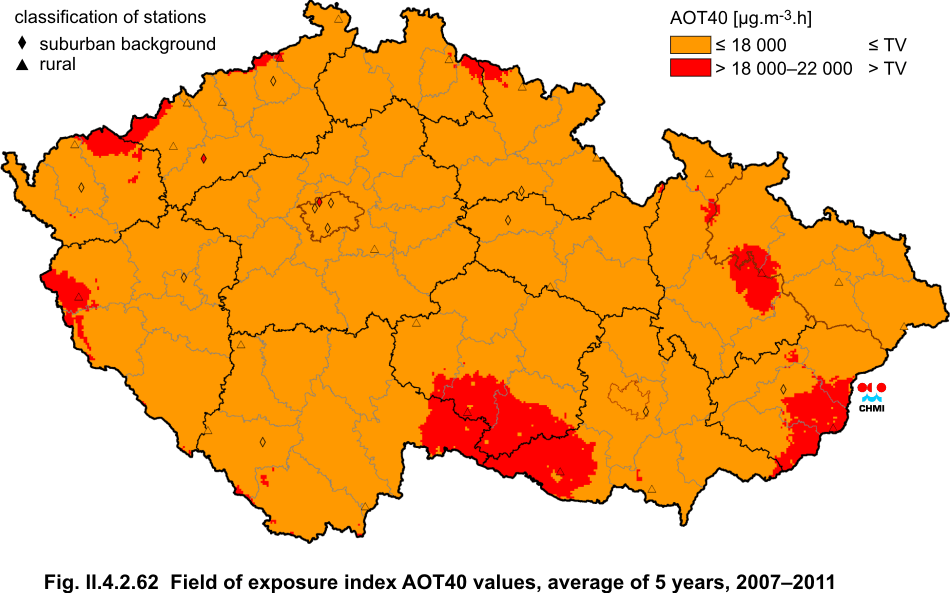
| Fig. II.4.2.62 |
Field of exposure index AOT40 values, average for 5 years, 2007–2011 |
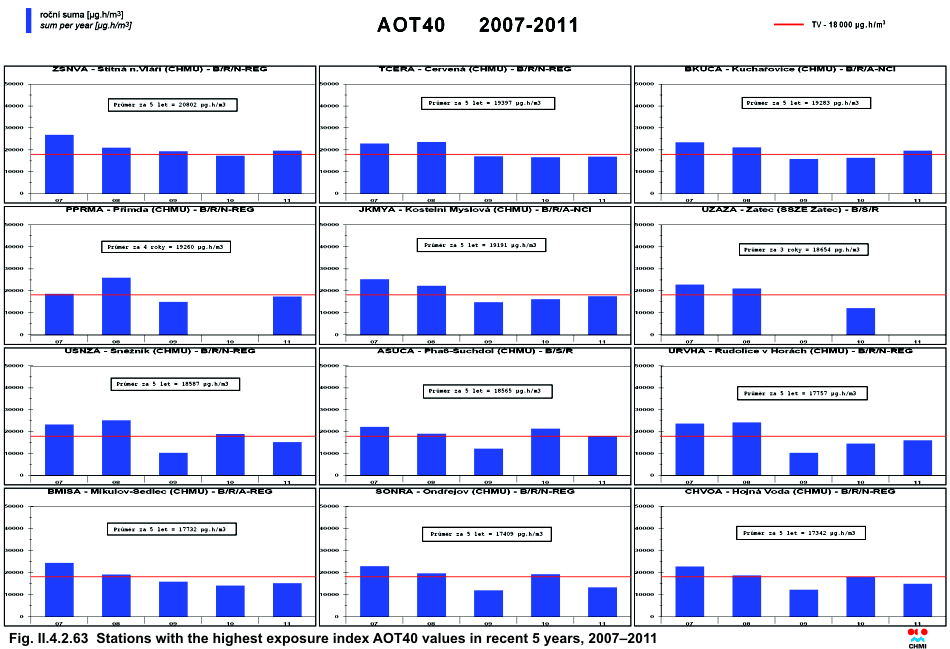
| Fig. II.4.2.63 |
Stations with the highest exposure index AOT40 values in recent 5
years, 2007–2011 |
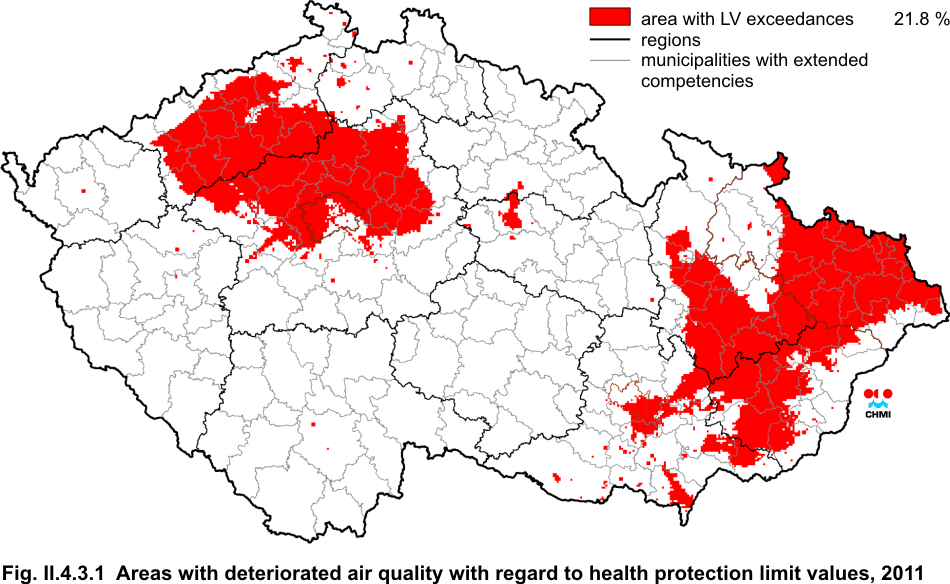
| Fig. II.4.3.1 |
Areas with exceeding of the health protection limit values, 2011 |
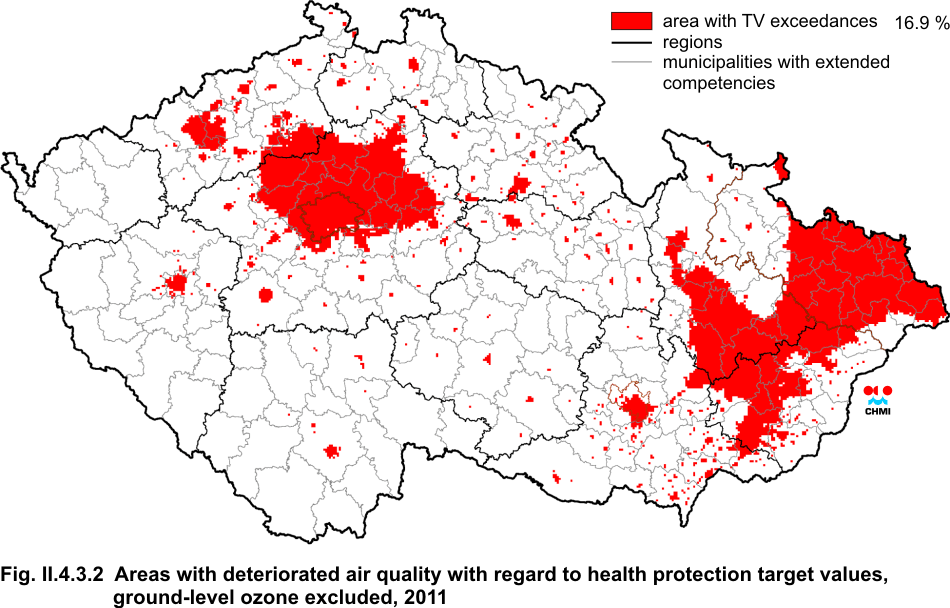
| Fig. II.4.3.2 |
Areas with exceeding of the health protection target values, ground-level
ozone excluded, 2011 |
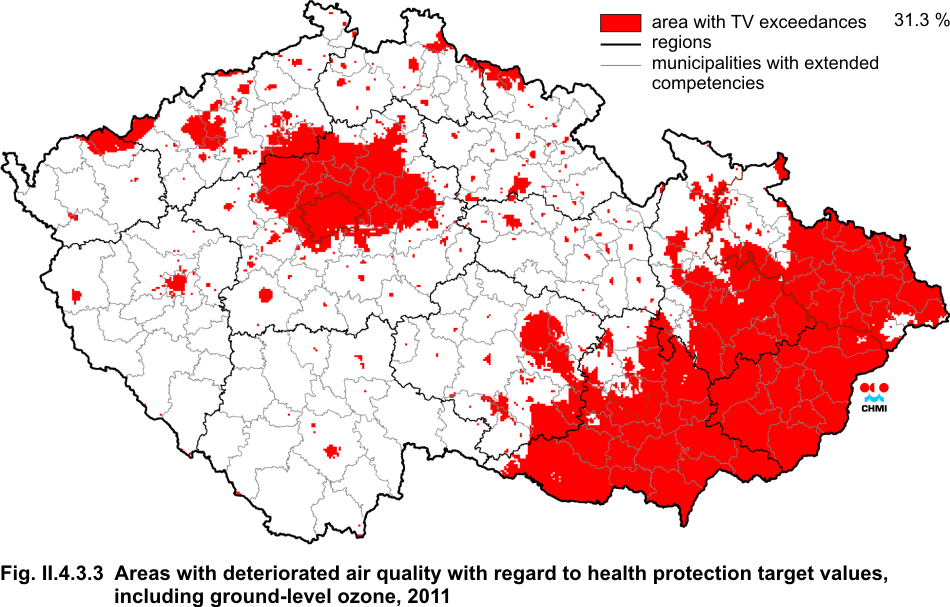
| Fig. II.4.3.3 |
Areas with exceeding of the health protection target values, incl.
ground-level ozone, 2011 |
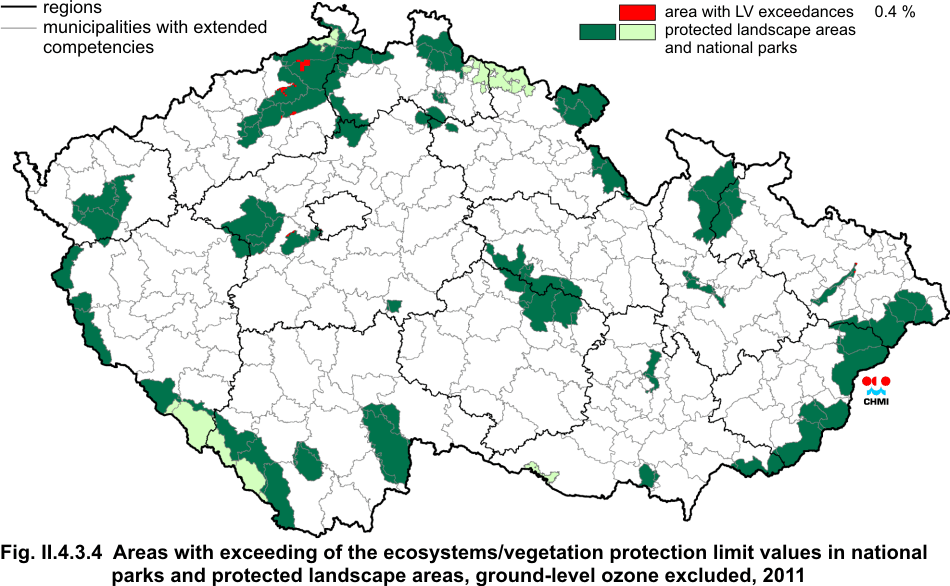
| Fig. II.4.3.4 |
Areas with exceeding of the ecosystems/vegetation protection limit
values in national parks and protected landscape areas, ground-level
ozone excluded, 2011 |
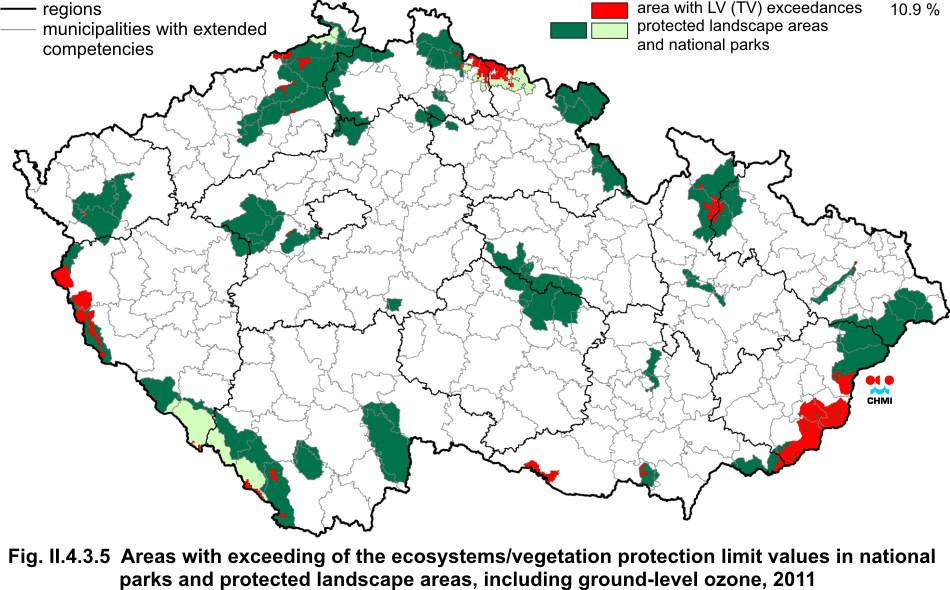
| Fig. II.4.3.5 |
Areas with exceeding of the ecosystems/vegetation protection limit
values in national parks and protected landscape areas, including ground-level
ozone, 2011 |
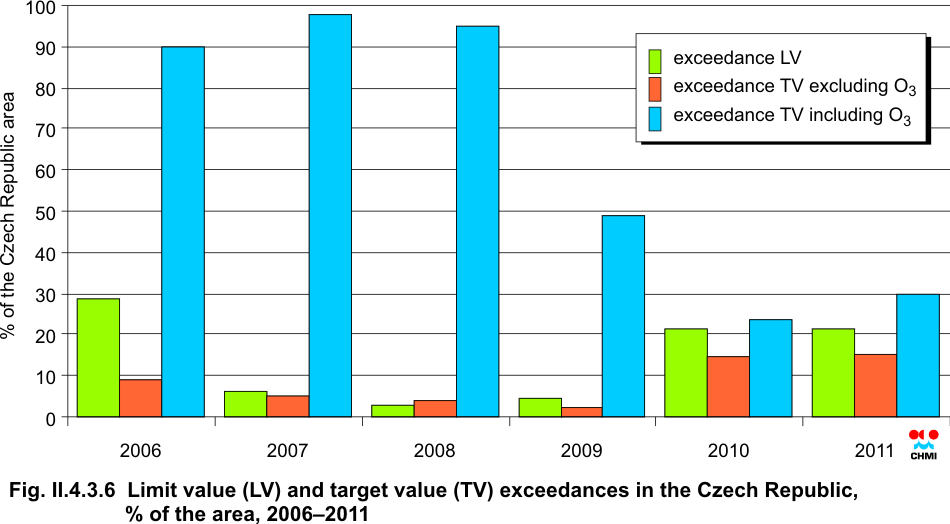
| Fig. II.4.3.6 |
Limit value (LV) and target value (TV) exceedances in the Czech
Republic, % of the area, 2006–2011 |
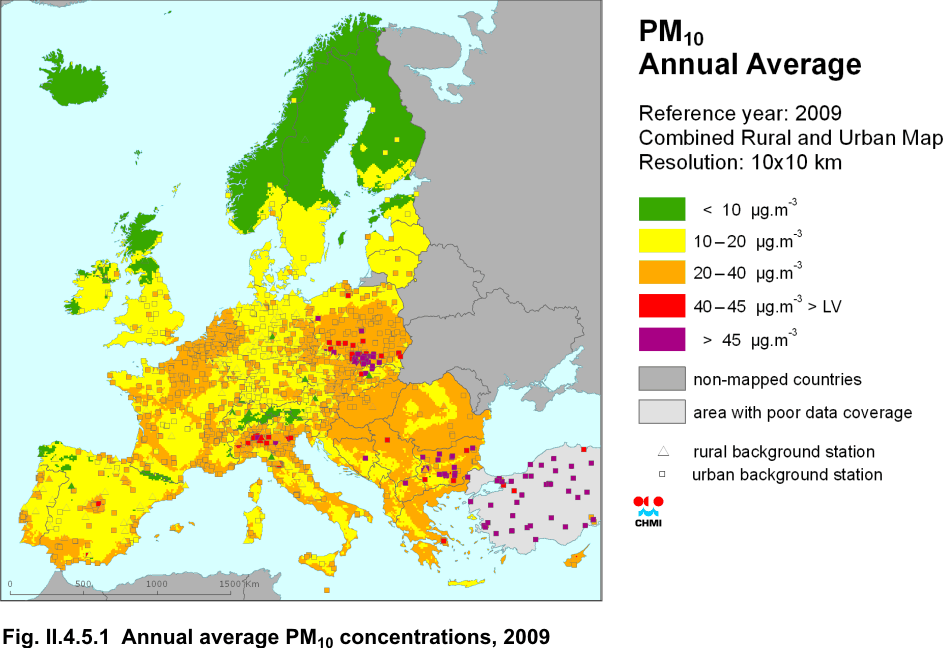
| Fig. II.4.5.1 |
Annual average PM10 concentrations, 2009 |
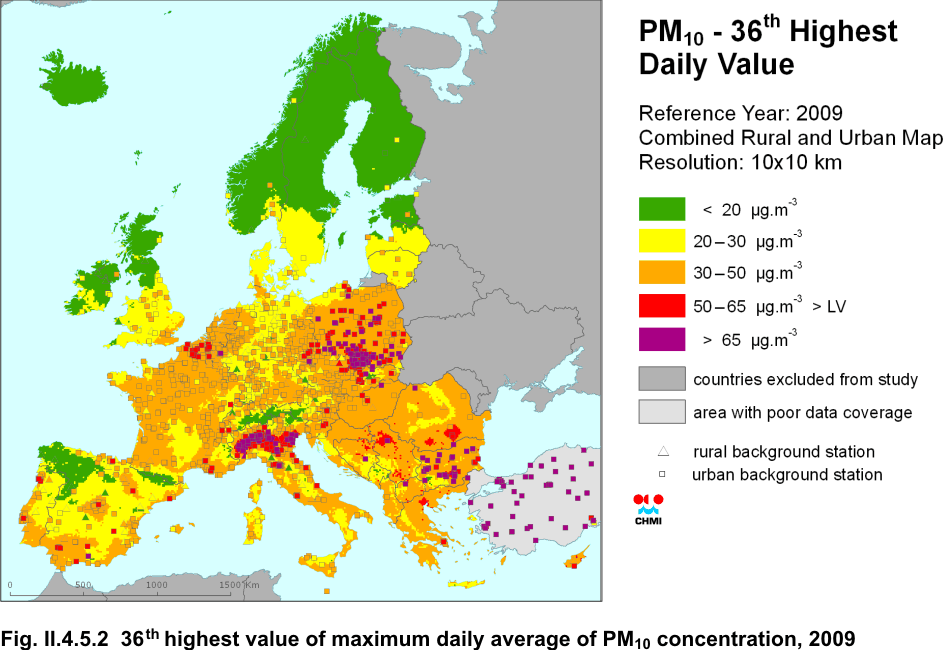
| Fig. II.4.5.2 |
36th highest value of maximum daily average of PM10 concentration,
2009 |
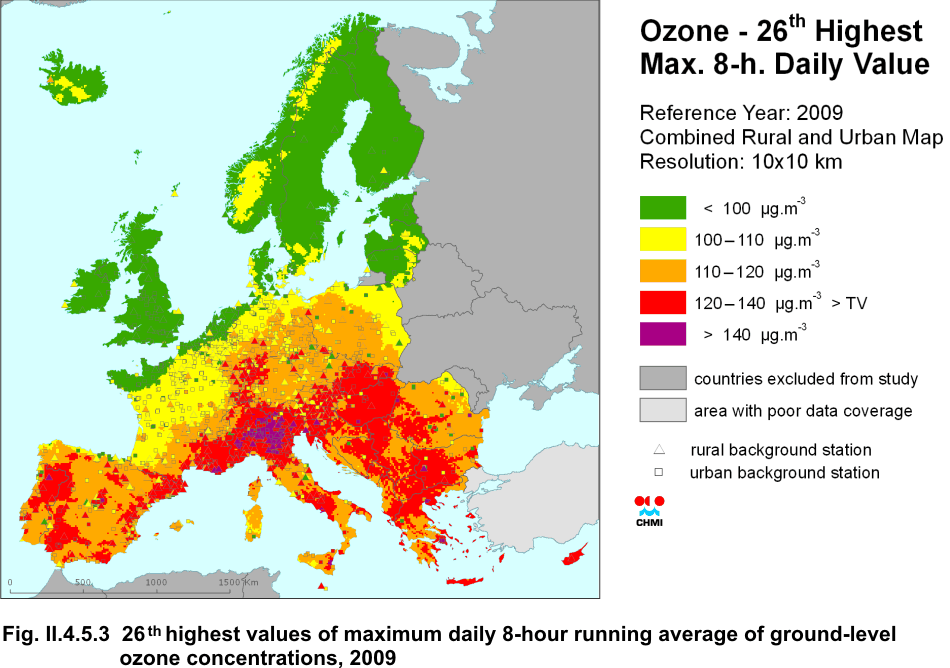
| Fig. II.4.5.3 |
26th highest value of maximum daily 8-hour running average of ground-level
ozone concentrations, 2009 |
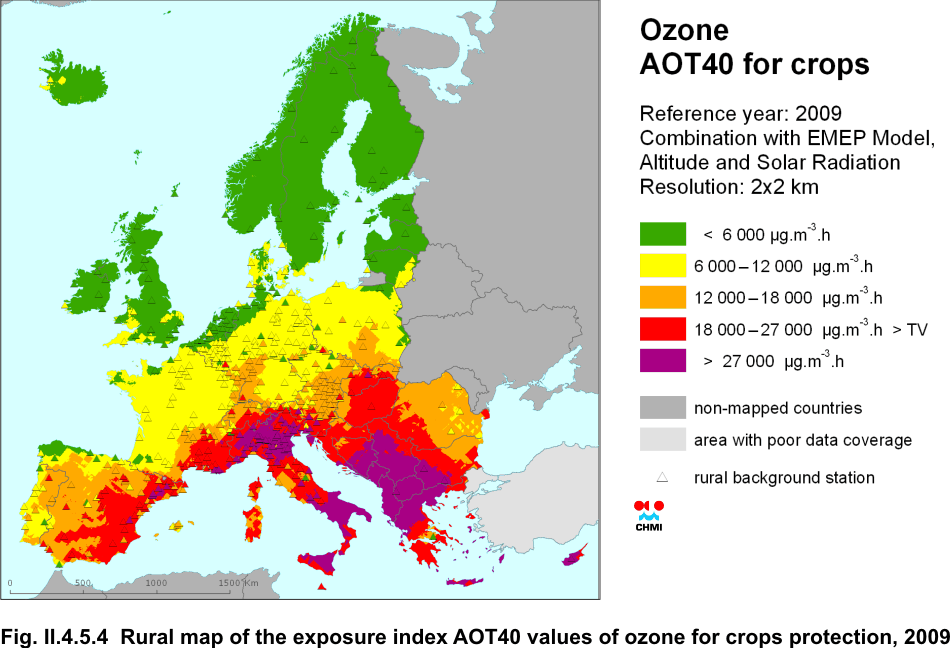
| Fig. II.4.5.4 |
Rural map of the values of ozone exposure index AOT40 for crops
protection, 2009 |
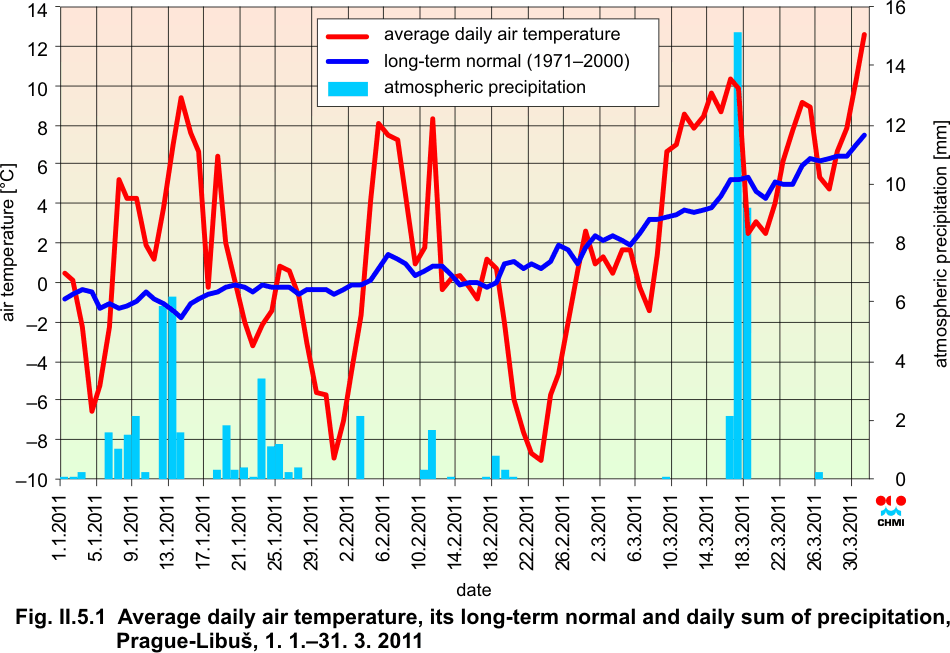
| Fig. II.5.1 |
Average daily air temperature, its long-term normal and daily sum of
precipitation, Prague-Libuš, 1.1.–31.3.2011 |
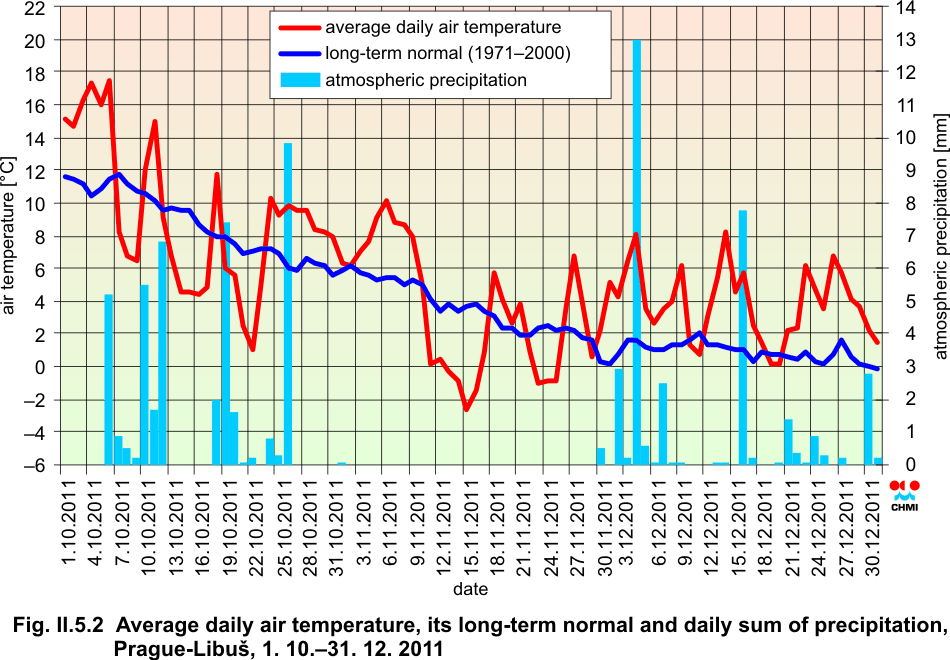
| Fig. II.5.2 |
Average daily air temperature, its long-term normal and daily sum of
precipitation, Prague-Libuš, 1.10.–31.12.2011 |
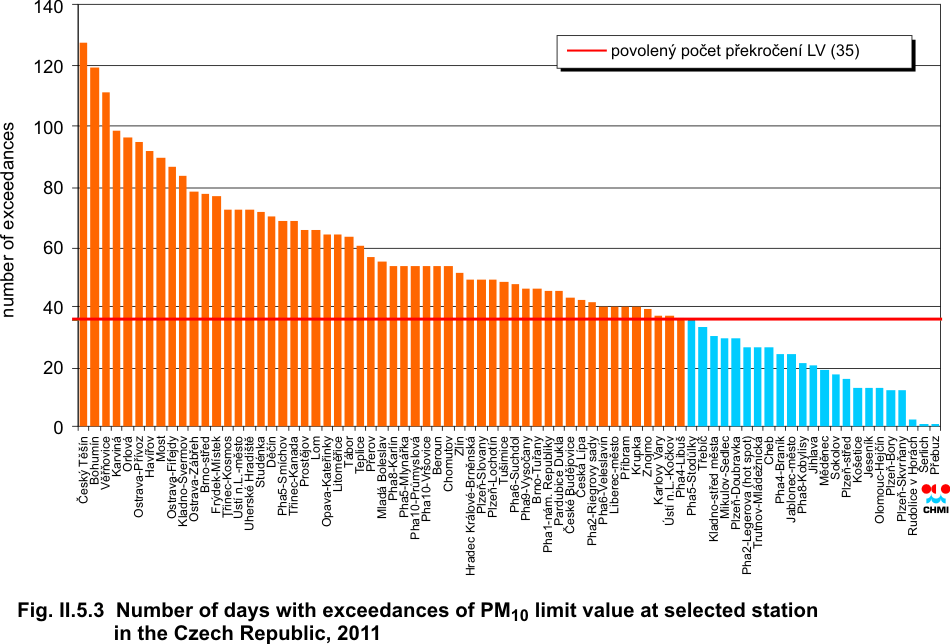
| Fig. II.5.3 |
Number of days with exceedances of PM10 limit value at selected
stations in the Czech Republic, 2011 |
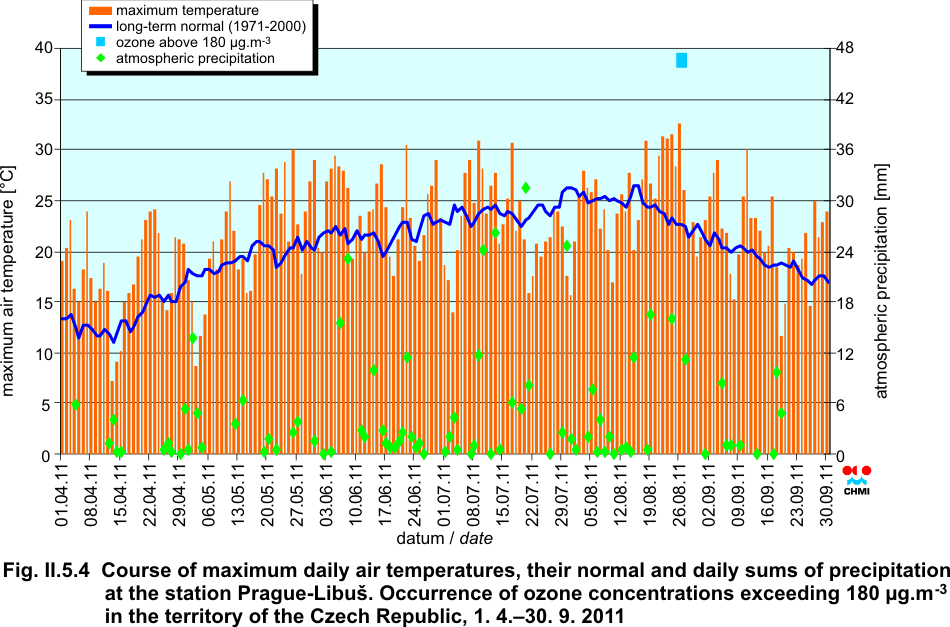
| Fig. II.5.4 |
Course of maximum daily air temperatures, their normal and daily
sums of precipitation at the station Prague-Libuš. Occurrence of ozone
concentrations exceeding 180 ÎĽg.m-3 in the territory of the Czech
Republic, 1.4.–30.9.2011 |
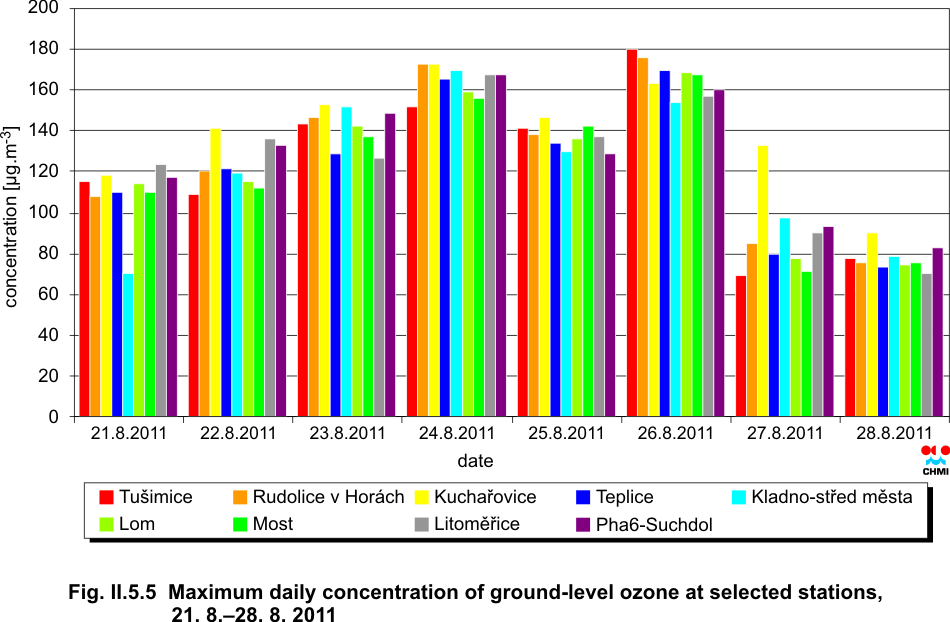
| Fig. II.5.5 |
Maximum daily concentration of ground-level ozone at selected
stations, 21.8.–28.8.2011 |
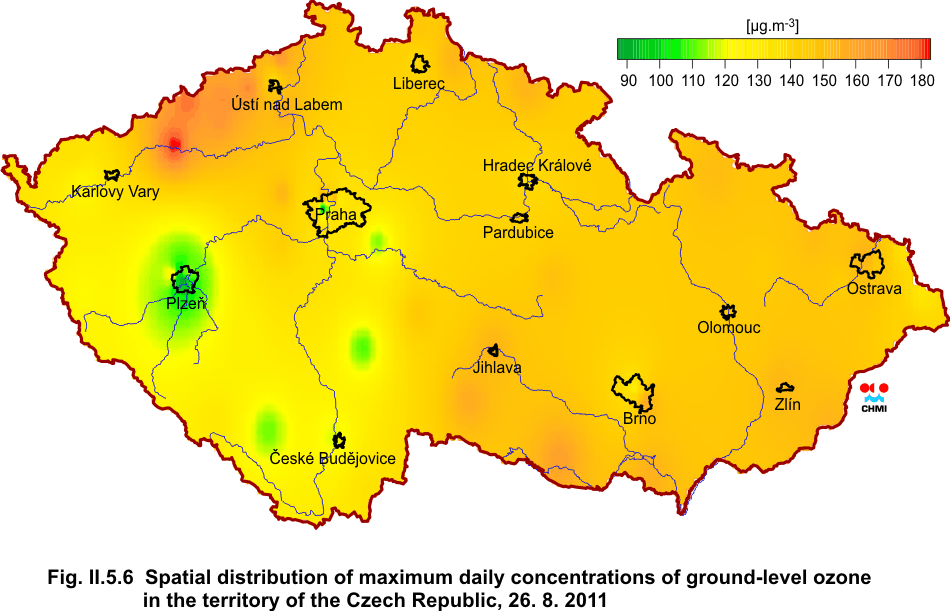
| Fig. II.5.6 |
Spatial distribution of maximum daily 1-hour concentrations of
ground-level ozone in the territory of the Czech Republic, 26.8.2011 |
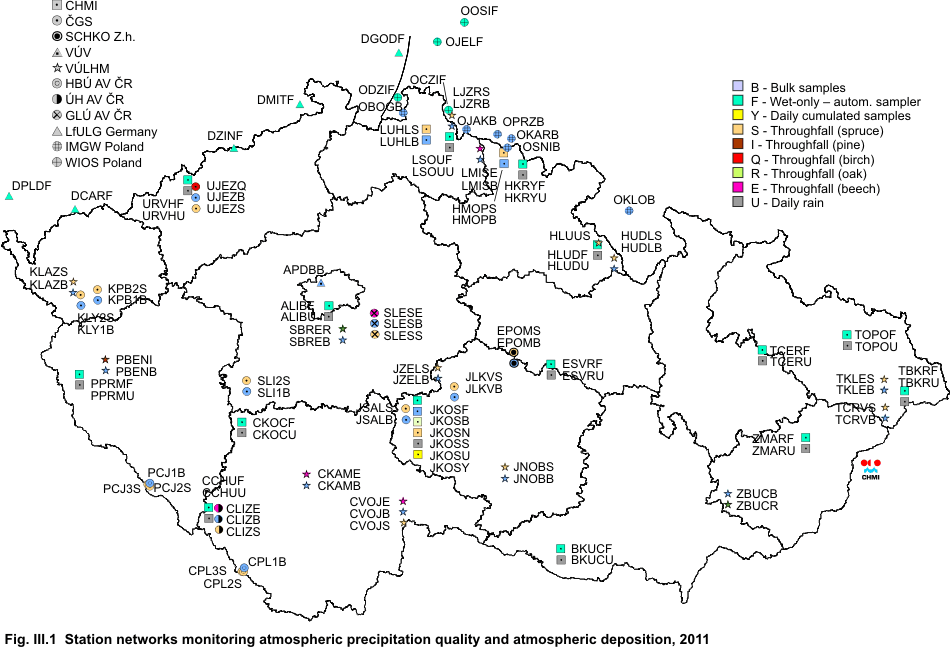
| Fig. III.1 |
Station networks monitoring atmospheric precipitation quality and
atmospheric deposition, 2011 |
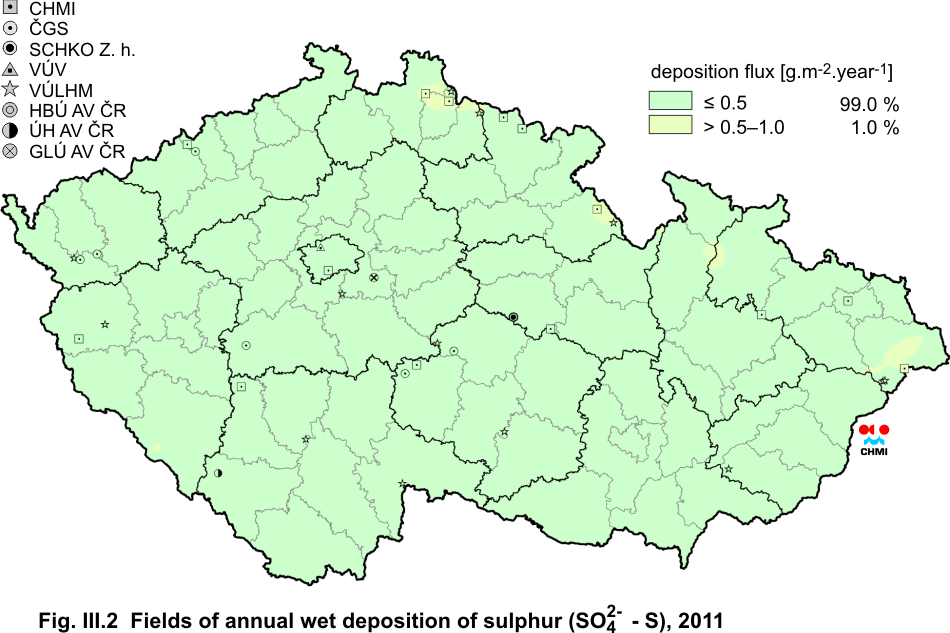
| Fig. III.2 |
Fields of annual wet deposition of sulphur (SO42- - S), 2011 |
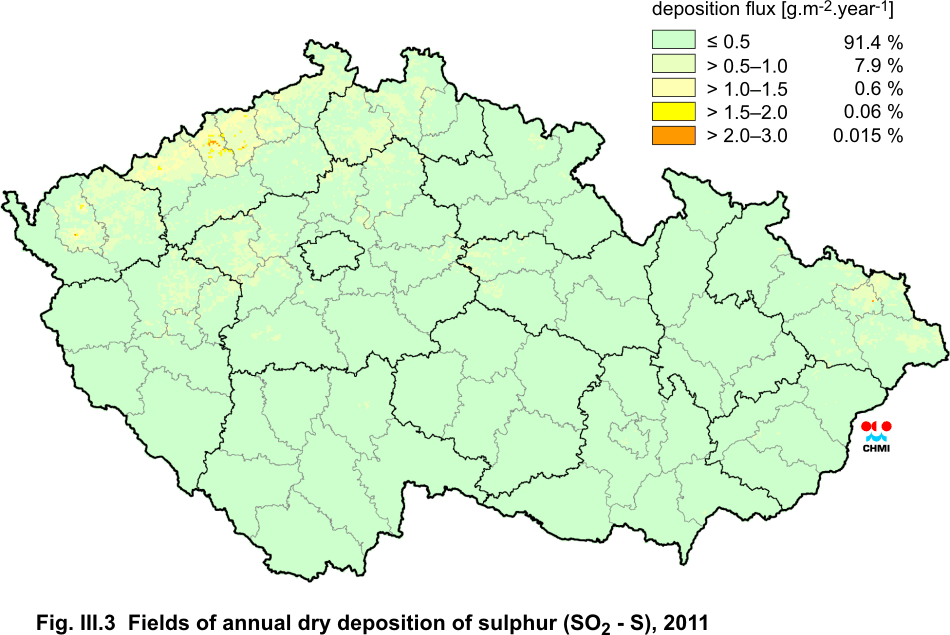
| Fig. III.3 |
Fields of annual dry deposition of sulphur (SO2 - S), 2011 |
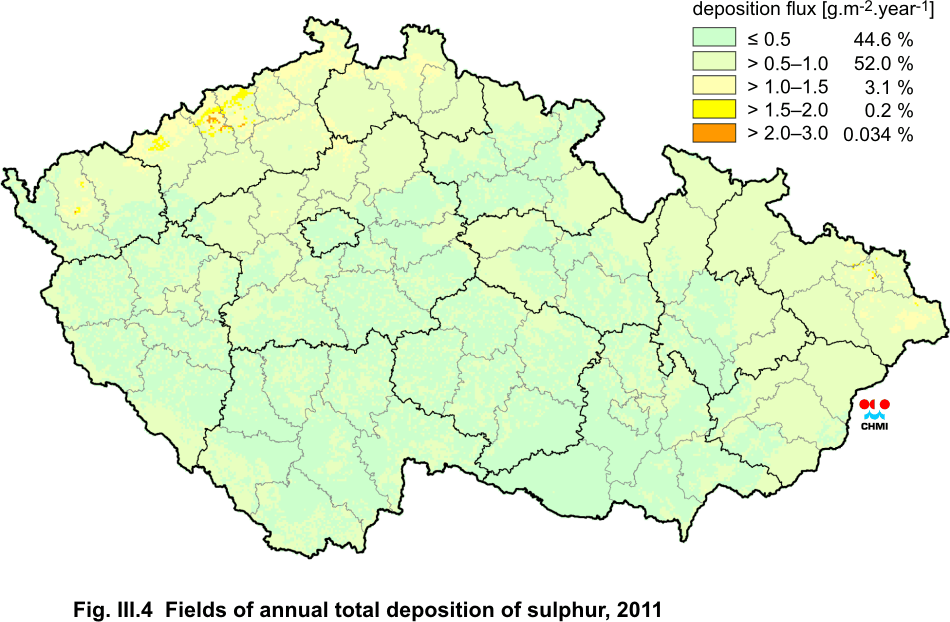
| Fig. III.4 |
Fields of annual total deposition of sulphur, 2011 |
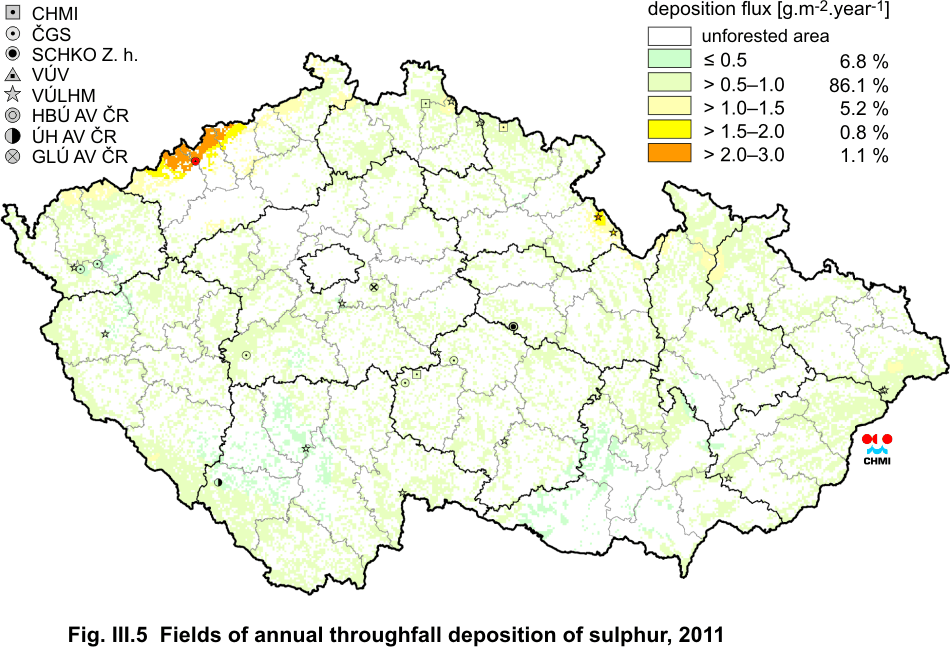
| Fig. III.5 |
Fields of annual throughfall deposition of sulphur, 2011 |
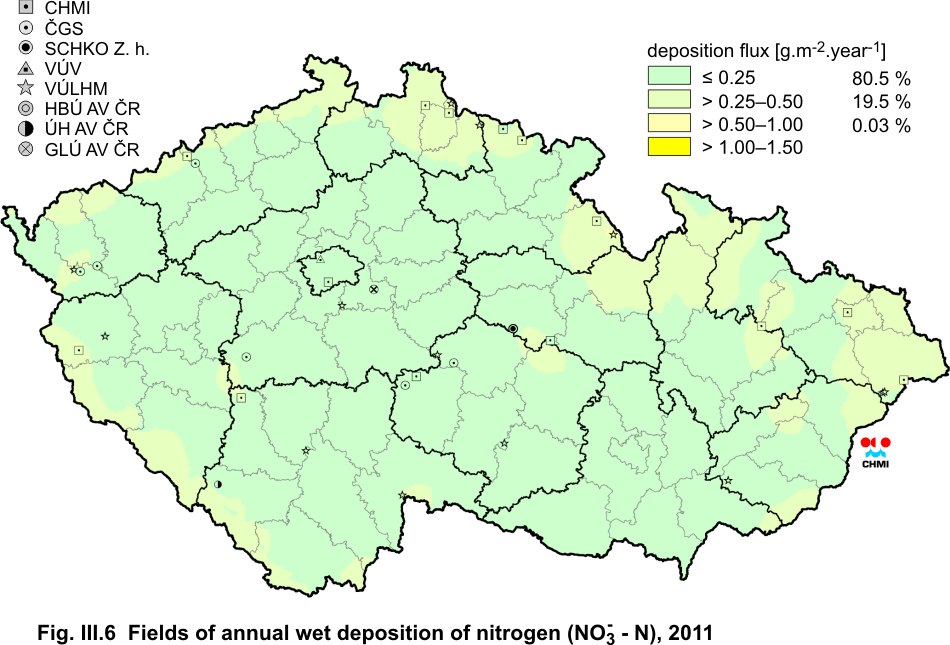
| Fig. III.6 |
Fields of annual wet deposition of nitrogen (NO3- - N), 2011 |
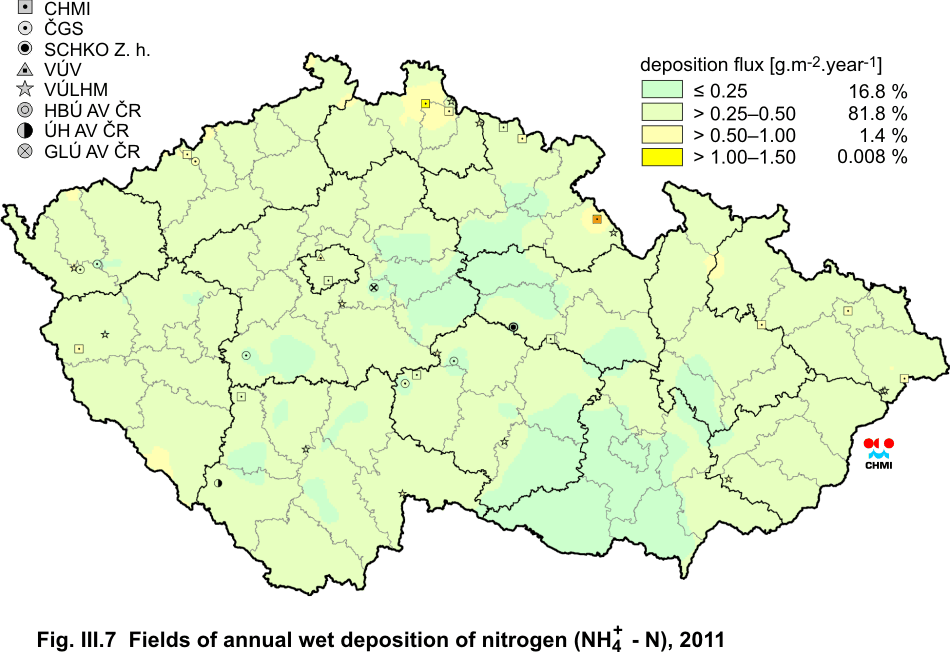
| Fig. III.7 |
Fields of annual wet deposition of nitrogen (NH4+ - N), 2011 |
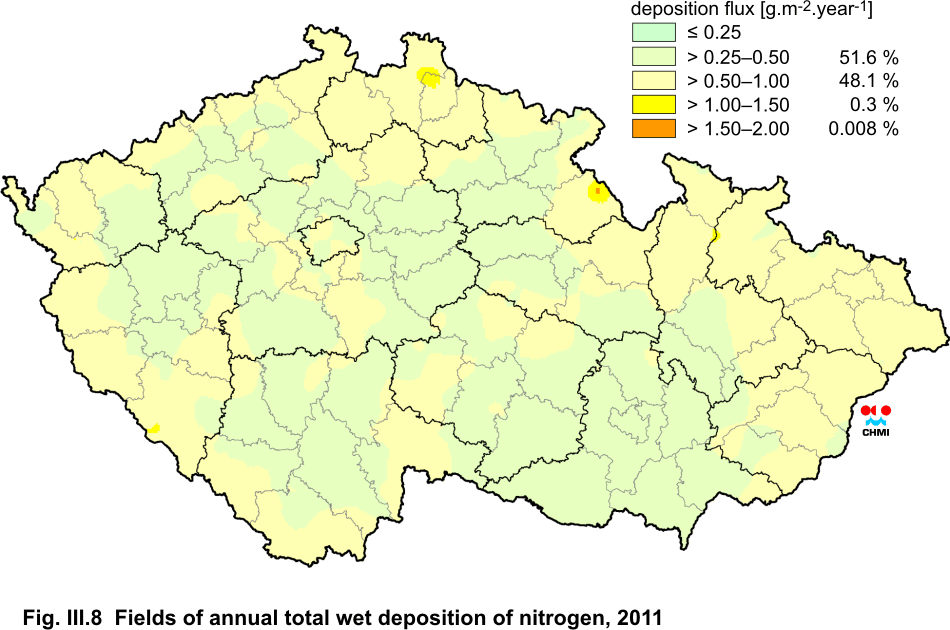
| Fig. III.8 |
Fields of annual total wet deposition of nitrogen, 2011 |
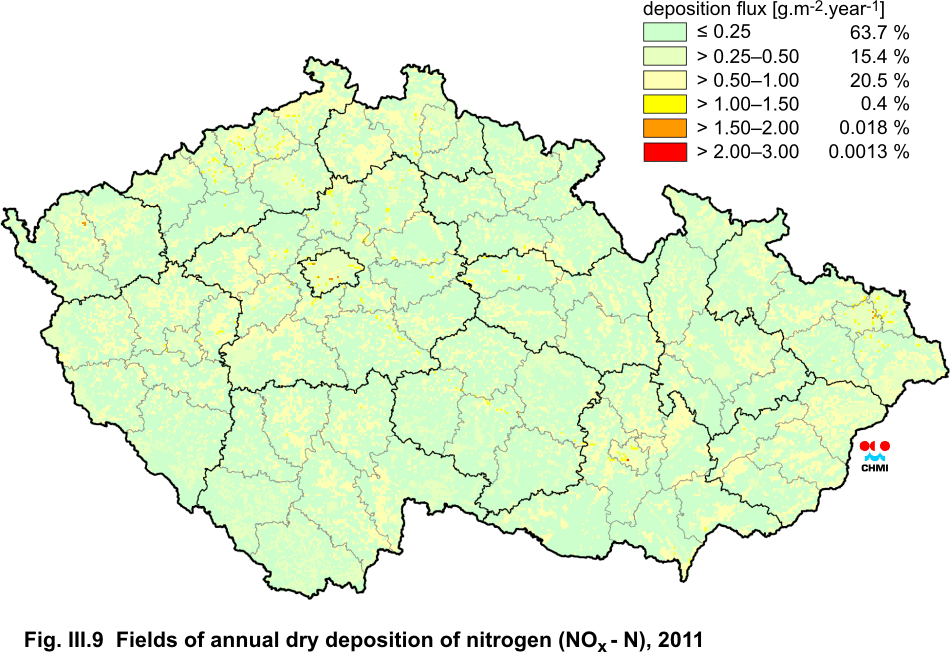
| Fig. III.9 |
Fields of annual dry deposition of nitrogen (NOx - N), 2011 |
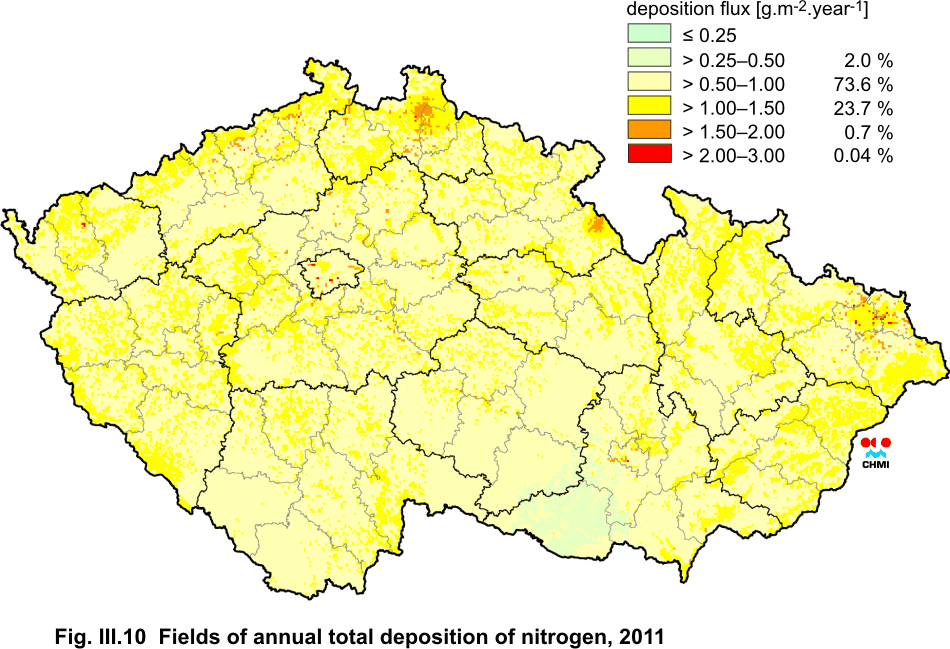
| Fig. III.10 |
Fields of annual total deposition of nitrogen, 2011 |
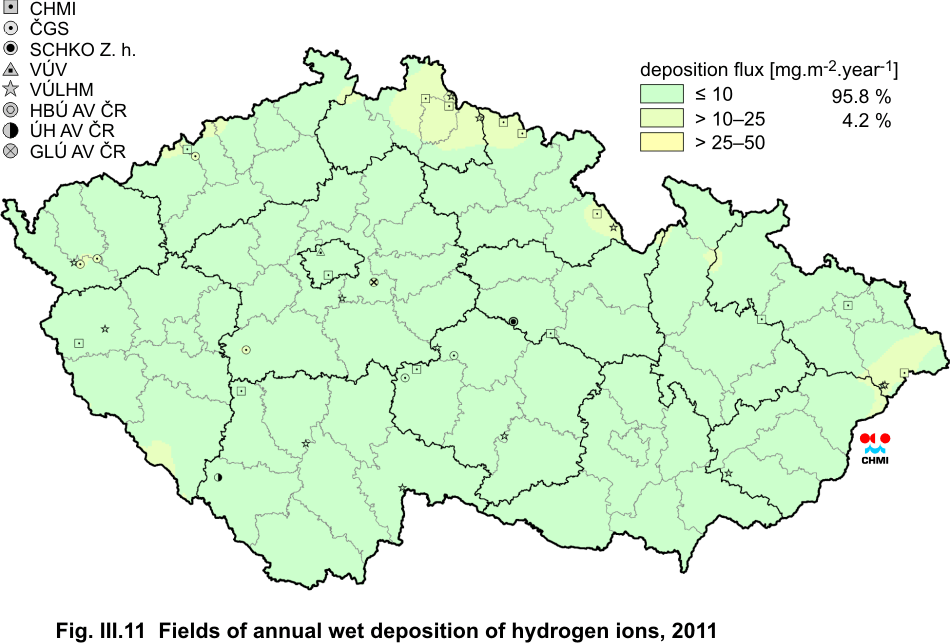
| Fig. III.11 |
Fields of annual wet deposition of hydrogen ions, 2011 |
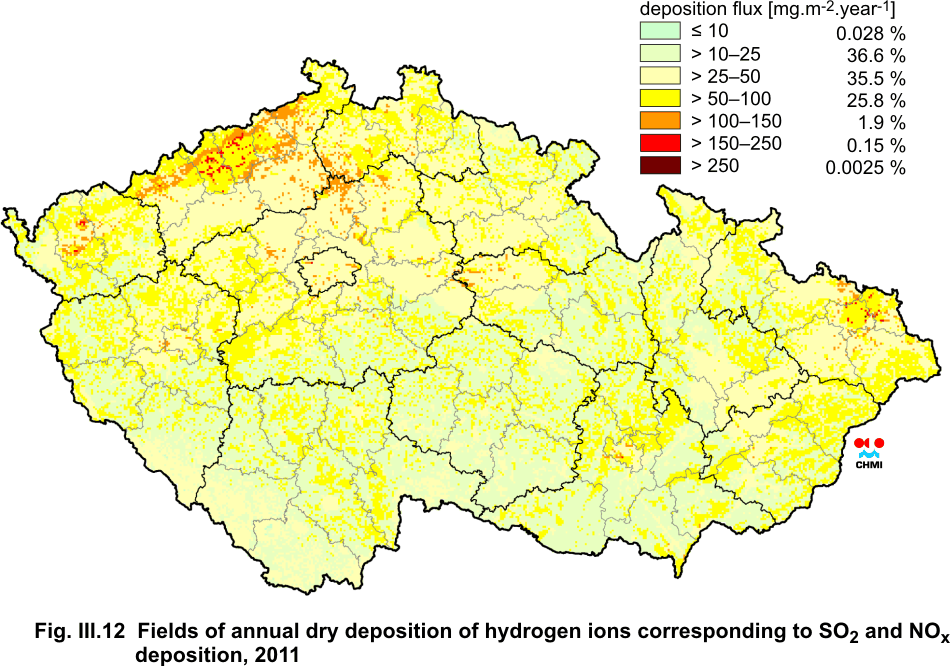
| Fig. III.12 |
Fields of annual dry deposition of hydrogen ions corresponding to
SO2 and NOx deposition, 2011 |
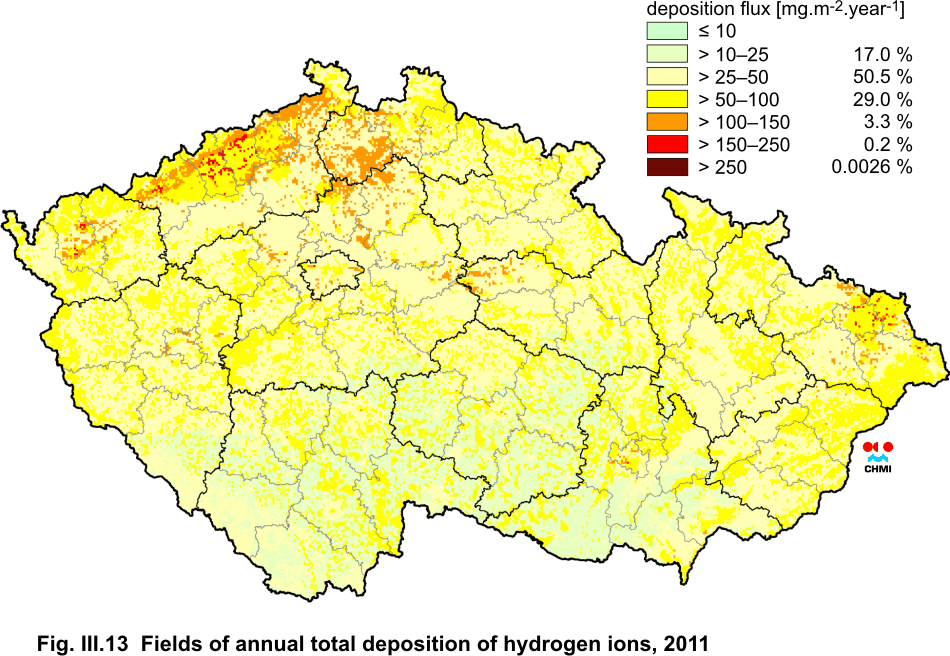
| Fig. III.13 |
Fields of annual total deposition of hydrogen ions, 2011 |
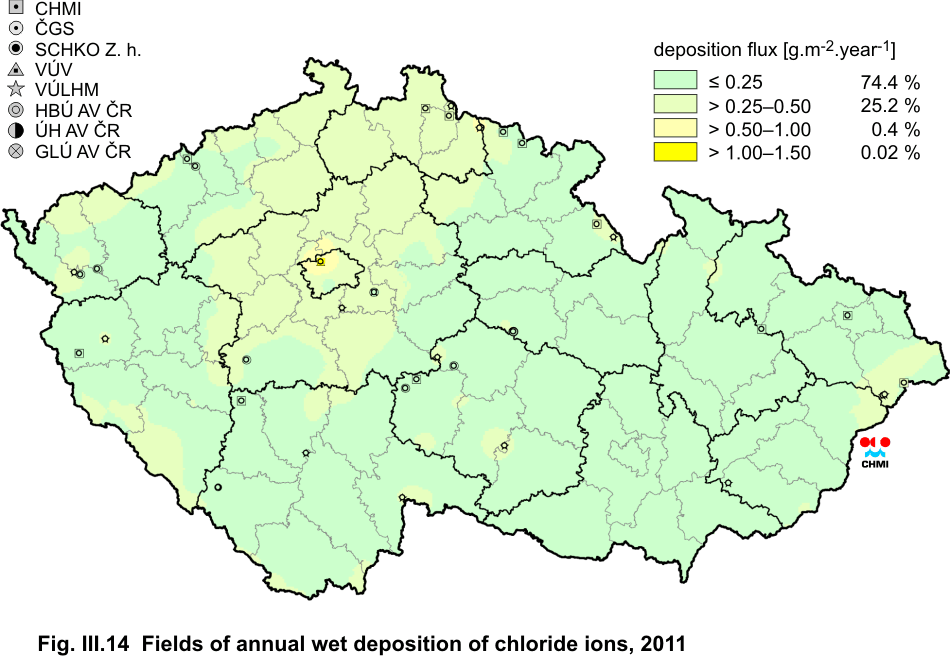
| Fig. III.14 |
Fields of annual wet deposition of chloride ions, 2011 |
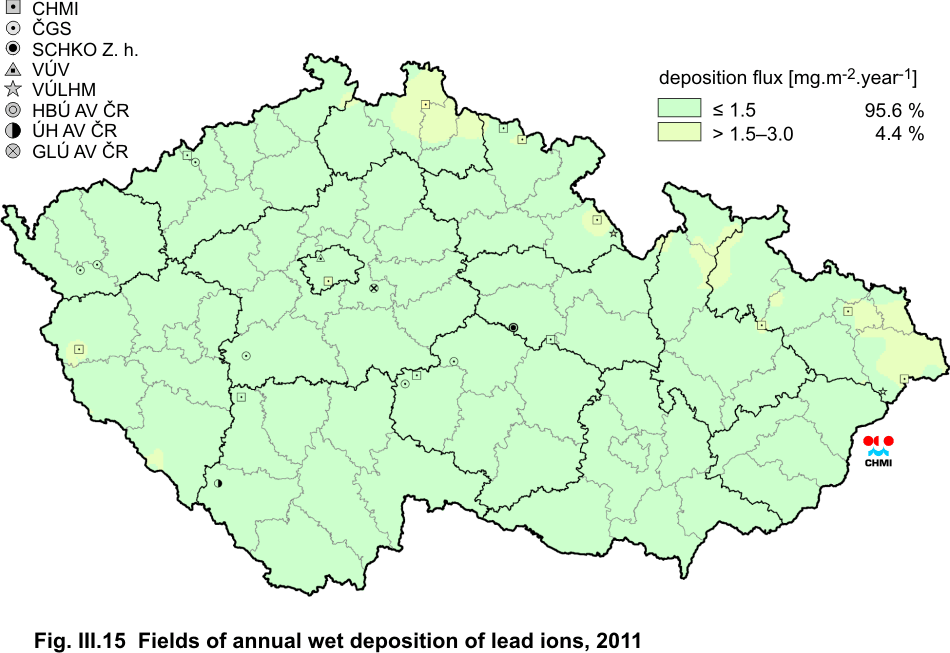
| Fig. III.15 |
Fields of annual wet deposition of lead ions, 2011 |
| Fig. III.16 |
Fields of annual dry deposition of lead, 2011 |
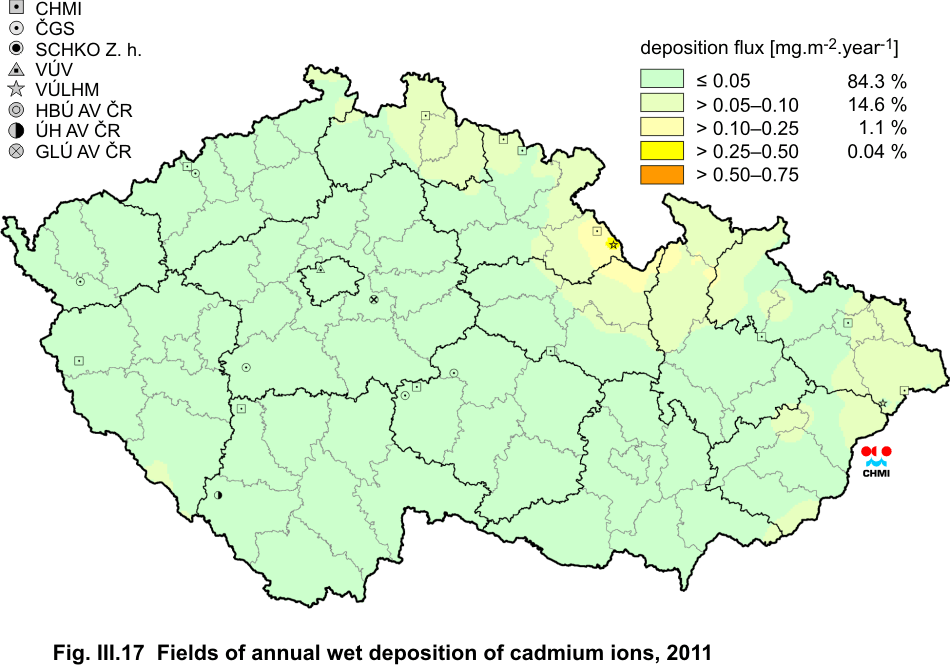
| Fig. III.17 |
Fields of annual wet deposition of cadmium ions, 2011 |
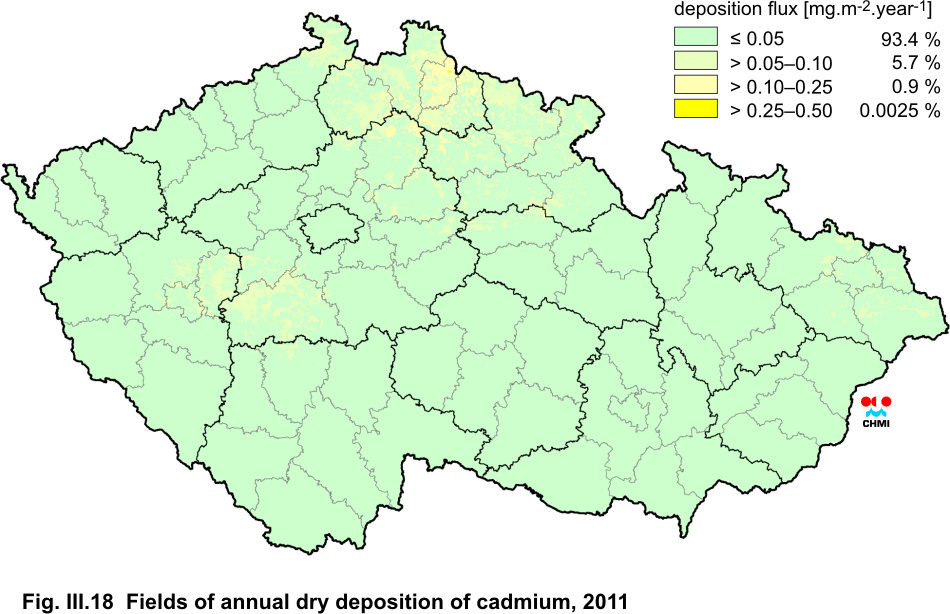
| Fig. III.18 |
Fields of annual dry deposition of cadmium, 2011 |
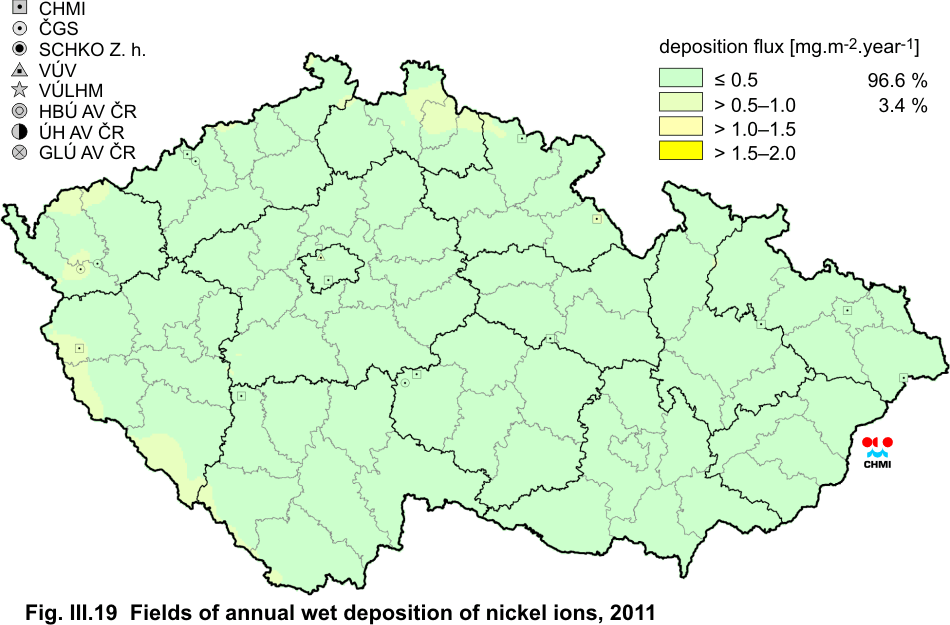
| Fig. III.19 |
Fields of annual wet deposition of nickel ions, 2011 |
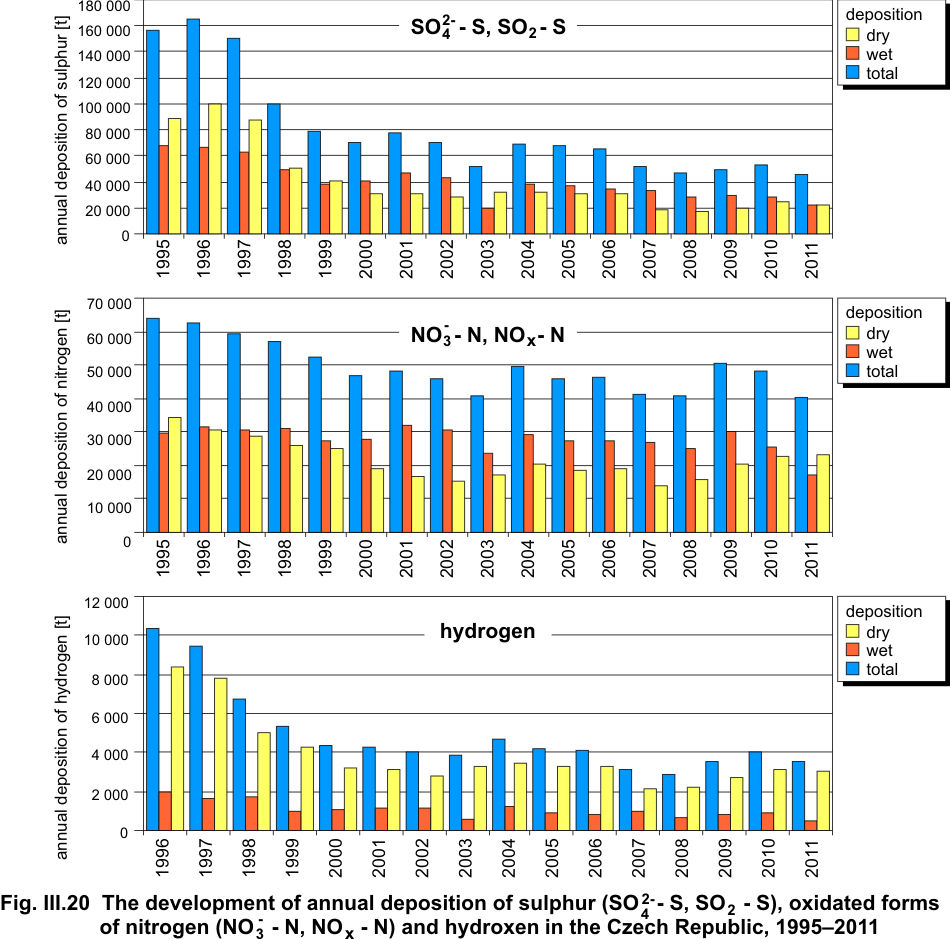
| Fig. III.20 |
The development of annual deposition of sulphur (SO42-–S, SO2–S) and oxidated forms of nitrogen (NO3-–N, NOx–N) and hydrogen in the Czech
Republic, 1995–2011 |
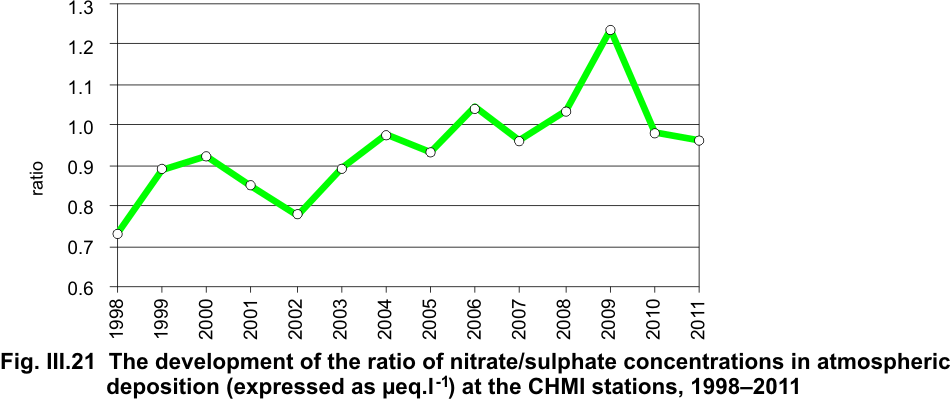
| Fig. III.21 |
The development of the ratio of nitrate/sulphate concentrations in
atmospheric deposition (expressed as ÎĽeq. l-1) at the CHMI stations,
1998–2011 |
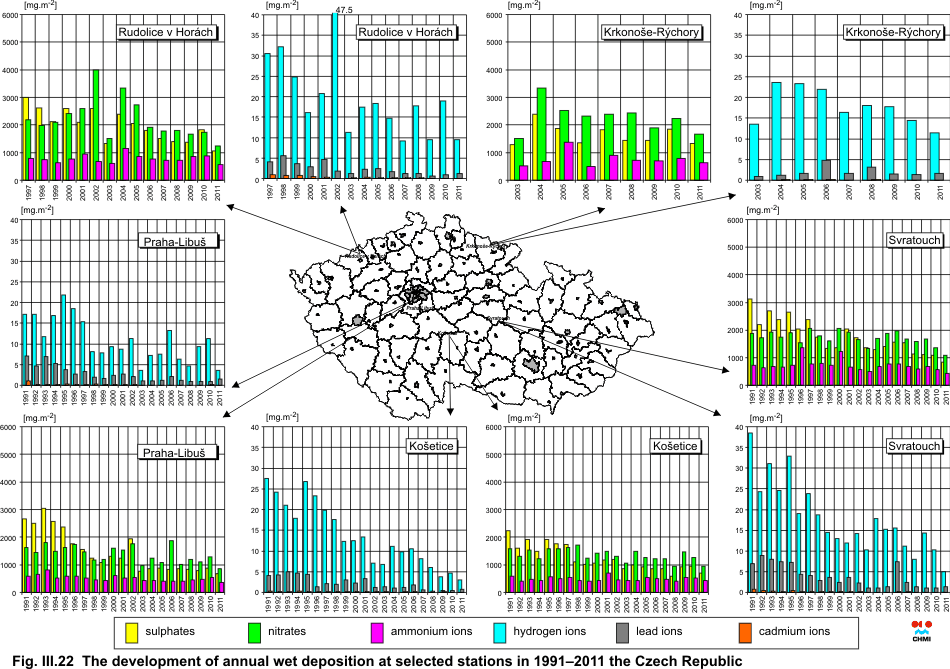
| Fig. III.22 |
The development of annual wet deposition at selected stations in
1991–2011, Czech Republic |