| AIR POLLUTION IN THE CZECH REPUBLIC IN 2011 Czech Hydrometeorological Institute - Air Quality Protection Division |
|
|
|
|
|
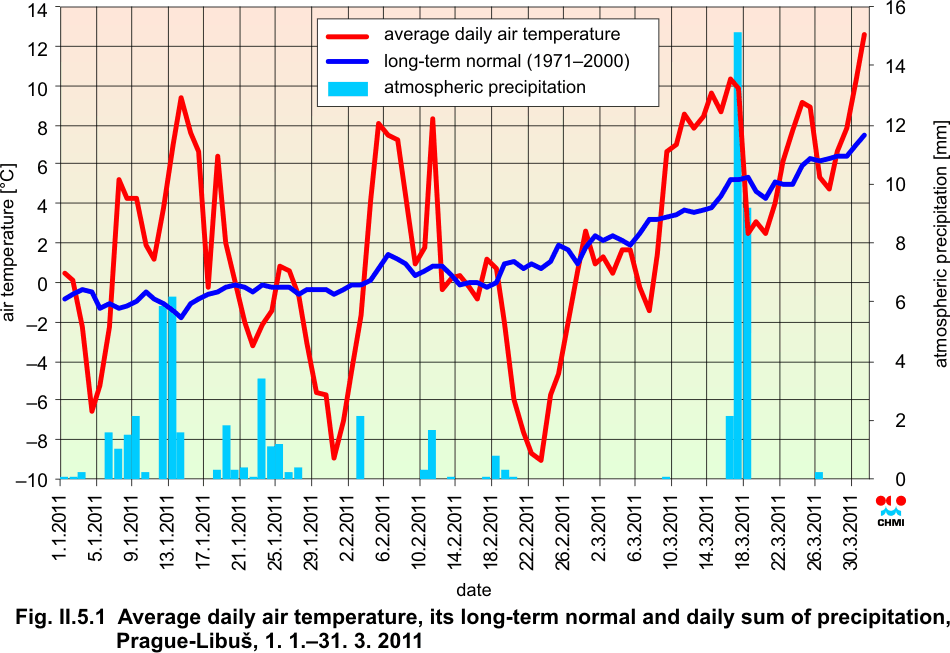
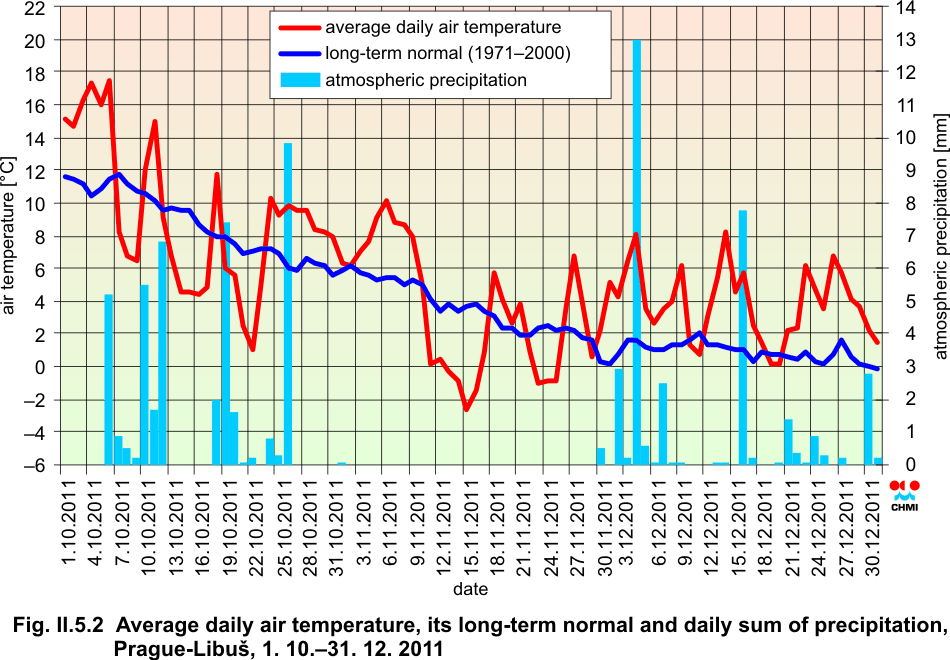
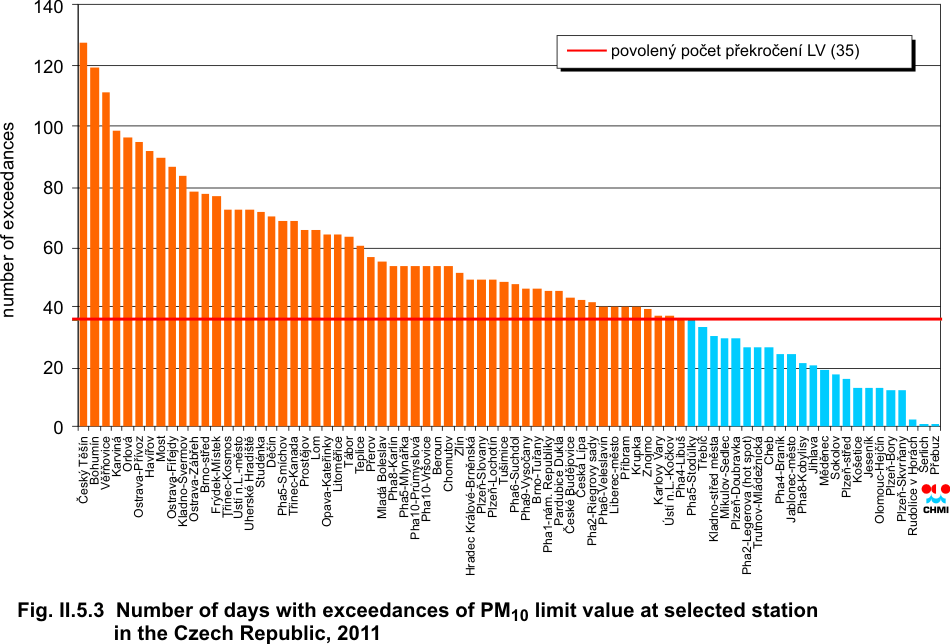
II.5 Evaluation of the smog regulation systems operation on the territory of the Czech Republic in 201 1The first three months of the year 2011 were normal in terms of temperature in the Czech Republic and the last three months of the year 2011 were significantly different. In January 2011 the average monthly temperature was ŌĆō1.2 ░C with the deviation from the normal 1.6 ░C, the month of February with the average monthly temperature ŌĆō2.0 ░C recorded the deviation from the normal ŌĆō0.9 ░C and March with the average monthly temperature 3.8 ░C had the deviation from the normal 1.3 ░C. The months of October and November were normal as concerns temperatures, the average monthly temperature in October was 7.8 ░C, in November 2.5 ░C; the deviation from the normal was the same in both months, and namely ŌĆō0.2 ░C. December with the temperature 1.9 ░C was strongly above the normal with the deviation from the normal 2.9 ░C. The year 2011 as a whole with the average annual temperature 8.5 ░C and the deviation 1.0 ░C was above the normal. In terms of precipitation, the monthly totals of July, December and October 2011 were above the normal (184 %, 116 % and 105 %, respectively), the months of November and February were subnormal with the monthly totals 1 mm and 10 mm, which represents 2 % and 27 %, respectively. The highest precipitation for the whole year 2011 was recorded in the Plze┼ł Region and in the Karlovy Vary Region (104 % and 103 %, respectively) and the lowest precipitation was recorded in the Zl├Łn Region (80 %). The annual average total for the whole Czech Republic was 627 mm, which represents 93 %. According to the results of the Prague-Libu┼Ī station measured from 1.1 to 31.3.2011 the average daily temperatures significantly fluctuated around the long-term normal; on 7 and 8 January 2011 they were markedly above the normal, with the deviations 4.8 ░C and 11.2 ░C, respectively, in the period 4ŌĆō12 February 2011 with the maximum deviation 7.4 ░C and from 9 to18 March 2011 with the maximum deviation 5.8 ░C. Significantly below-the-normal daily temperatures were recorded in the period 28.1.ŌĆō2.2.2011 with the maximum deviation from the normal ŌĆō8.3 ░C and in the period 19.ŌĆō26.2.2011 with the maximum deviation ŌĆō9.8 ░C. From 1.10. to 31.12.2011 there were recorded two periods longer than four days with the temperature deviation from the normal: 1ŌĆō6 October with the maximum deviation 6.8 ░C and 23ŌĆō29 December with the maximum deviation 5.9 ░C. The period from 11 to 17 November was significantly below the normal with the maximum deviation ŌĆō6.3 ░C. Significant precipitation was recorded in the following periods: 6.ŌĆō14.1. with 20.1 mm, 16.ŌĆō18.3. with 26.4 mm, 6.ŌĆō12.10. with 20.8 mm, 18.ŌĆō26.10. with 22.2 mm and 2.ŌĆō7.12. with 19.3 mm. The lowest precipitation, only 0.6 mm, was recorded from 27.10. to 1.12.2011 (Figs. II.5.1, II.5.2). Anticyclonic situations occurred during the periods JanuaryŌĆōMarch and OctoberŌĆōDecember 2011 in 50 % of cases and their relative frequency for the above months was markedly unsteady; it ranged from 5 to 97 %. The highest relative frequency of anticyclonic situations (97 %) was recorded in November 2011, in March (61 %) and in February (54 %). In December 2011 the anticyclonic situation was recorded in 5 % and in October 2011 in 17 % of cases. The anticyclonic situation in November 2011 caused unfavourable dispersion conditions resulting in high concentrations of suspended PM10.particles. The serious problem concerning air quality throughout the whole territory of the Czech Republic is caused by the occurrence of high concentrations of suspended particles of PM10 fraction. During the year 2011 55 stations of the total number of 78 AIM CHMI measuring localities (i.e. 70.5 %) exceeded the daily limit value for PM10 50 ╬╝g.m-3, which may be exceeded only 35x during the year as the maximum (Fig. II.5.3). In relation to high PM10 concentrations and the duration there occurred three periods: from 27.1. to 3.2.2011, from 15.2. to 6.3.2011 and from 13.11. to 25.11.2011; in the Ostrava-Karvin├Ī area the last period started already on 31.10.2011. The highest number of days with the Warning and Regulatory signals were issued in the Ostrava-Karvin├Ī area, and namely 61 days, in the T┼Öinec area 37 days, in the ├Üst├Ł nad Labem Region 41 days, in the Pardubice Region 15 days and in the Central Bohemian Region 9 days. The Ostrava-Karvin├Ī area and the T┼Öinec area recorded more than double number of days with the above signals for the period JanuaryŌĆōMarch than in the months OctoberŌĆōDecember. The Central Bohemian Region recorded more than double number of days for the period OctoberŌĆōDecember. In the Pardubice Region the proportion of days was approximately equal. The number of the issued signals and the number of days with the signals Warning and Regulation are presented in Table II.5.1. The overview of the issued signals of Warning and Regulation in the year 2011 is presented in Table II.5.2. Synoptic situation from 17 February to 5 March 2011 On 17 February 2011 the weather above the territory of the Czech Republic was influenced by the marginal cyclone of 995 hPa with the centre above southern France. The anticyclone of 1035 hPa with the centre above Finland moved on the following days first southwards and then eastwards and from 20 February its centre 1030 hPa was above the Urals and its southwestern edge reached the territory of the Czech Republic. From 21 February its centre 1040 hPa was located southeast of Moscow and it intensified to 1055 hPa. The anticyclone blocked the passage of frontal disturbances to the central Europe till 26 February. On 27 February a weak occluded front passed the territory of the Czech Republic and till 4 March the weather was influenced alternately by the cyclone over Corsica and the ridge of high pressure stretching from the Carpathian area up to the eastern Atlantic. On 6 March there occurred the marked change when in the rear of the cyclone of 980 hPa with the centre southeast of Arkhangelsk, cold front spread into the central Europe and broke the ground-level temperature inversion. Synoptic situation from 12 to 21 November 2011 On 12 November 2011 the weather above the territory of the Czech Republic was influenced by the extensive anticyclone of 1035 hPa with the centre above Finland and the Carpathians and in its rear warm air flowed to the territory of the Czech Republic. On the following days the centre of the anticyclone was located above the Ukraine and the ridge of higher pressure stretched up to the North Sea. On 14 November the anticyclone was formed above the North Sea and on the following days the decaying cold front spread along its front end to the central Europe on 16 November which resulted in temporary improvement of dispersion conditions. The centre of the anticyclone 1030 hPa moved on above the Ukraine and on 21 November the mentioned anticyclone was above the southeastern Europe. After the temporary improvement of dispersion conditions on 16 November the conditions slightly deteriorated again which lasted till the end of the month. For the most part of this period temperature inversions were formed, mainly in the morning hours; in the 12/13 November night the marked temperature inversion occurred stretching from the ground, when the temperature in the altitude 304 m reached ŌĆō2.2 ░C and in the altitude 1409 m 9.0 ░C, (γ =ŌĆō1.0 ░C/100 m). Tab. II.5.2 The issued warning and regulatory signals in the territory of the Czech Republic in 2011
Fig. II.5.1 Average daily air temperature, its long-term normal and daily sum of precipitation, Prague-Libu┼Ī, 1.1.ŌĆō31.3.2011
Fig. II.5.2 Average daily air temperature, its long-term normal and daily sum of precipitation, Prague-Libu┼Ī, 1.10.ŌĆō31.12.2011
Fig. II.5.3 Number of days with exceedances of PM10 limit value at selected stations in the Czech Republic, 2011
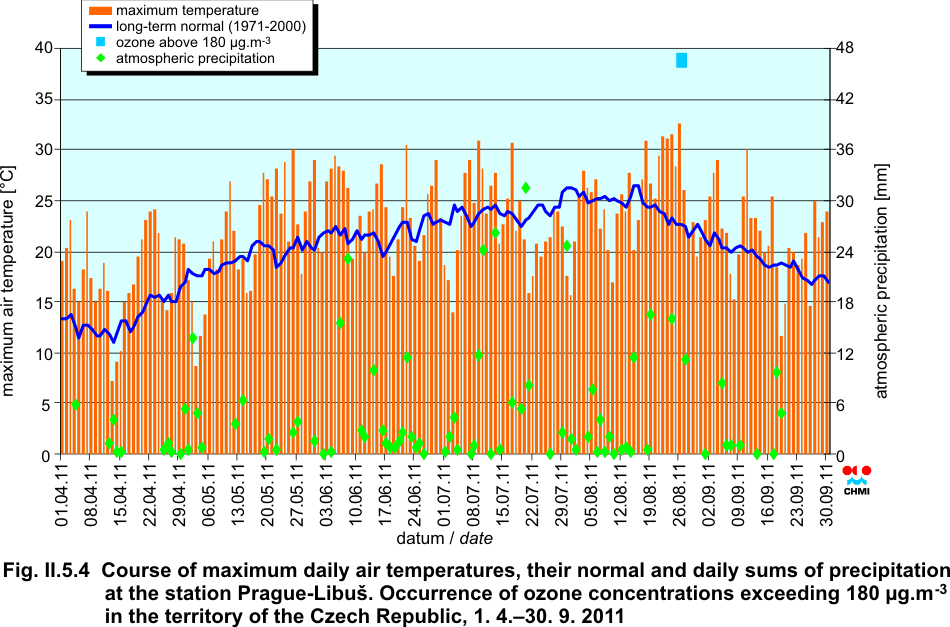
Fig. II.5.4 Course of maximum daily air temperatures, their normal and daily sums of precipitation at the station Prague-Libu┼Ī. Occurrence of ozone concentrations exceeding 180 ╬╝g.m-3 in the territory of the Czech Republic, 1.4.ŌĆō30.9.2011
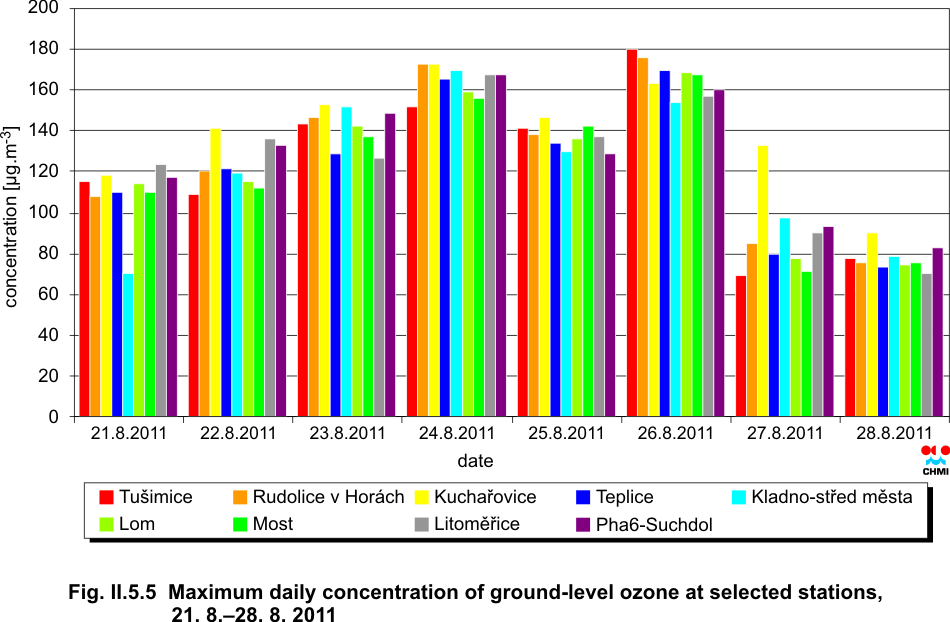
Fig. II.5.5 Maximum daily concentration of ground-level ozone at selected stations, 21.8.ŌĆō28.8.2011
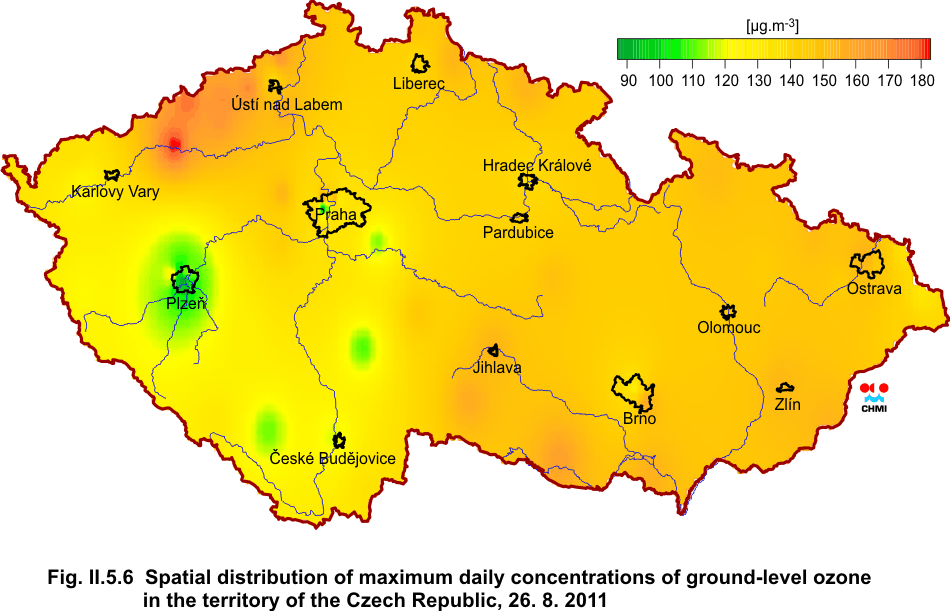
Fig. II.5.6 Spatial distribution of maximum daily 1-hour concentrations of ground-level ozone in the territory of the Czech Republic, 26.8.2011
|