| AIR POLLUTION IN THE CZECH REPUBLIC IN 2011 Czech Hydrometeorological Institute - Air Quality Protection Division |
|
|
|
|
|
II.4.3 Areas with deteriorated air quality II.4.3.1 Areas with exceedances of
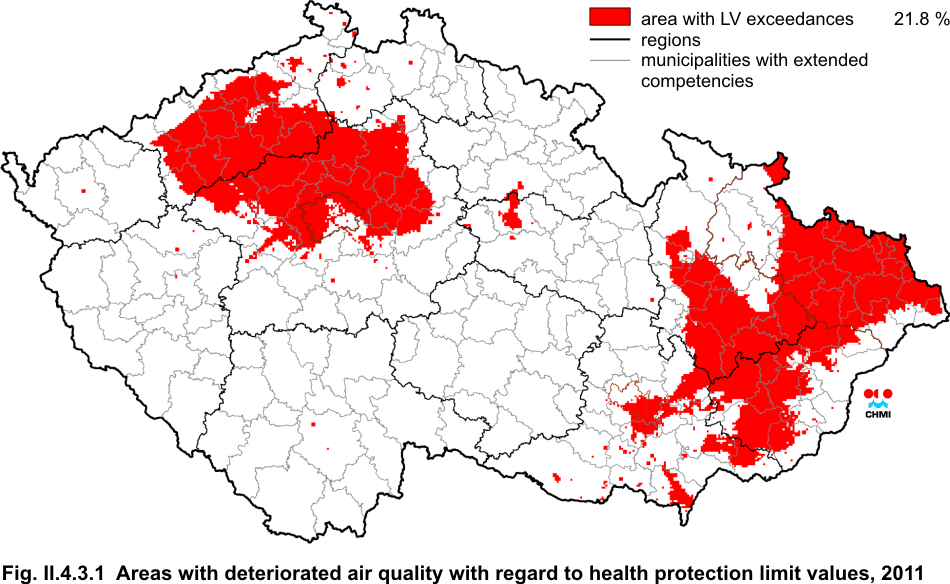
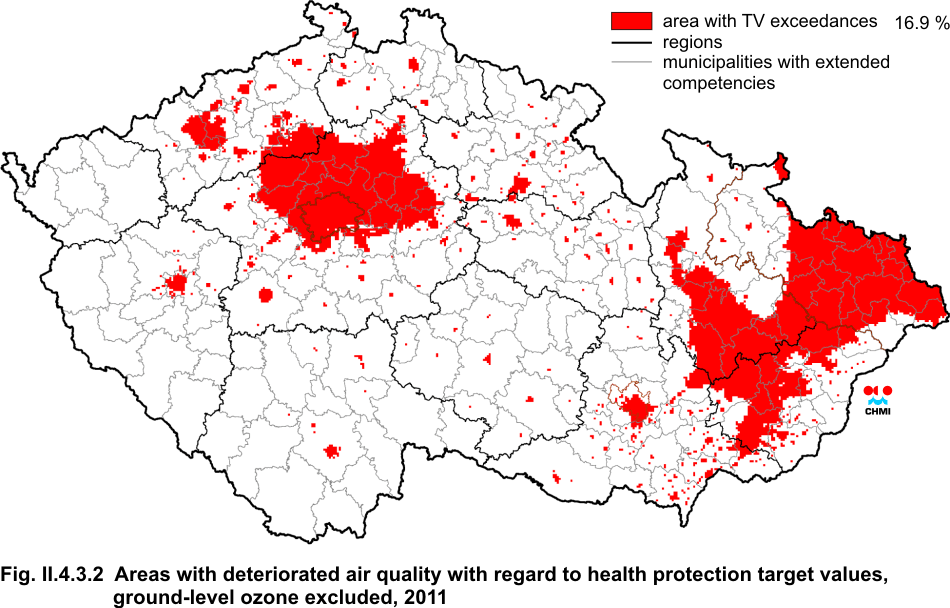
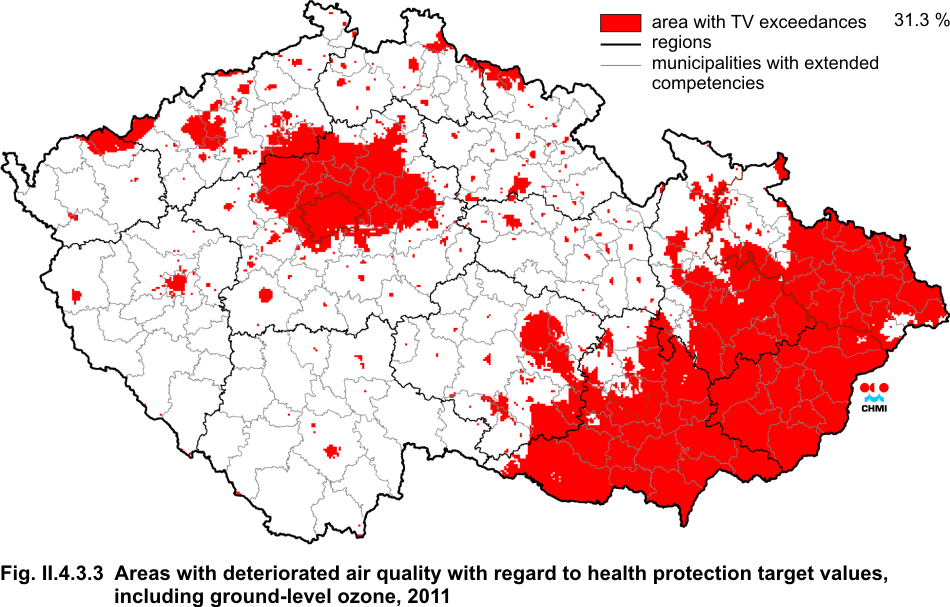
limit values and target values with regard to human health protection The exceedances of air pollution limit values for annual average concentrations of PM10, NO2, lead and benzene were assessed, as well as the exceedance of CO 8-hour limit value, the exceedance of daily limit values for PM10 and SO2 and exceedance of hourly limit values for SO2 and NO2. Also assessed was the exceedance of target values for annual average concentrations of benzo(a)pyrene, cadmium, arsenic and nickel and for the highest maximum daily 8-hour concentration of ground-level ozone. The mapping procedures described earlier were used for the preparation of the maps of spatial distribution of the respective air pollution characteristics presented in the previous subchapters, both for the exceedance of the limit values and for the exceedance of the target values. The areas with the values of air pollution characteristics higher than the respective limit values/target values are marked in red. The map of the areas with deteriorated air quality (OZKO) presents the complete information on ambient air quality in the territory of the Czech Republic in 2011. Within the assessed year 21.8 % of the territory with approx. 50.8 % of population was defined as the areas with deteriorated air quality (Fig. II.4.3.1). More detailed analysis (Table II.4.3.1) shows quite clearly that the inclusion of zones and agglomerations (divided into municipalities with extended competencies) into OZKO is mostly caused by the exceedance of the daily limit value for PM10 suspended particles. In some areas, mainly in those with traffic and industrial loads, the inclusion of the respective territory to OZKO may be influenced also by the exceedance of the limit value for another pollutant. This is the case of NO2 (frequent in the agglomerations Prague and Brno) and benzene (frequent in the agglomeration Moravian-Silesian Region). Similarly, the classification of a territory as the area with the exceedance of at least one target value excluding ozone is the result of the exceedance of the target value for benzo(a)pyrene in particular. In 2011 16.9 % of the territory of the Czech Republic was assessed as the areas with the exceedance of at least one target value excluding ozone (Fig. II.4.3.2). Based on the results of more detailed analysis within individual agglomerations and zones (Table II.4.3.1) it can be stated that in 2011, again, the greatest share in the delineation of OZKO was contributed by the above-the-limit concentrations of benzo(a)pyrene and further PM2.5 particles. arsenic and exceptionally also nickel. After including the ground-level ozone 31.3 % of the territory of the Czech Republic was assessed as the areas with the exceedance of at least one target value (Fig. II.4.3.3, Table II.4.3.2). It is estimated that the areas with the exceedance of at least one target value were inhabited in 2011 by approx. 61.4 % of population; after including ozone the estimate increased to 67.2 % of inhabitants. The delineation of the above three types of areas has been used since 2006 (Fig. II.4.3.3). It cannot be stated that the situation has changed markedly over this period of time with the exception of the influence of ground-level ozone. Considerable part of the territory of the Czech Republic is still exposed to the above-the-limit concentrations of ambient air pollutants. Moreover, the maps in Figs. II.4.3.1, and II.4.3.2 show clearly that these areas are very densely populated.
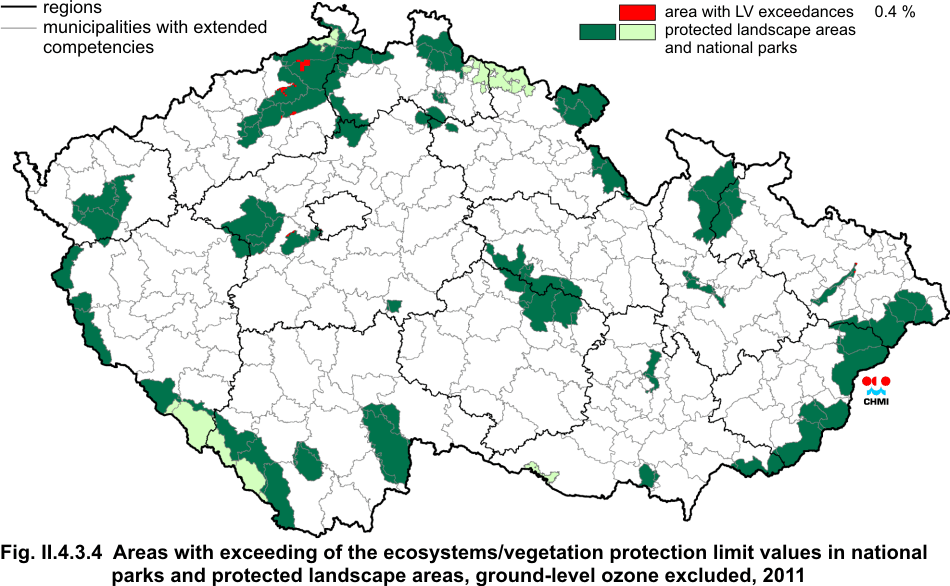
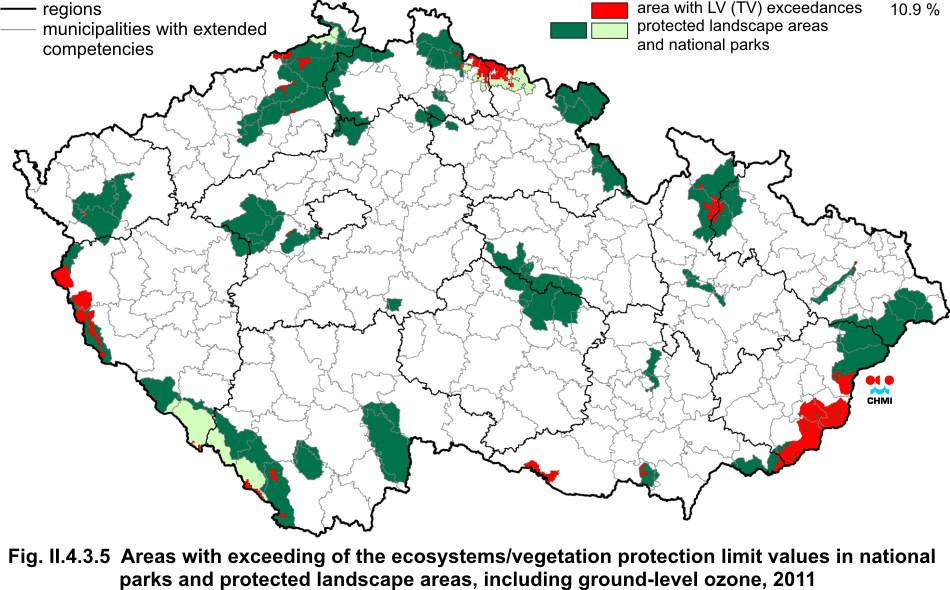
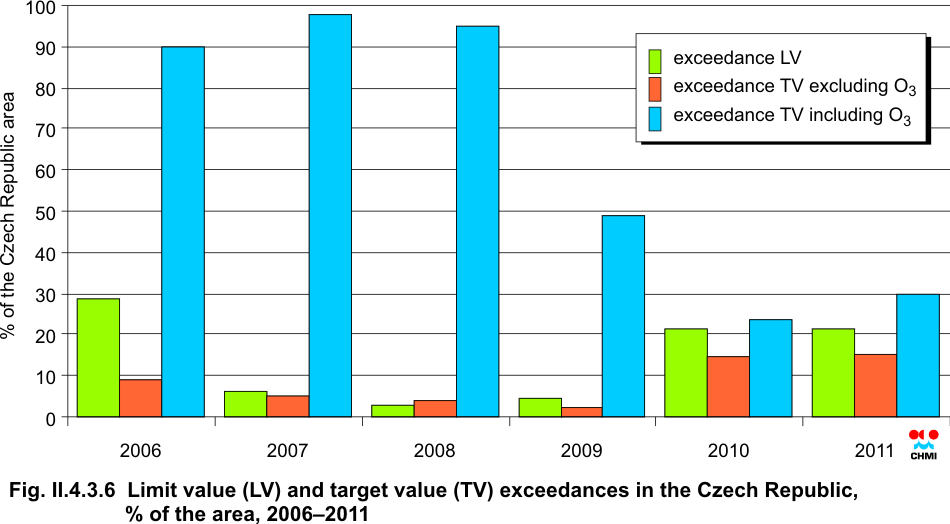
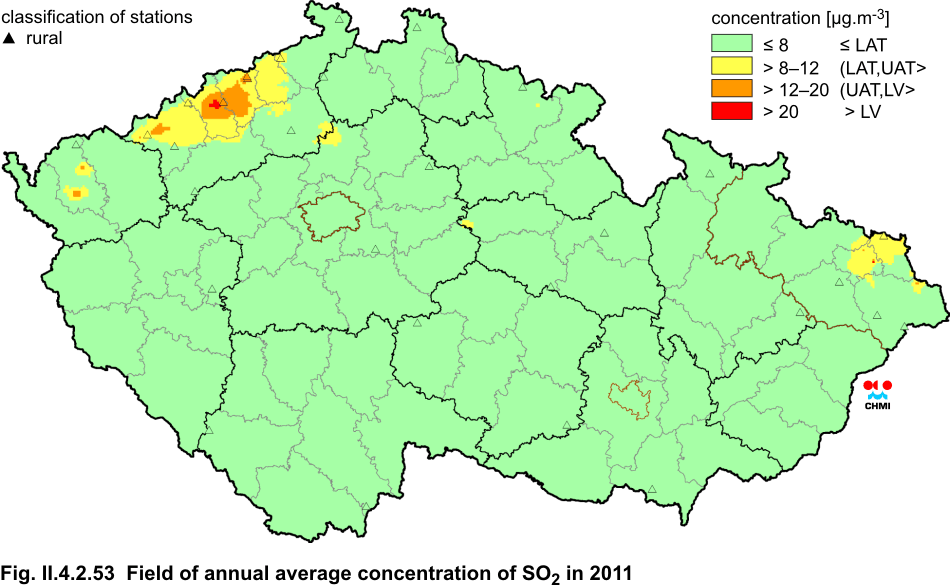
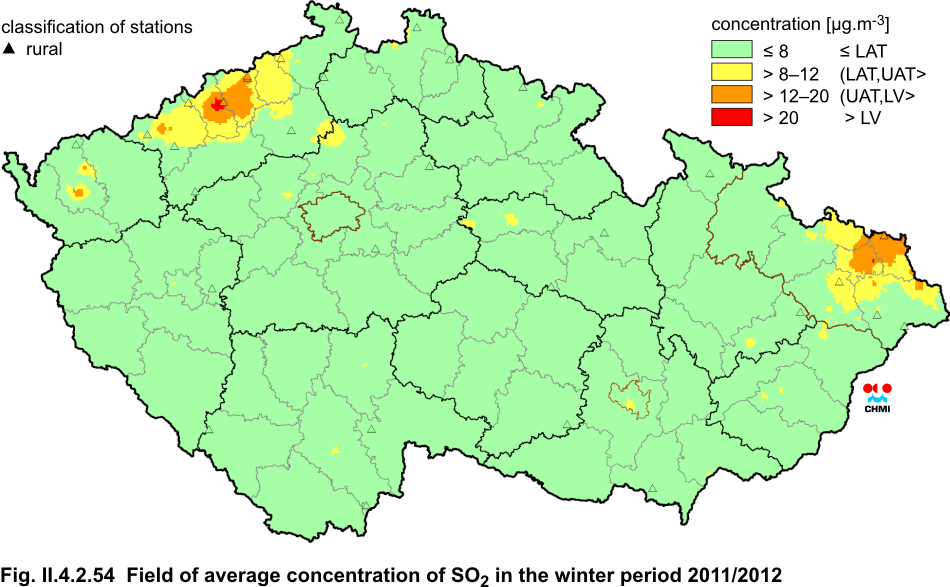
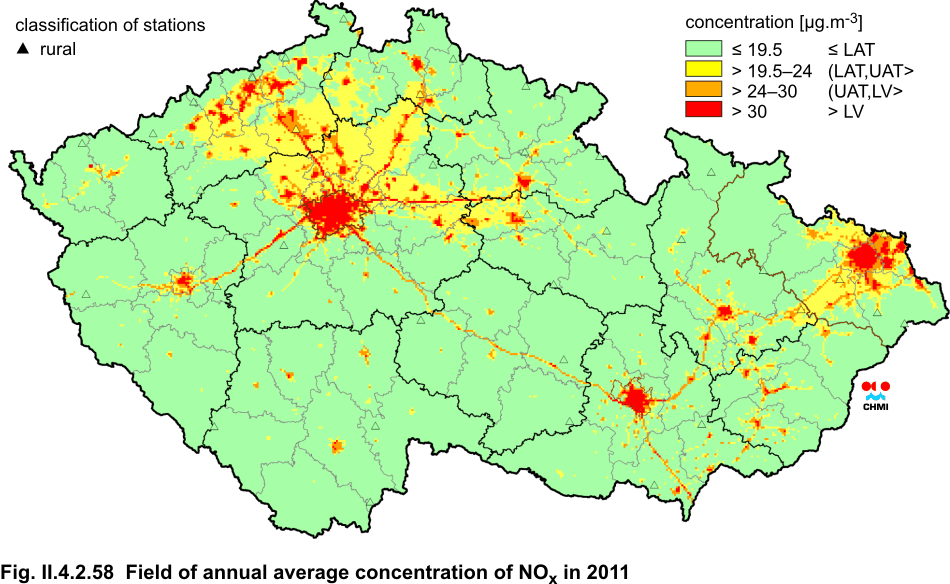
II.4.3.2 Areas with deteriorated air quality with regard to the protection of ecosystems and vegetation Based on the mapping of air pollution characteristics distribution for the year 2011 with regard to ecosystems and vegetation protection (Chapter II.4.2.2.1, II.4.2.2.2 and II.4.2.2.3) the distribution for annual and winter average concentrations of SO2 (Figs. II.4.2.53 and II.4.2.54) and annual average NOx concentrations (Fig. II.4.2.58) for the protection of ecosystems and vegetation is depicted. The maps in Fig. II.4.3.5 and Fig. II.4.3.6 show the delineation of the areas with deteriorated air quality with regard to the limit value for the protection of ecosystems and vegetation in the territory of national parks and protected landscape areas, the ground-level ozone excluded and included, respectively. Table II.4.3.3 is presented for information. It shows the exceedances of the SO2 and NOx limit value and the AOT40 target value for the protection of ecosystems and vegetation within the national parks and protected landscape areas (% of the territory) in 2011. The values were calculated on the basis of the respective maps of air pollution characteristics.
Fig. II.4.3.1 Areas with exceeding of the health protection limit values, 2011
Fig. II.4.3.2 Areas with exceeding of the health protection target values, ground-level ozone excluded, 2011
Fig. II.4.3.3 Areas with exceeding of the health protection target values, incl. ground-level ozone, 2011
Fig. II.4.3.4 Areas with exceeding of the ecosystems/vegetation protection limit values in national parks and protected landscape areas, ground-level ozone excluded, 2011
Fig. II.4.3.5 Areas with exceeding of the ecosystems/vegetation protection limit values in national parks and protected landscape areas, including ground-level ozone, 2011
Fig. II.4.3.6 Limit value (LV) and target value (TV) exceedances in the Czech Republic, % of the area, 2006–2011
|