|
|
AIT POLLUTION IN THE CZECH REPUBLIC IN 2000 Czech Hydrometeorological Institute - Air Quality Protection Division |
|
|
|
|
2.3 AIR POLLUTION IN THE CZECH REPUBLIC
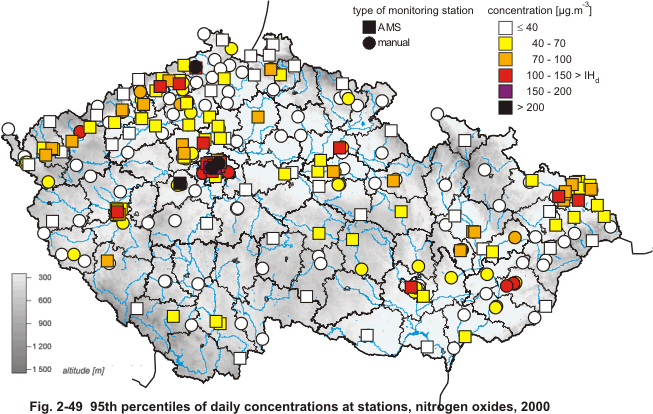
2.3.1 Air Pollution Caused by Principal Pollutants Sulphur Dioxide The 2000 situation in sulphur dioxide pollution in the Czech Republic is shown in maps of ambient air pollution characteristics (Figs. 2-37, 2-38, 2-39). Almost on the entire Czech RepublicÆs territory, SO2 annual arithmetic means did not exceed 20 ╬╝g.m-3 in 2000. On entire of the countryÆs territory, except for a very small area, the 95th percentile of SO2 daily averages stayed under 50 ╬╝g.m-3. The only area where SO2 pollution limit values were occasionally exceeded is the north Bohemia, mainly the Kru┼Īn├® hory Mts. basin region. In this territory pollution level above 20 ╬╝g.m-3 was recorded occasionally in 2000, (annual mean) which represents one third of the limit value. Other areas of the Czech Republic, including Prague, showed very low SO2 pollution levels, markedly below the limit values. Compared to previous years, in 2000 the decreasing trend in sulphur dioxide pollution continued throughout the Czech Republic. This phenomenon is documented by maps of SO2 concentration fields for both 1999 and 2000 years. In 2000, the percentage of 20ŌĆō30 ╬╝g.m-3 class (annual arithmetic mean) as well as of 50ŌĆō80 ╬╝g.m-3 class (95th percentile) maintained the decreasing trend to the benefit of the lowest SO2 concentrations. SO2 concentrations amounting to 10 ╬╝g.m-3 (annual arithmetic mean) affected already 97 % of the countryÆs territory. Suspended Particulate Matter SPM pollution in the Czech Republic in 2000 is illustrated in maps of ambient air pollution characteristics (Figs. 2-40, 2-41, 2-42, 2-43, 2-44, 2-45, 2-46, 2-47). On 88.5 % of the Czech Republic territory, SPM annual arithmetic means did not exceed 30 ╬╝g.m-3 and on 98 % of countryÆs territory annual arithmetic means reached at most 40 ╬╝g.m-3. On 98 % of the country the 95th percentile of daily averages did not exceed 80 ╬╝g.m-3 in 2000. All these percentages are almost identical with the year 1999. In the past the Ostrava Region (now part of the Moravian-Silesian Region) was, and in terms of the size of area affected with concentrations between 40 and 50 ╬╝g.m-3 (annual arithmetic mean) continues to be the region which suffers from SPM most of all. In 2000 the heaviest SPM pollution with limit value exceedences was, similarly as in 1999, recorded mainly in the part of the centre of Prague (see Chapter 2.2.1). In other areas the SPM annual limit value was exceeded at AIM stations M─øln├Łk- P┼Īovka, Bohum├Łn (PM10) and Kladno-┼Āvermov (PM10). Concentrations over 40 ╬╝g.m-3 (annual arithmetic mean) were reported from the following areas: Ostrava Region (Ostrava-City District, Karvin├Ī District and the northern part of the Fr├Įdek- M├Łstek District with T┼Öinec and its surroundings), occasionally northern and central Bohemia (the Most Basin, the northern part of the city of Kladno, and the M─øln├Łk District), and Moravia (Brno and several other Moravian towns and villages). In 2000 as compared with the previous year, a slight increase of PM10 concentrations was recorded mainly in large cities. Nitrogen Oxides Maps of ambient air pollution characteristics illustrate NOx pollution in the Czech Republic in 2000 (Figs. 2-48, 2-49, 2-50, 2-51). Annual arithmetic means up to 20 ╬╝g.m-3 occurred most frequently in the country (86 %). On 98 % of its territory the 95th percentile of annual files of daily averages was lower than 70 ╬╝g.mŌĆō3. The heaviest NOx pollution has always been recorded in Prague, where in the past years the daily air pollution limits were exceeded in more than 5 % of cases at almost all stations. This is characteristic also for the year 2000 (see Chapter 2.2.1). These exceedences were recorded at some urban stations in northwestern and central Bohemia, in the Ostrava Region and in Plze┼ł, Hradec Kr├Īlov├®, Brno, and Zl├Łn. In 2000 the air pollution caused by NOx was approximately comparable with the previous year, a slight increase of concentrations (annual arithmetic mean) was recorded at most stations in large cities. This is documented also by fields of annual arithmetic means for both 1999 and 2000 years when a slight increase of concentrations in the interval 50ŌĆō80 ╬╝g.m-3 was observed in 2000, mainly in built up areas. Only on 0.4 % of the area of the Czech Republic the 95th percentile of daily concentrations exceeded the limit value (100 ╬╝g.m-3). The graphic representation of annual courses of the above
substancesÆ daily concentrations at selected stations in the Czech Republic
(Fig. 2-55) illustrates that NOx contribution
to air pollution is decisive at the stations classified as traffic
(T/U/ģ., see the Explanatory notes to the tables of annual courses). At other
measuring sites the share of PM10 concentrations prevailed.
|