| AIR POLLUTION IN THE CZECH REPUBLIC IN 2012 Czech Hydrometeorological Institute - Air Quality Protection Division |
|
|
|
|
|
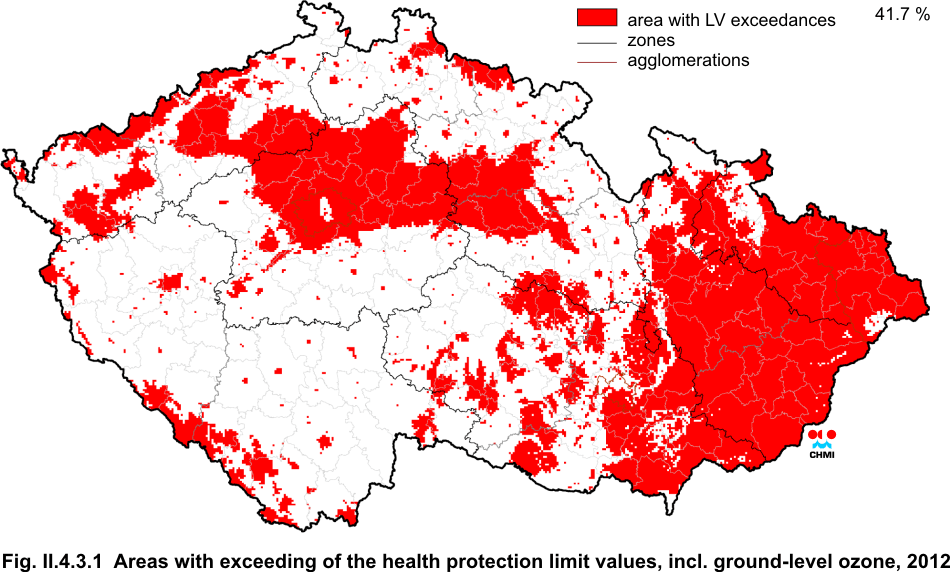
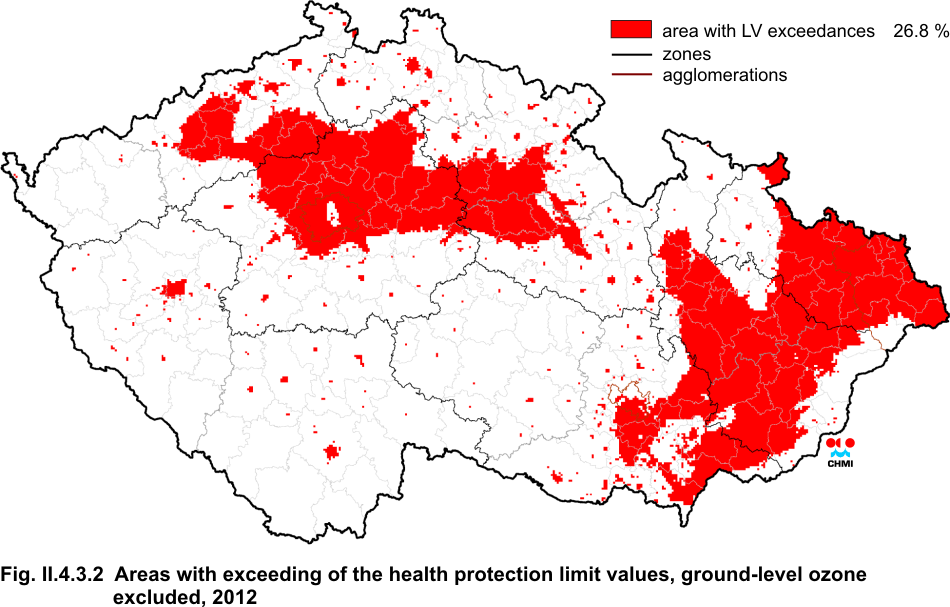
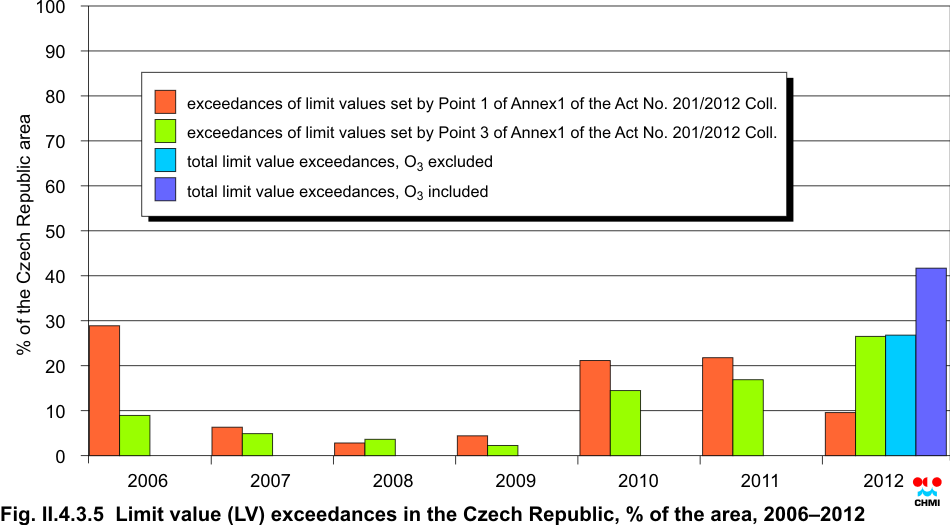
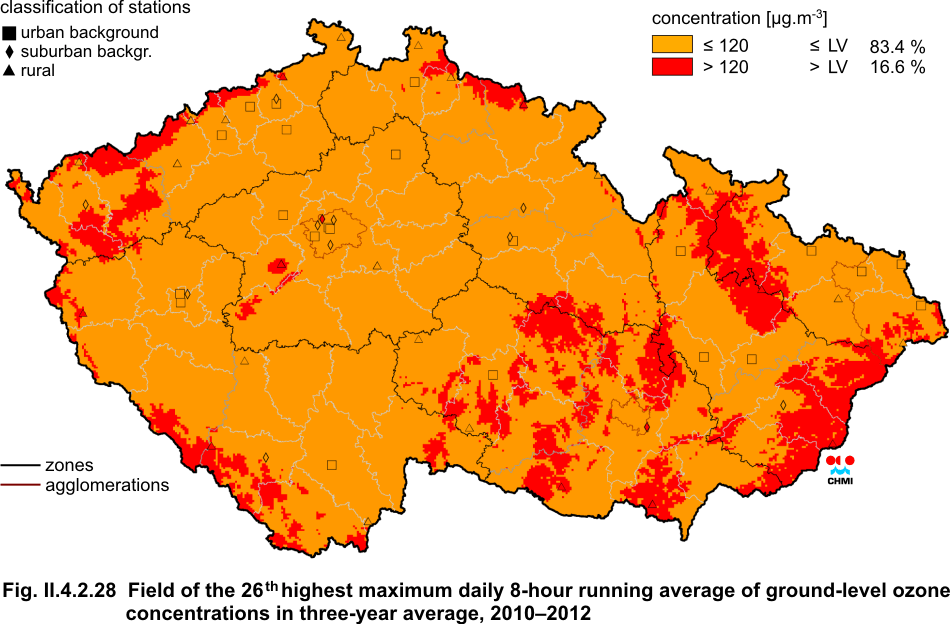
II.4.3 Areas with deteriorated air quality II.4.3.1 Areas with exceedances of limit values and target values with regard to human health protection The Act No. 201/2012 Coll. on Clean Air Protection sets the limit values for selected pollutants without further distinguishing between limit values and target values. For the first time for the year 2012 the areas with exceeded limit values are defined together for all pollutants monitored with regard to the protection of human health. Consequently, the exceedances of air pollution limit values for annual average concentrations of PM10, PM2.5, NO2, lead and benzene were assessed, as well as the exceedance of CO 8-hour limit value, the exceedance of daily limit values for PM10 and SO2 and exceedance of hourly limit values for SO2 and NO2. (the limit values set by point 1 of Annex No. 1 of the Act No. 201/2012 Coll. on Clean Air Protection; formerly limit values). Also assessed was the exceedance of limit values for annual average concentrations of benzo(a)pyrene, cadmium, arsenic and nickel and for the highest maximum daily 8-hour concentration of ground-level ozone (the limit values set by points 3 and 4 of Annex No. 1 of the Act No. 201/2012 Coll. on Clean Air Protection; formerly target values). With regard to the continuity of the assessment in the previous years (Fig. II.4.3.5) also the territories with the exceeded limit values set by point 1 were defined in particular (formerly the areas with deteriorated air quality, so called OZKO) and the territories with exceeded limit values set by point 3 (formerly the areas with the target values exceedances, ozone excluded). The mapping procedures described earlier were used for the preparation of the maps of spatial distribution of the respective air pollution characteristics presented in the previous subchapters. The areas with the values of air pollution characteristics higher than the respective limit values are marked in red. The map of the areas with exceeded limit values (ozone excluded) presents the complete information on ambient air quality in the territory of the Czech Republic in 2012. Within the assessed year 26.8 % of the territory with approx. 67.48 % of population was defined as the above areas (Fig. II.4.3.1). More detailed analysis (Table II.4.3.1) shows quite clearly that the inclusion of zones and agglomerations (divided into municipalities with extended competencies) into these areas is mostly caused by the exceedance of the daily limit value for PM10 suspended particles and by the exceedance of the annual limit value for PM2.5 and benzo(a)pyrene. In some areas, mainly in those with traffic and industrial loads, the inclusion of the respective territory to these areas may be influenced to a certain extent also by the exceedance of the limit value for NO2 (mainly in the agglomerations Prague and Brno) and benzene (in the agglomeration Ostrava/Karviná/FrĂ˝dek-MĂstek). After including the ground-level ozone 41.7 % of the territory of the Czech Republic was assessed as the areas with the exceedance of at least one limit value (Fig. II.4.3.2). The share of inhabitants living in these areas is 69.75 %. The increase of this share after including the ground-level ozone into these areas is thus not high. This is caused by the occurrence of increased ozone concentrations mainly in relatively clean natural areas, i.e. in the areas with lower population density (Fig. II.4.2.28). The areas with exceeded limit values have been delineated since 2006 (Fig. II.4.3.5). It cannot be stated that the situation has changed markedly over this period of time with the exception of the influence of ground-level ozone. Considerable part of the territory of the Czech Republic is still exposed to the above-the-limit concentrations of ambient air pollutants. Moreover, the maps in Figs. II.4.3.1 and II.4.3.2 show clearly that these areas are very densely populated.
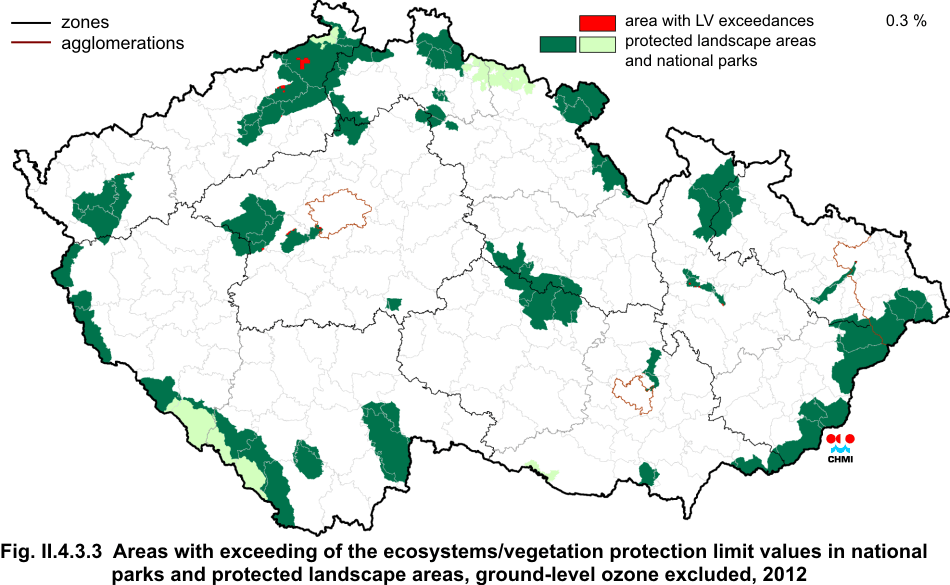
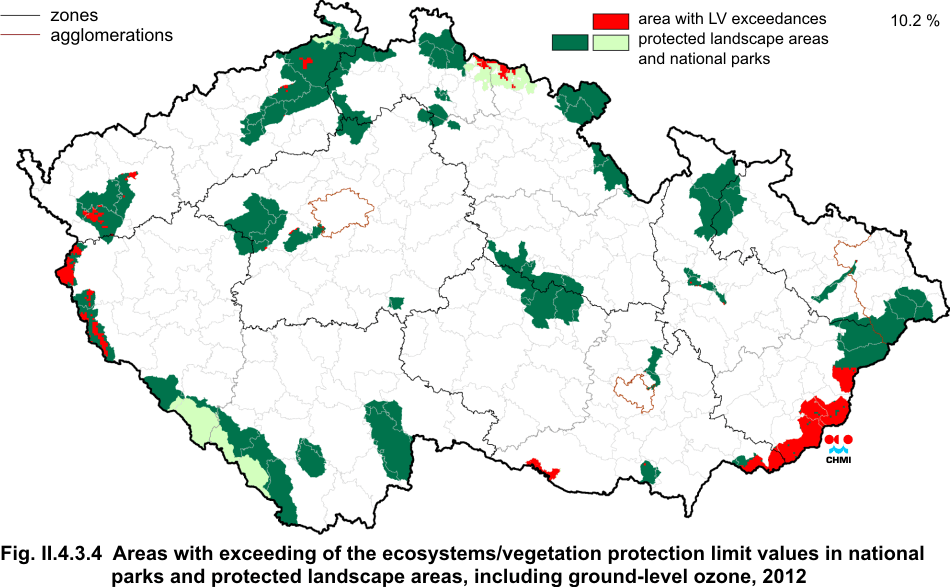
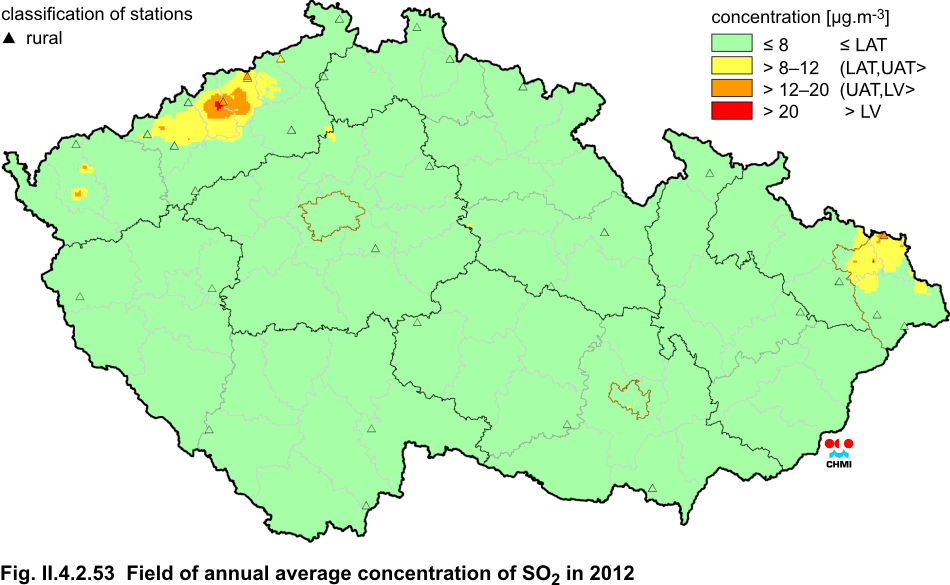
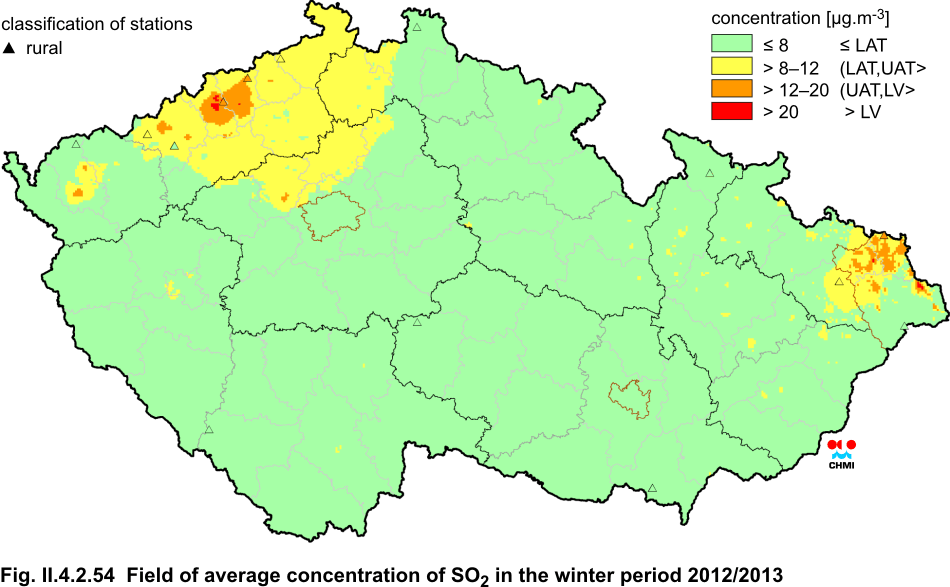
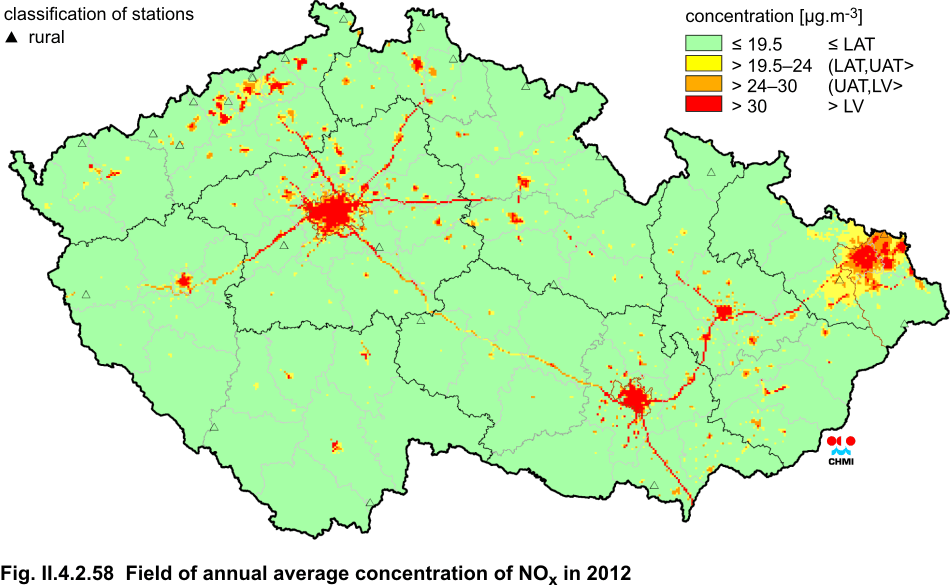
II.4.3.2 Areas with exceedances of limit values with regard to the protection of ecosystems and vegetation Based on the mapping of air pollution characteristics distribution for the year 2012 with regard to ecosystems and vegetation protection (Chapter II.4.2.2.1, II.4.2.2.2 and II.4.2.2.3) the distribution for annual and winter average concentrations of SO2 (Figs. II.4.2.53 and II.4.2.54) and annual average NOx concentrations (Fig. II.4.2.58) for the protection of ecosystems and vegetation is depicted. The maps in Fig. II.4.3.3 and Fig. II.4.3.4 show the delineation of the areas with exceedances of limit values with regard to the protection of ecosystems and vegetation in the territory of national parks and protected landscape areas, the ground-level ozone excluded and included, respectively. Table II.4.3.3 is presented for information. It shows the exceedances of the SO2 and NOx limit value and the AOT40 limit value for the protection of ecosystems and vegetation within the national parks and protected landscape areas (% of the territory) in 2012. The values were calculated on the basis of the respective maps of air pollution characteristics.
Fig. II.4.3.1 Areas with exceeding of the health protection limit values, incl.
ground-level
ozone, 2012
Fig. II.4.3.2 Areas with exceeding of the health protection limit values, ground-level ozone excluded, 2012
Fig. II.4.3.3 Areas with exceeding of the ecosystems/vegetation protection limit
values in national parks and protected landscape areas, ground-level ozone
excluded, 2012
Fig. II.4.3.4 Areas with exceeding of the ecosystems/vegetation protection limit
values in national parks and protected landscape areas, including ground-level
ozone, 2012
Fig. II.4.3.5 Limit value (LV) exceedances in the Czech Republic, % of the area, 2006–2012
|