| AIR POLLUTION IN THE CZECH REPUBLIC IN 2012 Czech Hydrometeorological Institute - Air Quality Protection Division |
|
|
|
|
|
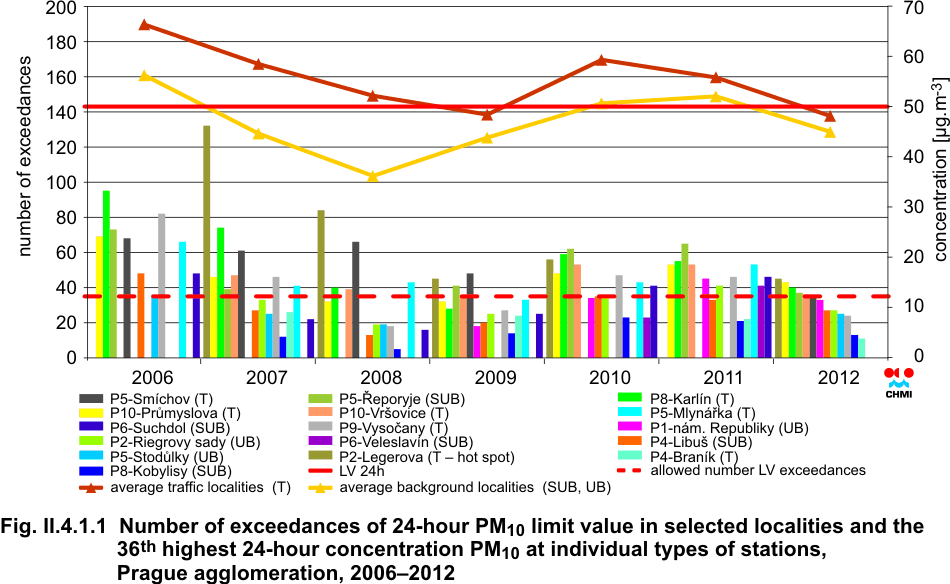
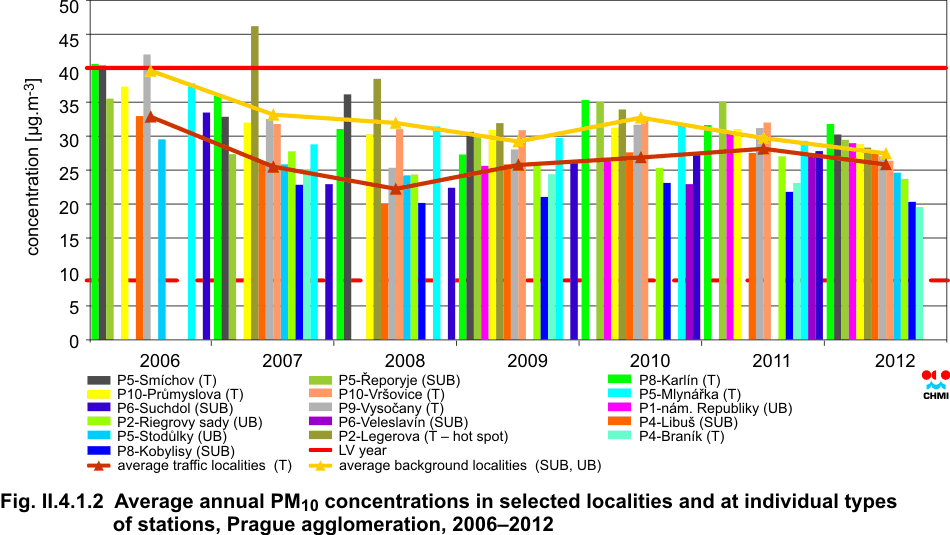
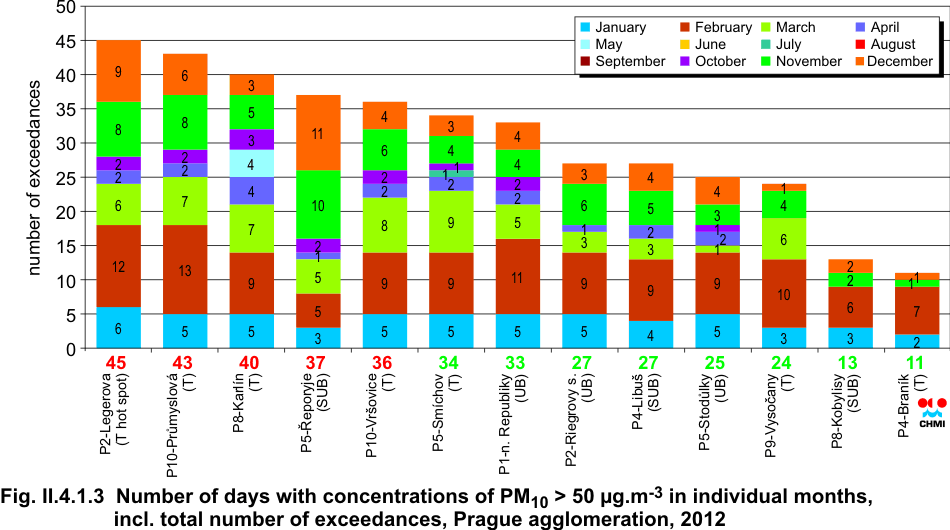
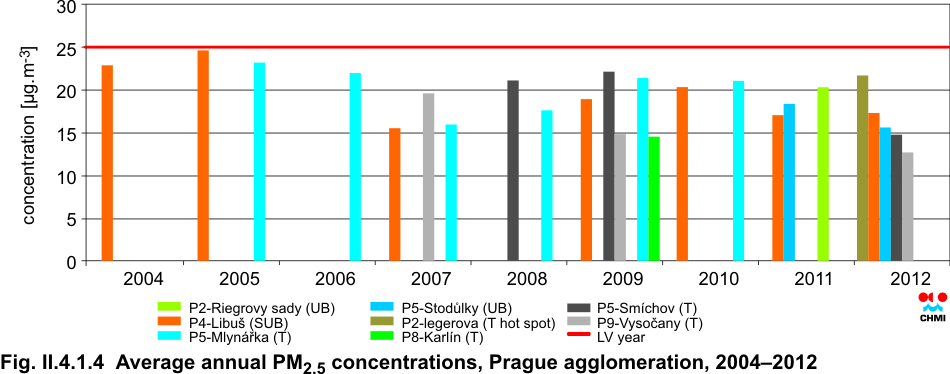
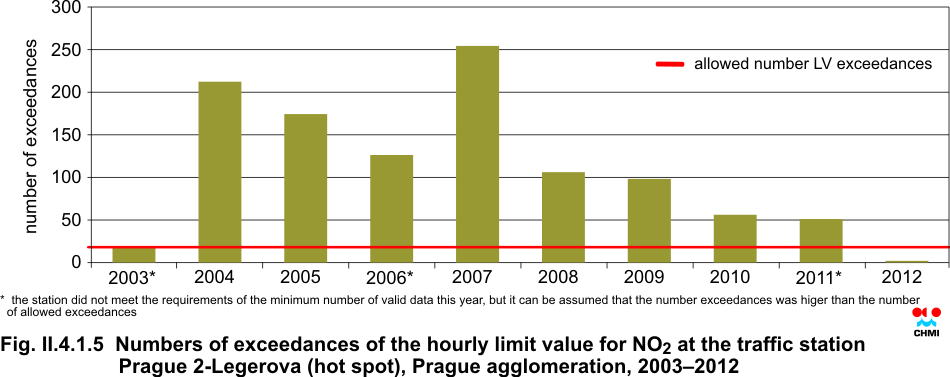
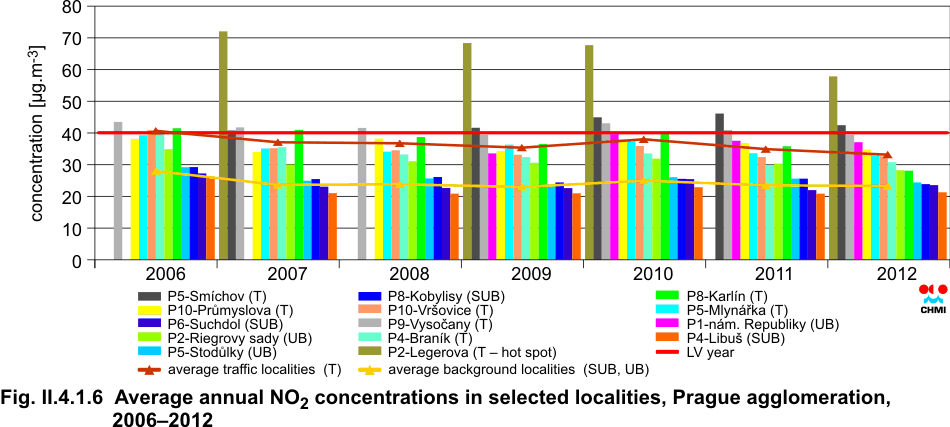
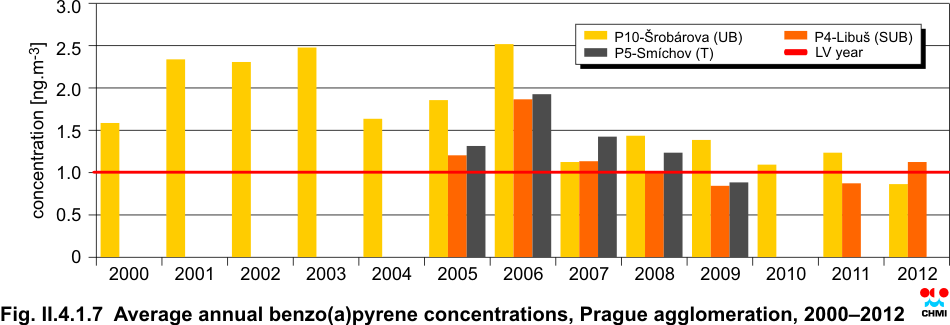
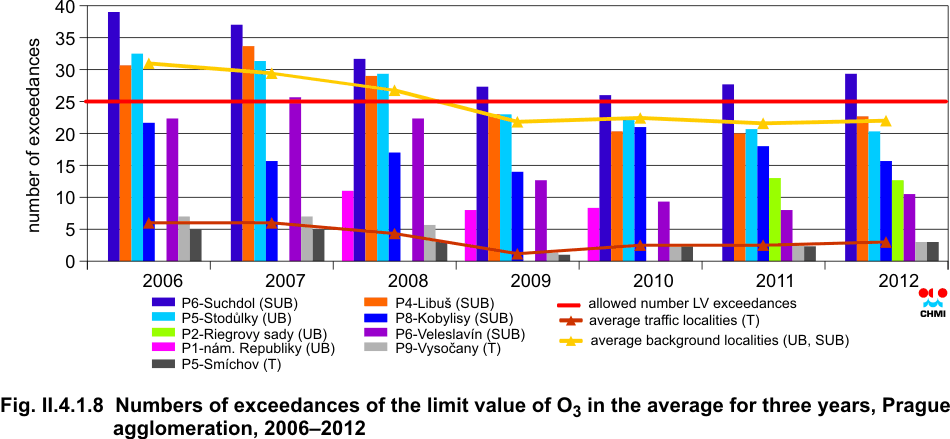
II.4.1 Agglomerations Act No. 201/2012 Coll. on Clean Air Protection sets the division of the territory of the Czech Republic into zones and agglomerations with the purpose to assess and evaluate the level of ambient air quality. This chapter is devoted to more detailed assessment of ambient air quality in the agglomerations Prague, Brno and Ostrava/Karvin├Ī/Fr├Įdek-M├Łstek, i.e. in the areas with deteriorated ambient air quality mainly due to traffic and industrial loads. Moreover, these areas are densely populated; the share of inhabitants exposed to above-the-limit concentrations in these areas is thus not negligible. Further subchapters contain also the assessment of ambient air quality in the ├Üst├Ł nad Labem Region, Hradec Kr├Īlov├® Region and Pardubice Region. The ├Üst├Ł nad Labem Region is the territory with high density of population and high concentration of industry in the northern part of the region. This region, in spite of the improvement of ambient air quality as compared with the situation in the past, still ranks among the areas with regular exceedances of limit values for several pollutants. Attention is also paid to the Hradec Kr├Īlov├® Region and Pardubice Region, i.e. the areas with ever increasing traffic loads and with several significant large stationary sources (power plants, heating plants and chemical industry). II.4.1.1 Prague The Capital City of Prague is the area in which a lot of people are exposed to ambient air pollution. As concerns ambient air quality assessment, Prague is ranked among the agglomerations. In the Prague agglomeration the limit values for suspended particles, nitrogen dioxide, benzo(a)pyrene and ground-level ozone are exceeded in the long term. Most of the limit values exceedances are connected with significant traffic loads of the capital, but also with household heating, mainly in the built-up areas with family houses. The share of mobile sources in total emissions of TSP in the Prague agglomeration amounts to more than 85 %, in total emissions of NOx approximately 75 %. Households in the territory of Prague agglomeration contribute to TSP emissions by almost 6 %, to PM10 emissions by 16 %. Generally it can be stated that in comparison with the year 2011 air pollution situation slightly improved in the territory of the Prague agglomeration. Concentrations of PM10 suspended particles and nitrogen dioxide (NO2) decreased. Nevertheless, the limit value for the average 24-hour concentration of PM10 was exceeded at 5 of 13 stations, the annual limit value for NO2 was exceeded in two traffic localities. Benzo(a)pyrene concentrations are comparable with the levels of concentrations in the previous years, the exceedance of the annual limit value was recorded again at one station. Ozone concentrations exceed the limit value repeatedly only at the background station Prague 6-Suchdol. The numbers of exceedances of the limit value for ground-level ozone in the territory of Prague agglomeration have remained at approximately same level for several years. As concerns further pollutants, there is no problem to meet their respective limit values. Suspended particles of PM10 and PM2.5 In 2012 the concentrations of suspended particles of PM10 fraction were monitored in Prague in 14 CHMI localities, in one SZ├Ü locality and in four Z├Ü localities. The 24-hour PM10 limit value (the value 50 ╬╝g.m-3 must not be exceeded more than 35x in one year) was exceeded in 5 of 13 localities with sufficient number of data for the assessment (in 2011 the limit value was exceeded in 10 of 13 localities). Four of 5 localities, in which the limit value was exceeded, are classified as traffic localities. In the-year-by-year comparison the average 24-hour concentration at traffic stations slightly decreased again, at background stations it decreased after three years (Fig. II.4.1.1). In 2012, similarly as in the previous years the annual PM10 limit value (40 ╬╝g.m-3) was not exceeded in any locality of 13 localities relevant for the assessment of annual concentrations. In the year-to-year comparison the average annual concentrations decreased both at traffic stations and at background stations (Fig. II.4.1.2). As a rule, high concentrations of suspended PM10 and PM2.5 particles and the most frequent exceedances of 24-hour limit value of PM10 are reached in the cold period of the year due to the higher emissions of TSP caused both by higher intensity of heating (incl. local heating) and higher emissions from traffic (increased increased abrasion of road surface by spreading and the subsequent re-suspension of the abraded material) both by less favourable meteorological conditions for the dispersion of pollutants. In the Prague agglomeration the level of 24-hour limit value was exceeded most frequently in the months JanuaryŌĆōMarch and NovemberŌĆōDecember (Fig. II.4.1.3), both at traffic stations and at background stations. The concentrations of fine PM2.5 particles were measured in 5 CHMI localities and in 1 Z├Ü locality in 2012. Similarly as in the previous years the limit value was not exceeded in the territory of the Prague agglomeration (Fig. II.4.1.4). Two localities (Prague 4-Libu┼Ī and Prague 5-Stod┼»lky), for which data are available for the years 2011 and 2012, recorded the decrease of the average annual PM2.5.concentrations in the year-by-year comparison (Stod┼»lky) or stagnated (Libu┼Ī). The highest average annual concentration (21.7 ╬╝g.m-3) reached in the year 2012 was recorded in the locality Prague 2-Legerova where PM2.5 concentrations were measured for the first time in 2012. Nitrogen dioxide NO2 concentrations were measured in 15 CHMI localities in Prague in 2012. The requirement of minimum collection of the measured data set by the legislation was met by 14 localities. The limit value 200 ╬╝g.m-3 was exceeded in the locality Prague 10-Vr┼Īovice 4x, in the localities Prague 5-Sm├Łchov and Prague 2-Legerova 2x. The tolerated number of exceedances is 18. The hourly limit value of NO2 (200 ╬╝g.m-3) was thus not exceeded in any of these localities in 2012. As concerns the exceedance of the hourly limit value, there is a problem mainly with the traffic station Prague 2-Legerova (hot spot) where NO2 has been measured since 2003. This station is aimed at monitoring air pollution caused by traffic (Fig. II.4.1.5). The annual limit value for NO2 (40 ╬╝g.m-3) was exceeded in 2 of 14 localities in the Prague agglomeration (Fig. II.4.1.6), and namely in the localities Prague 2-Legerova (the annual average concentration reached the value of 57.7 ╬╝g.m-3) and Prague 5-Sm├Łchov (42.4 ╬╝g.m-3). Generally, it can be stated, that NO2 concentrations in the territory of the Prague agglomeration decreased in most localities in the year-by-year comparison. The average annual concentrations of NO2 in total average decreased again, and namely at almost 70 % of stations. The concentrations decrease both at traffic stations and at background stations. The maximum highest 19th concentrations decreased at almost 80 % of stations. However, it can be expected that the exceedance of the limit values can occur also in other localities exposed to traffic, where there are no measurements. Benzo(a)pyrene Another problem is caused by benzo(a)pyrene concentrations which in 2012 exceeded the annual limit value in one of two localities in which this pollutant is measured in Prague, and namely at Prague 4-Libu┼Ī. Benzo(a)pyrene concentrations in the assessed period starting by the year 2000 reached the highest concentration in 2006; since then they do not show any marked trend and they fluctuate around the limit value 1 ng.m-3 (Fig. II.4.1.7). Ground-level ozone In 2012 (in the average for 3 years 2010ŌĆō2012) the limit value for the ground-level ozone was exceeded in the locality Prague 6-Suchdol where the 26th highest maximum daily 8-hour running average reached 122.6 ╬╝g.m-3.The exceedances of the limit value in this locality occurred repeatedly every year, in 2012 the limit value was exceeded 29.3x in the average for three years (the tolerated number of exceedances is 25). Further high levels of the 26th maximum daily 8-hour running average, however not reaching the limit value, were recorded in the locality Prague 4-Libu┼Ī (118.5 ╬╝g.m-3). Other stations measuring ground-level ozone in the territory of the Prague agglomeration did not exceed the limit value (Fig. II.4.1.8).
Fig. II.4.1.1 Number of exceedances of 24-hour PM10 limit value in selected localities and the 36th highest 24-hour concentration PM10 at individual types of stations, Prague agglomeration, 2006ŌĆō2012
Fig. II.4.1.2 Average annual PM10 concentrations in selected localities and at individual types of stations, Prague agglomeration, 2006ŌĆō2012
Fig. II.4.1.3 Number of days with concentrations of PM10 > 50 ╬╝g.m-3 in individual months, incl. total number of exceedances, Prague agglomeration, 2012
Fig. II.4.1.4 Average annual PM2.5 concentrations, Prague agglomeration, 2004ŌĆō2012
Fig. II.4.1.5 Numbers of exceedances of the hourly limit value for NO2 at the traffic station Prague 2-Legerova (hot spot), Prague agglomeration, 2003ŌĆō2012
Fig. II.4.1.6 Average annual NO2 concentrations in selected localities and at individual types of stations, Prague agglomeration, 2006ŌĆō2012
Fig. II.4.1.7 Average annual benzo(a)pyrene concentrations, Prague agglomeration, 2006ŌĆō2012
Fig. II.4.1.8 Numbers of exceedances of the limit value of O3 in the average for three years, Prague agglomeration, 2006ŌĆō2012
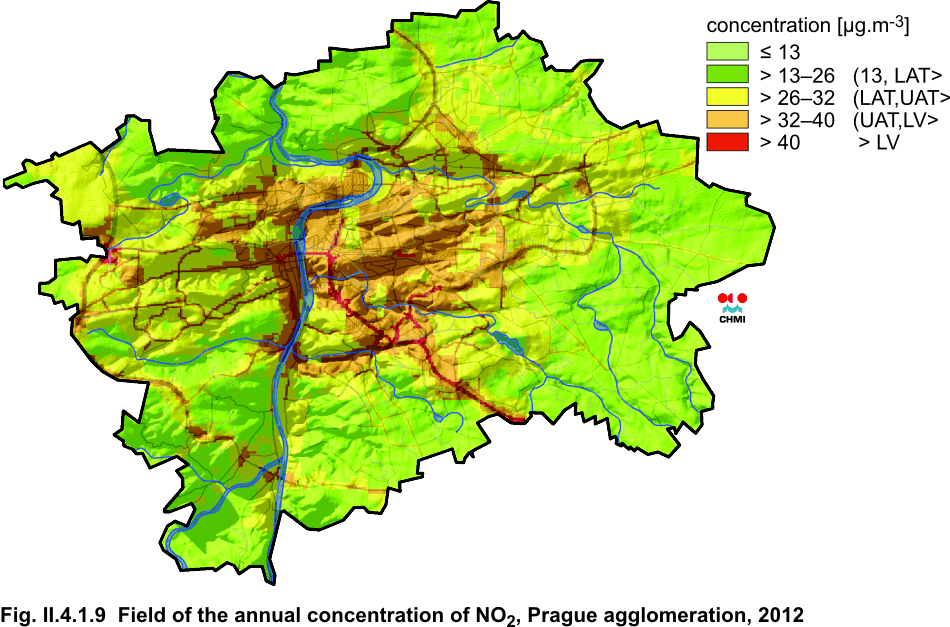
Fig. II.4.1.9 Field of the annual concentration of NO2, Prague agglomeration, 2012
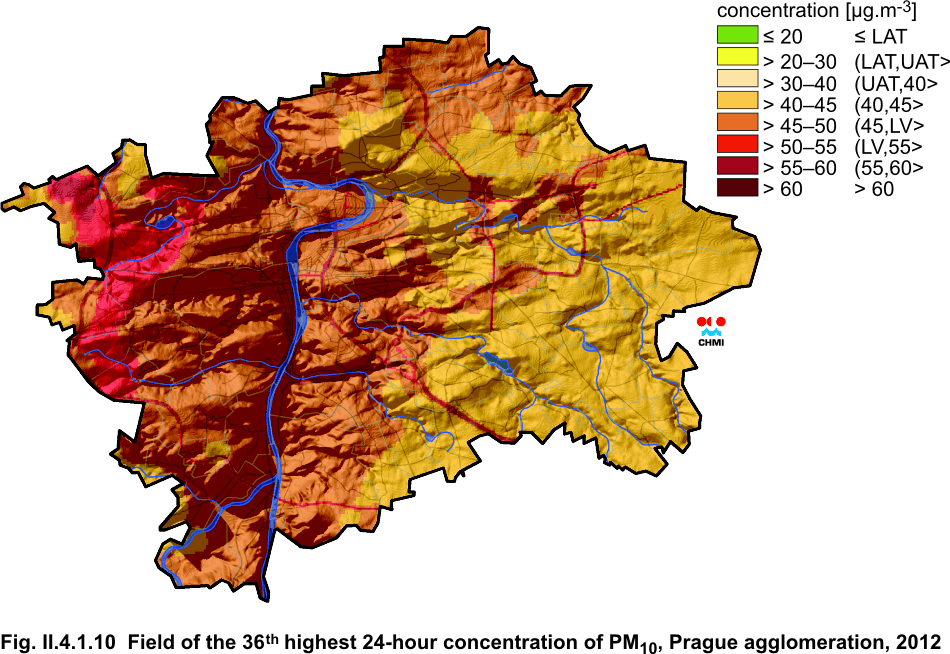
Fig. II.4.1.10 Field of the 36th highest 24-hour concentration of PM10, Prague agglomeration, 2012
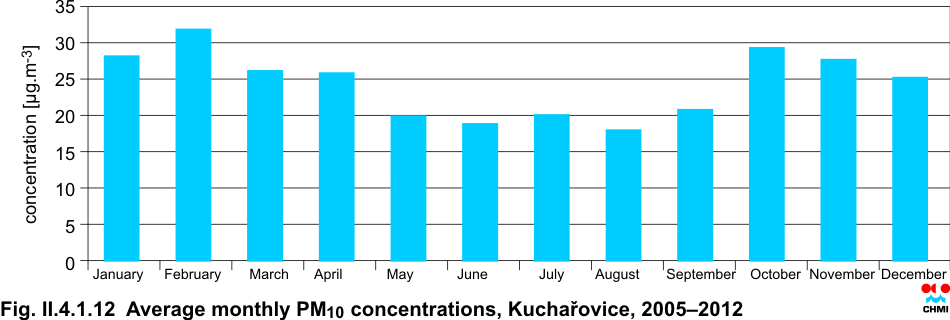
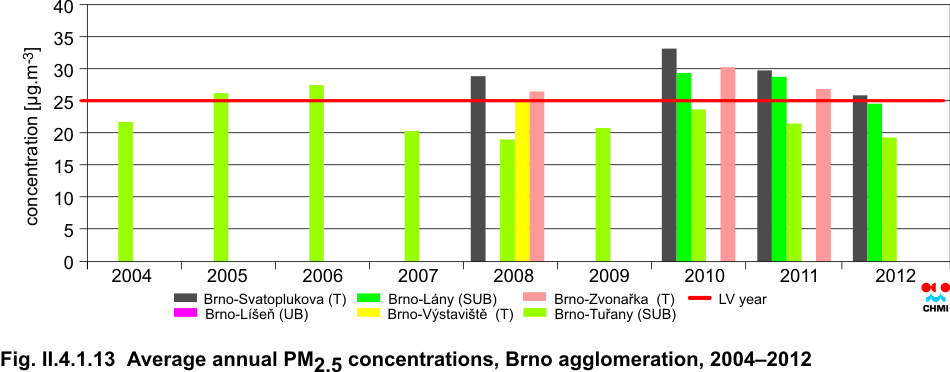
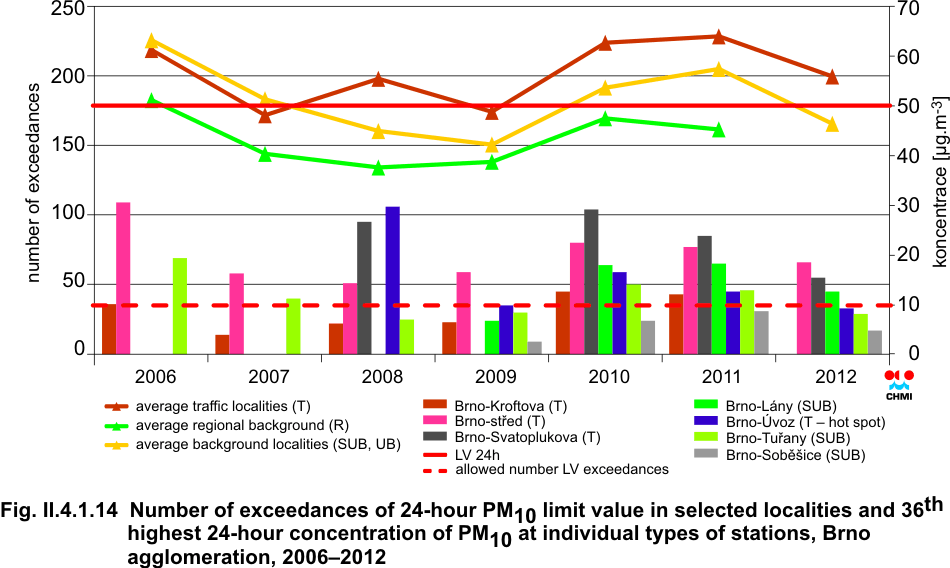
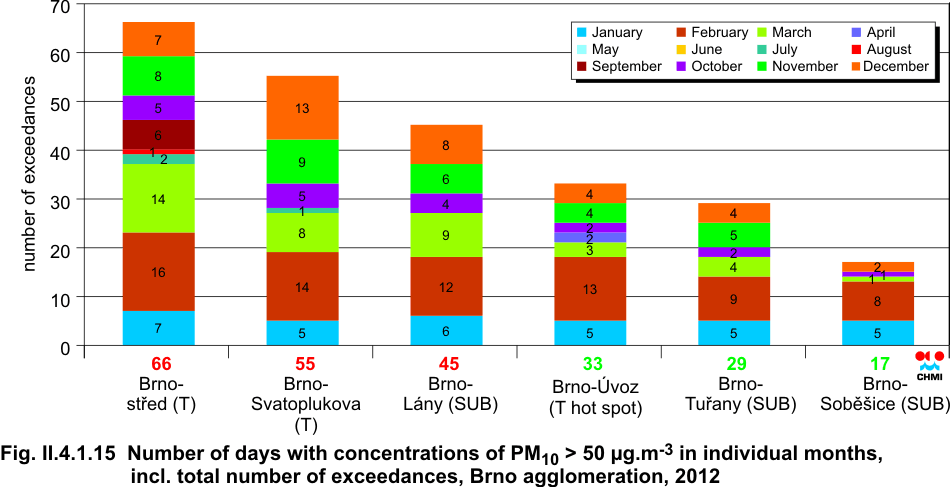
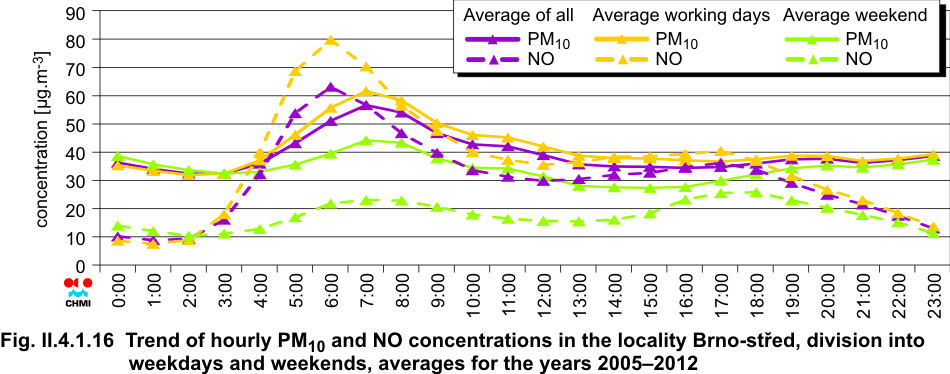
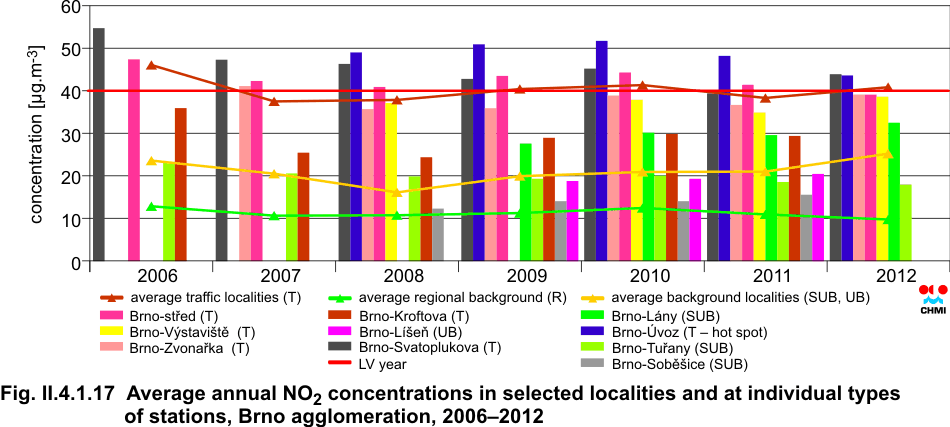
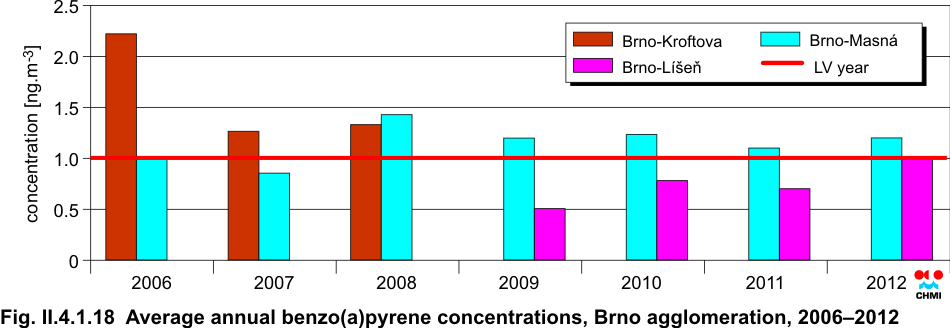
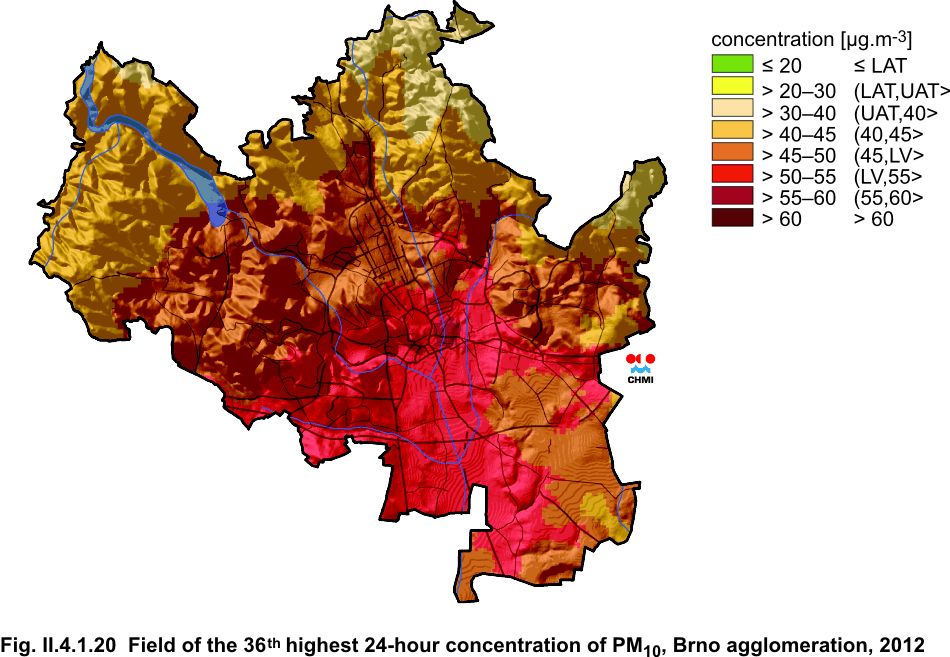
Characteristic of the agglomeration The Brno agglomeration is located in the centre of the South Moravian Region, it is identical with the administrative territory of the city of Brno. As concerns ambient air quality Brno is one of three agglomerations and as such it is not included in the zone South Moravian Region The area of the agglomeration is 230.22 km2 and the number of inhabitants is 384,300. The limit values for the protection of human health are exceeded in the long term in Brno. This is caused mainly by traffic, the major source of pollutants exceeding the limit values in the territory of the agglomeration (Tab. II.4.1.1). Historically, Brno is the city located on the crossroad of communications. Also at present important traffic communications intersect in the Brno territory (highways D1 and D2, expressways R52 to Vienna and R43 to Svitavy). Mainly due to the still unfinished bypass from D1 in direction to Svitavy the already high number of cars in Brno is increased daily by transit traffic going through the city centre. Anyway the transit traffic is not fluent due to the unfinished Brno ring. All the above facts have their share in the increased emissions from traffic ŌĆō particularly total suspended particles (traffic = 87 %), nitrogen oxides (traffic = 76 %), carbon monoxide (traffic = 91 %) and volatile organic compounds (traffic = 78 %) in the territory of the agglomeration, and in the increased air pollution loads affecting the health of population. It is no accident that the limit values are exceeded in the pollutants the main source of which is traffic, and the highest concentrations are measured in the localities with heavy traffic loads. Concentrations of PM10 and PM2.5 suspended particles Average annual concentrations In addition to dispersion conditions and the heating season there is another important factor, and namely wind erosion with regard to the agricultural character of the landscape in the whole South Moravian Region. In this region wind erosion is a potential threat to over 50 % of agricultural land area, while 13 % of this area ranks in the category of most endangered soils. The worst situation is in the districts B┼Öeclav, Hodon├Łn and Znojmo, but also in the surroundings of Brno there are soils heavily endangered by wind erosion. Wind erosion occurs mainly in the periods when there is not the vegetation cover yet or when the vegetation cover is over (April, May and September, October). The soil erodibility is strengthened by longer episodes without precipitation and by wind velocity sufficient for transporting the soil particles. The influence of wind erosion is most apparent in the rural locality Kucha┼Öovice where, in the long term, the measured PM10 concentration in April is the same as that in March (still witihin the heating season) and in October it is higher than in November and December [20] (II.4.1.12). The long-term data from the background suburban station Brno-Tu┼Öany showed that during the periods without precipitation (at least 5 days without precipitation) the average concentrations of PM10 are by 6.1 ╬╝g.m-3 higher than the long-term average for this period [21]. As concerns PM2.5 particles measured in the territory of the Brno agglomeration, the limit value (set in 2012) is exceeded in the long term only in the localities with traffic loads (Fig. II.4.1.13); in background localities the limit value is exceeded or the levels are close to the limit value only in the years with longer episodes of unfavourable dispersion conditions (2006, 2010). 36th highest 24-hour concentration of PM10 Traffic stations exceed the limit value in almost all cases within the whole monitored period and thus confirm the main problem as concerns the ambient air quality in the Brno agglomeration ŌĆō excessive traffic load. The situation is documented very well by the graph in Fig. II.4.1.16, depicting the trend of hourly PM10 concentations in the locality Brno-st┼Öed for the period 2005ŌĆō2012. Heavy traffic during the morning rush hour is apparent very well, while the concentrations in the rush hour during the weekdays are much higher than during the weekends. The difference of concentrations between weekdays and weekends is apparent mainly between 5 a.m. and 8 p.m. ŌĆō in the long term the diference is approximately 10 ╬╝g.m-3. Generally, the levels of concentrations are much dependent on meteorological/dispersion conditions during the winter season. The negative influence of unfavourable dispersion conditions in the winter period together with the heating season (small sources) is reflected also in the distribution of days with PM10 concentrations higher than 50 ╬╝g.m-3; such days occur mainly in the cold part of the year (Fig II.4.1.15). In other months the exceedance of the concentration 50 ╬╝g.m-3 is rather exceptional, occurring at traffic stations only. The highest number of exceedances of PM10 concentration for the calendar year 2012 was recorded in the traffic locality Brno-st┼Öed (66 days), the lowest number in the suburban background locality Brno-Sob─ø┼Īice (17 days). Concentrations of nitrogen dioxide (NO2) In the territory of the Brno agglomeration the limit value for the average annual NO2 concentration is exceeded only in the localities with the heaviest traffic loads. On the contrary, the limit value for 1-hour concentration of NO2 is not exceeded. In 2012 the limit value was exceeded in the localities Brno-├Üvoz (hot-spot) and Brno-Svatoplukova. The locality Brno-st┼Öed, which exceeded the limit value regularly in the previous years (2005ŌĆō2011), did not exceed it in 2012, however, the measured concentrations were very close to the limit value (39.1 ╬╝g.m-3). The long-term background concentrations measured in the locality Brno-Tu┼Öany reach the levels around 20 ╬╝g.m-3 (Fig. II.4.1.17). The trend of NO2 concentrations in the monitored period is relatively stable at all stations, unlike the particles, the measured values are not so much influenced by meteorological conditions; only the intensity of traffic is significant. In this respect, however, nitrogen oxide (NO) is much more significant; nevertheles, no limit value is set for this pollutant. Graph in Fig. II.4.1.16 depicts the long-term situation (2005ŌĆō2012) of hourly concentrations of NO in the locality Brno-st┼Öed. The trends correspond very well with the concentrations of PM10 particles in this locality (Fig. II.4.1.16). The difference between weekdays and weekends is more visible there. It can be stated that the high PM10, NO and NO2 concentrations in the locality Brno-st┼Öed are caused maninly by traffic. Benzo(a)pyrene The polycyclic aromatic hydrocarbons (PAH) are represented in legislation by benzo(a)pyrene ŌĆō carcinogenic substance formed during the combustion of solid and liquid fuels. In the territory of the Brno agglomeration PAH are measured in two localities ŌĆō in the city centre with traffic loads (Brno-Masn├Ī) and in the background residential area (Brno-L├Ł┼Īe┼ł). While the traffic locality Brno-Masn├Ī exceeds the limit value every year since 2008, the concentrations in the locality Brno-L├Ł┼Īe┼ł have not been exceeded as yet (Fig. II.4.1.18). With regard to average monthly concentrations the winter months are very important ŌĆō while in summer the concentrations reach practically zero values, in wither they move in the average around 5 ng.m-3. This is caused by meteorological conditions and also by higher levels of the regional background. Small sources (household heating) are in operation practically only during the heating season. At the same time, within the South Moravian Region they rank right after traffic as concerns most important sources of particles to which PAH are bound. These small sources increase spatial background concentrations in the whole region during the cold part of the year. In traffic localities even higher concentrations are measured which is caused by traffic emissions. Ground-level ozone The monitoring of ground-level ozone (formed in the series of photochemical reactions between nitrogen oxides and VOC) is carried out in two localities in the Brno agglomeration ŌĆō background concentrations are measured at the station Brno-Tu┼Öany, and ozone is measured in the city centre influenced by traffic loads at the station Brno-Zvona┼Öka. Ozone is a highly reactive molecule readily reacting with most substances in the air. Therefore the highest concentrations of ground-level ozone are measured in clean localities with low concentrations of other pollutants. On the contrary, the most loaded (traffic) localities measure the lowest concentrations of ground-level ozone. Ozone reactivity is demonstrated also in the measured concentrations in the territory of the Brno agglomeration. While the locality Brno-Zvona┼Öka does not exceed the limit value (the 26th highest 8-hour running average in 2012 reached 105.7 ╬╝g.m-3), in the locality Brno-Tu┼Öany the 26th highest 8-hour running average reached 124 ╬╝g.m-3. Conclusion As concerns ambient air quality, there is a major problem in the Brno agglomeration, and namely with traffic, resp. with the presence of pollutants in the ambient air, caused in the most part by traffic. With regard to the location of Brno as the highway intersection including a high percentage of transit transport passing through the city centre, this problem will not be probably solved in the near future. First, similarly as in Prague, it will be necessary to invest in bypasses (displacement of emissions out of the city centre and their marked reduction as a result of smoother traffic flow) and thereafter take further traffic and organizational measures until the situation improves. The situation out of the city centre is a little better, the exceedances of the limit values in the background localities such as Brno-L├Ł┼Īe┼ł, Brno-Sob─ø┼Īice or Brno-Tu┼Öany occur only in the years with longer periods with unfavourable dispersion conditions. The Brno agglomeration does not meet the limit values as concerns suspended particles (both PM10 and PM2.5), nitrogen dioxide and benzo(a)pyrene. All these pollutants are closely connected with traffic in the Brno agglomeration. These substances also have their contribution in the definition of the areas with deteriorated air quality. Other pollutants listed in the legislation [1] comply with the limit values. In case of sulphur dioxide (both daily and hourly limit values), carbon monoxide, lead, arsenic, cadmium and nickel the concentrations even remain below the lower assessment threshold in the long term. Benzene concentrations reach the levels close above the lower assessment threshold.
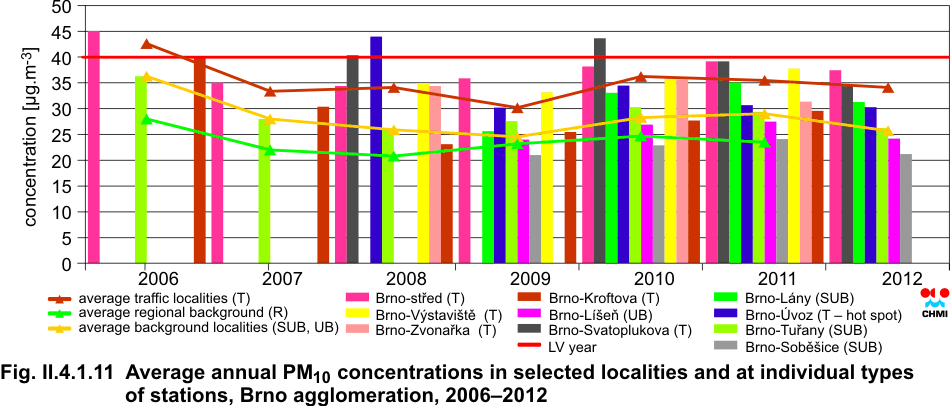
Fig. II.4.1.11 Average annual PM10 concentrations in selected localities and at individual types of stations, Brno agglomeration, 2006ŌĆō2012
Fig. II.4.1.12 Average monthly PM10 concentrations, Kucha┼Öovice, 2005ŌĆō2012
Fig. II.4.1.13 Average annual PM2.5 concentrations, Brno agglomeration, 2004ŌĆō2012
Fig. II.4.1.14 Number of exceedances of 24-hour PM10 limit value in selected localities and 36th highest 24-hour concentration of PM10 at individual types of stations, Brno agglomeration, 2006ŌĆō2012
Fig. II.4.1.15 Number of days with concentrations of PM10 > 50 ╬╝g.m-3 in individual months, incl. total number of exceedances, Brno agglomeration, 2012
Fig. II.4.1.16 Trend of hourly PM10 and NO concentrations in the locality Brno-st┼Öed, division into weekdays and weekends, averages for the years 2005ŌĆō2012
Fig. II.4.1.17 Average annual NO2 concentrations in selected localities and at individual types of stations, Brno agglomeration, 2006ŌĆō2012
Fig. II.4.1.18 Average annual benzo(a)pyrene concentrations, Brno agglomeration, 2006ŌĆō2012
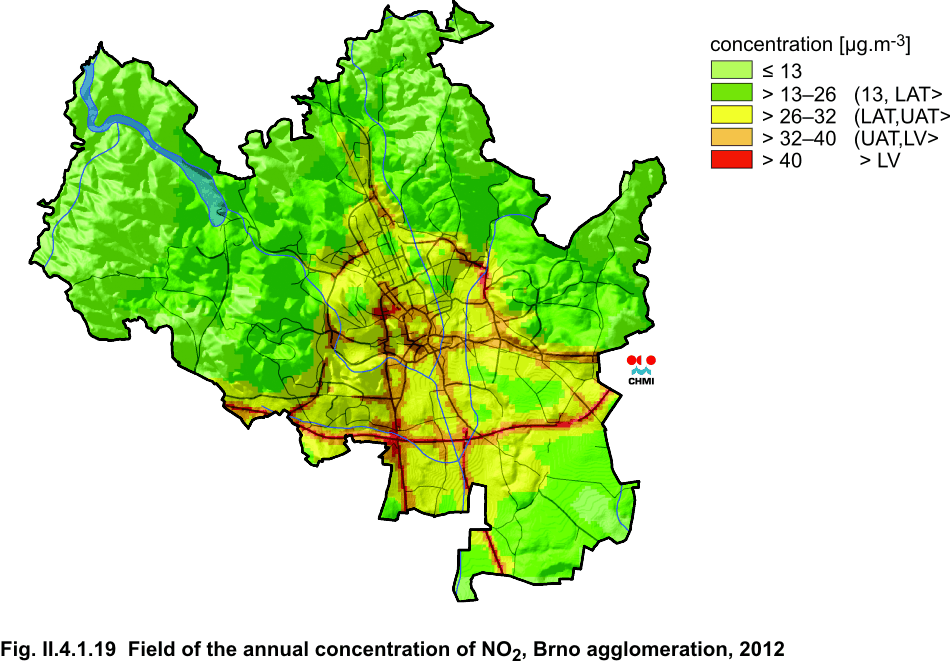
Fig. II.4.1.19 Field of the annual concentration of NO2, Brno agglomeration, 2012
Fig. II.4.1.20 Field of the 36th highest 24-hour concentration of PM10, Brno agglomeration, 2012
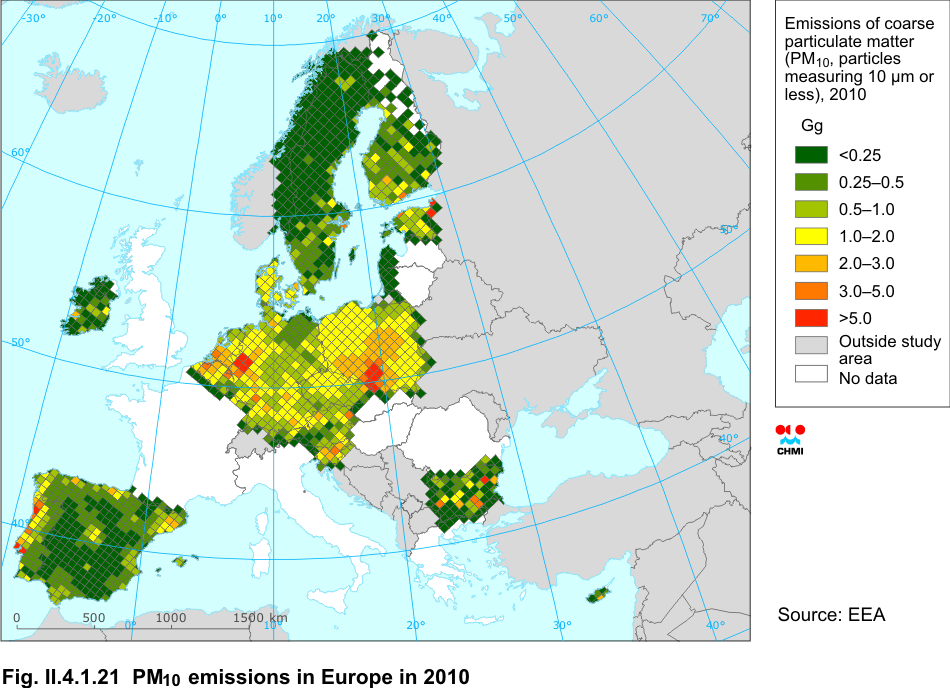
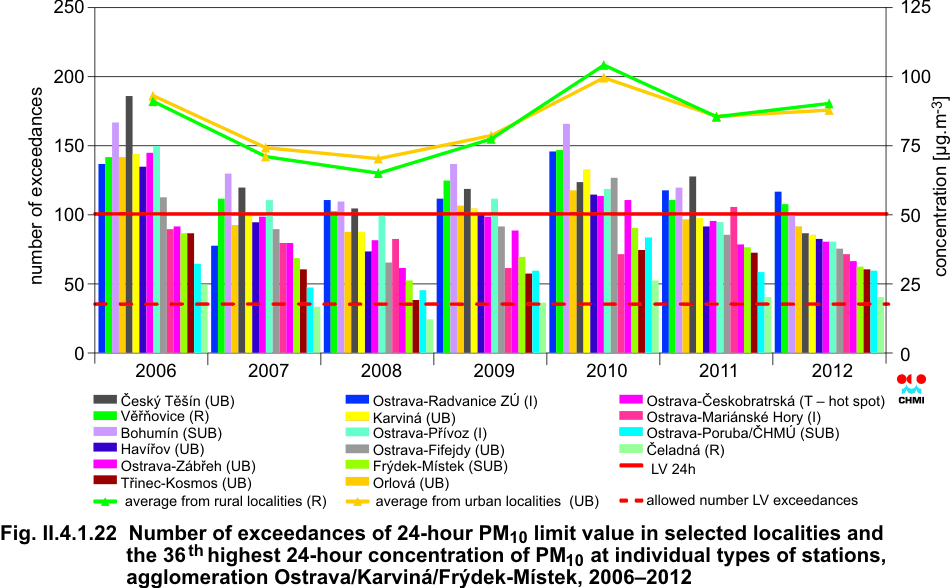
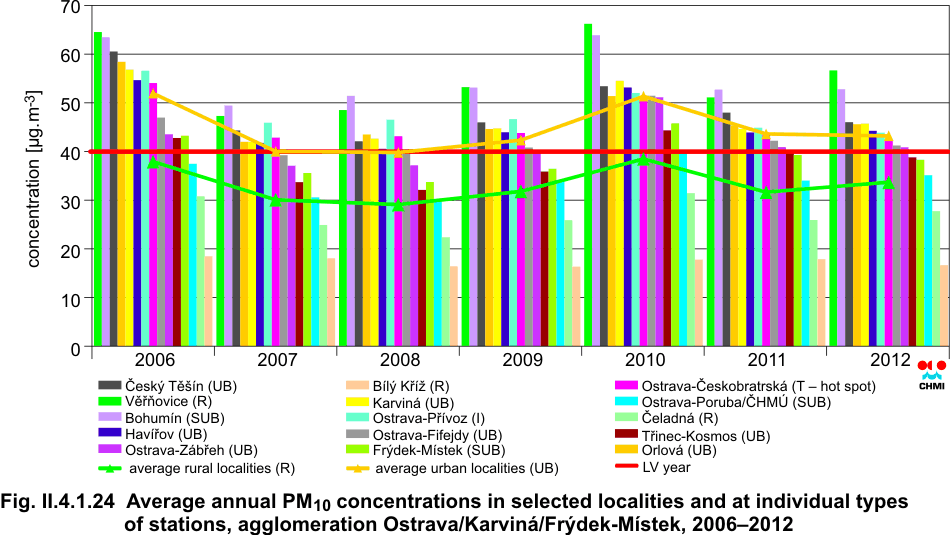
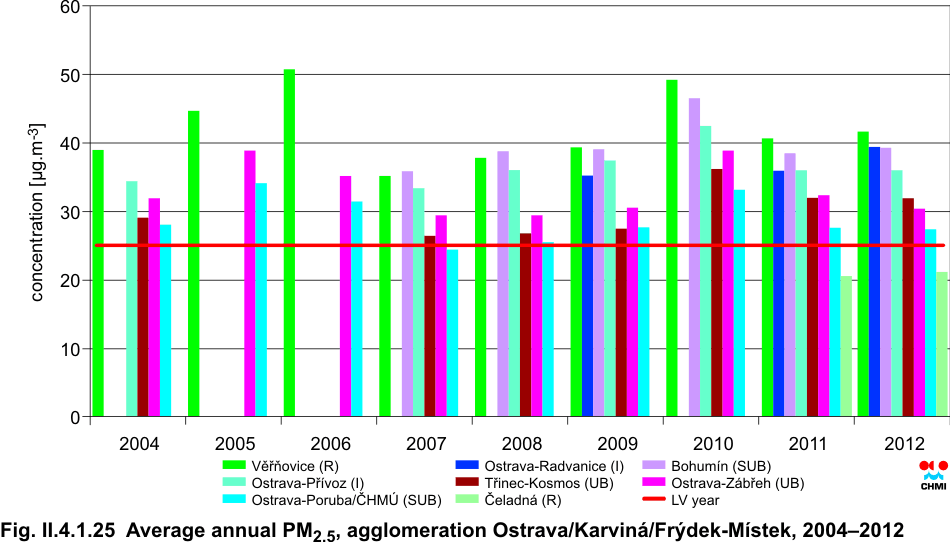
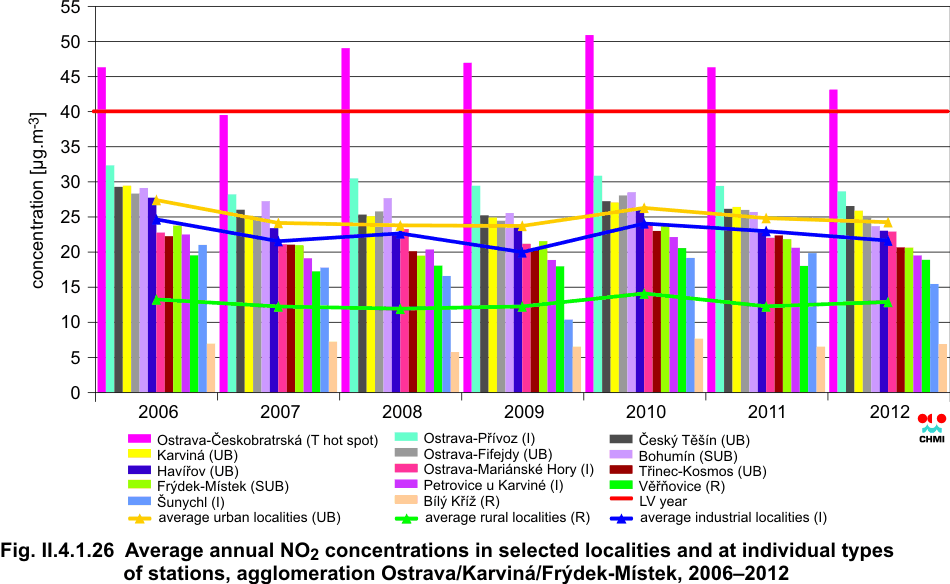
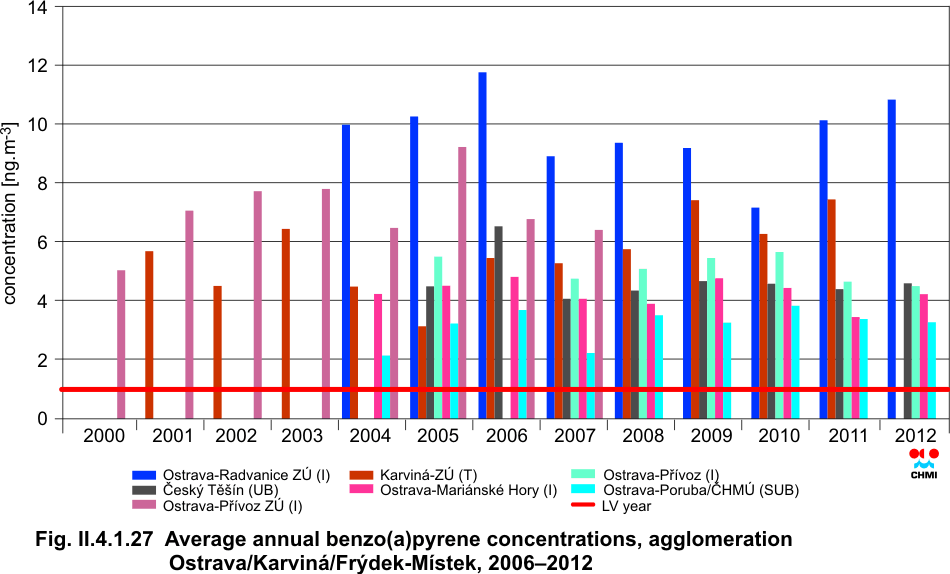
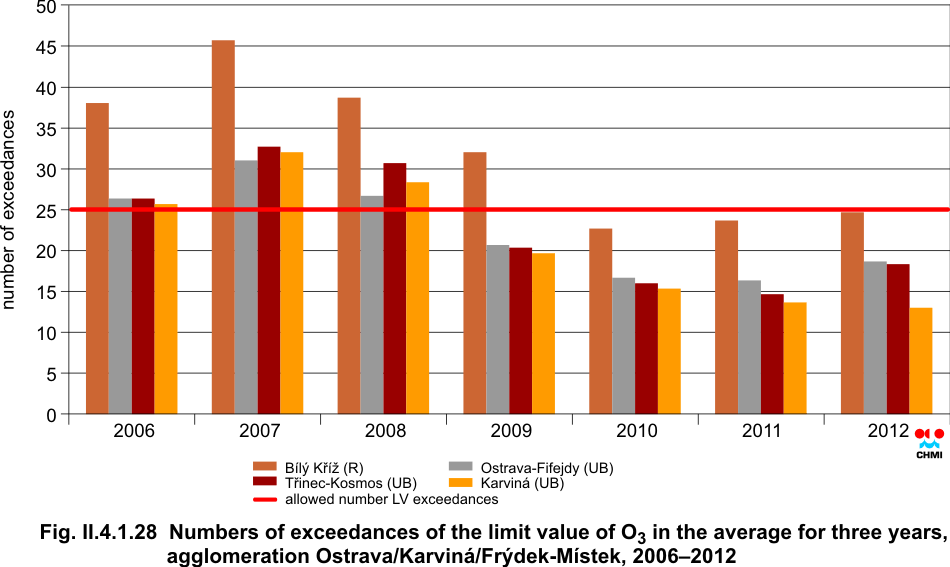
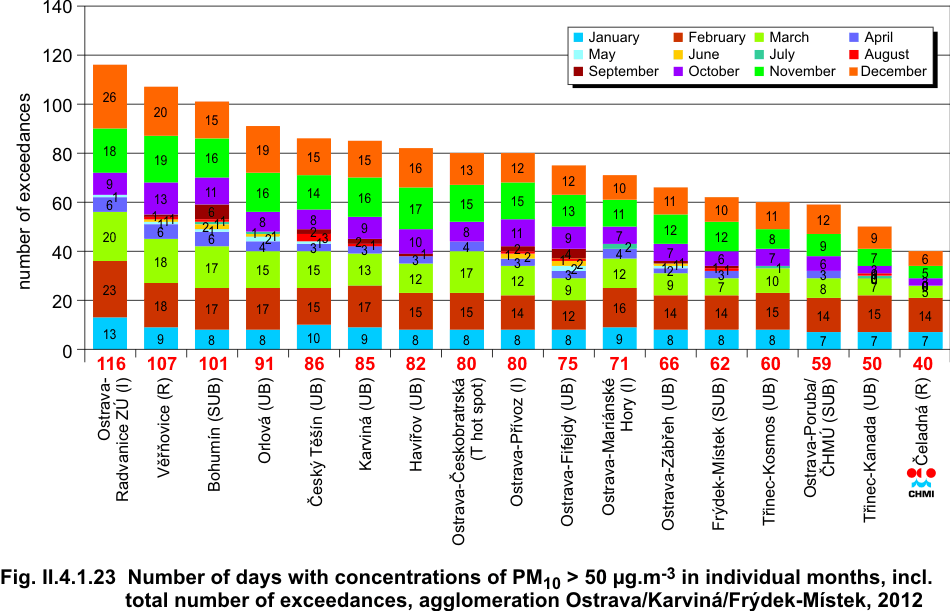
Characteristic of the agglomeration The agglomeration Ostrava/Karvin├Ī/Fr├Įdek-M├Łstek is one of the areas with most polluted ambient air within Europe. A large number of both industrial and municipal sources are concentrated there, and it is the area with very dense road network. Emissions recorded in this area, along with the emissions in the neighbouring Polish region of the Silesian Voivodship, reach the highest levels in Europe (Fig. II.4.1.21). Air quality is also significantly influenced by transboundary air pollution between the Czech Republic and the Polish Republic. There are numerous programmes and initiatives aimed at the improvement of air quality in the agglomeration. The dense network of monitoring stations in the area includes the measurement in 24 localities. The concentrations of most pollutants measured in 2012 remained at similar level as in 2011, the concentrations of PM10 and PM2.5 suspended particles and of benzo(a)pyrene reach above-the-limit levels in the long term in most localities. The above-the-limit annual concentration of NO2 was measured only in the traffic hot-spot locality in Ostrava, the above-the-limit concentration of benzene in the industrial locality Ostrava-P┼Ö├Łvoz. The remaining localities in the Czech Republic recorded below-the-limit benzene concentrations (higher concentrations are connected there with industrial activities, mainly with coke production and chemical production). There continued the decreasing trend of ground-level ozone concentrations in the warm half of the year. Concentrations of PM10 and PM2.5 suspended particles In 2012 the number of days with exceedances of the daily limit value for PM10 suspended particles was higher than 35 days tolerated by legislation, and namely in all localities of the agglomeration (Fig. II.4.1.22). It ranged from 40 days in ─īeladn├Ī to 116 days in Ostrava-Radvanice. Thus in this industrial locality and also near the border with Poland in the Karvin├Ī area (V─ø┼Ö┼łovice, Petrovice u Karvin├®, Bohum├Łn) the daily limit value 50 ╬╝g.m-3 was exceeded in the average almost every third day in the year; the exceedances occurred mainly in the cold periods of the year (Fig. II.4.1.23). In 2012 the number of days exceeding the daily limit value slightly decreased as compared with the year 2011. In 2012 individual localities recorded from 15 to 54 days with average daily value 100 ╬╝g.m-3 (double daily limit value) and from 8 to 26 days with the average daily value 150 ╬╝g.m-3 (triple daily limit value). In 2012 the average annual concentration of PM10 suspended particles reached the above-the-limit values at all urban automated stations in Ostrava and Karvin├Ī area, similarly as in the year 2011. Concentrations lower than the annual limit value 40 ╬╝g.m-3 were measured only in T┼Öinec, Fr├Įdek-M├Łstek, Ostrava-Poruba and in the background localities in the Beskydy Mts. (Fig. II.4.1.24). In 2012 continued the measurement of PM10 suspended particles with the use of samplers financed from the budget of the Moravian-Silesian Region, and namely in the background localities affected by industry Petrovice u Karvin├® O├Ü and D┼»l ─īSA u Karvin├®. Both localities recorded the above-the-limit annual values of PM10. The annual average concentrations of PM2.5 suspended particles exceed the annual limit value 25 ╬╝g.m-3 every year in the whole agglomeration in all measuring localities with the exception of the rural locality ─īeladn├Ī. In 2012 the level of concentrations was comparable with the previous year 2011, i.e. it was slightly higher than in the most favourable years 2007 and 2008 (Fig. II.4.1.25). Smog warning and regulatory system in the territory of the Moravian-Silesian Region (agglomeration Ostrava/Karvin├Ī/Fr├Įdek-M├Łstek) Smog warning and regulatory system (SVRS) is used both for informing on the occurrence of the situation with increased concentrations of pollutants in the ambient air and for the regulation (limitation) of pollutants released from the sources significantly influencing ambient air quality in the given territory. Due to the above-the-limit concentrations of PM10 suspended particles warning signals were announced three times in the Ostrava-Karvin├Ī area and once in the T┼Öinec area during the first three months of the year 2012 and within these situations the regulation signals were announced twice in both the above areas (the longest signal lasted 467 hours). Starting from 1 September 2012 the operation of SVRS is newly set by the Act No. 201/2012 Coll., on Clean Air Protection which brings the terms ösmog situationö and ōregulationö instead of ōwarning signalö and ōregulation signalö, and simultaneously the conditions for announcing and cancelling the signals have been changed. In the Ostrava-Karvin├Ī area 5 smog situations lasting 324 hours in total were announced, in the T┼Öinec area one smog situation was announced at the end of the year 2012. Concentrations of nitrogen dioxide (NO2) The year-to-year trend of average annual NO2 concentrations is not apparent. In 2012 the level of concentrations recorded in urban localities of the agglomeration ranged between 40 and 70 % of the annual limit value 40 ╬╝g.m-3. The limit was exceeded only in the traffic hot spot locality Ostrava-─īeskobratrsk├Ī, and namely in all assessed years of the period 2006ŌĆō2012, with the exception of the year 2007 (Fig. II.4.1.26). It can be expected that NO2 limit values are exceeded also in other sites exposed to traffic where there is no air pollution monitoring. Concentrations of benzo(a)pyrene All localities of the agglomeration measuring benzo(a)pyrene in PM10 record the multiple exceedances of the limit value 1 ng.m-3 in the long term, in the year 2012 the exceedances were threefold (Ostrava-Poruba) to tenfold (Ostrava-Radvanice). The measured concentrations stay approximately at the same level as in the previous years (Fig. II.4.1.27). The exceedance of the limit value was recorded also in the localities with measurements financed from the budget of the Regional Council of the Moravian-Silesian Region ŌĆō in Petrovice u Karvin├® O├Ü eightfold and in the locality D┼»l ─īSA u Karvin├® fivefold, which confirms the high loads in the border parts of the agglomeration. Concentrations of ground-level ozone (O3) The limit value of the maximum daily 8-hour O3 concentration 120 ╬╝g.m-3 in the average for three years for the protection of human health was not exceeded in 2012 in any locality of the agglomeration (the number of exceedances tolerated by legislation is 25 per year). Considering the mechanism of ozone formation the most frequent exceedances occurred in the rural mountain locality B├Łl├Į K┼Ö├Ł┼Š in the Beskydy Mts. (in average 24x), least frequent exceedances occurred in Karvin├Ī (15x), which is the urban locality influenced by traffic emissions, in which ozone is degraded through chemical reaction with NO (Fig. II.4.1.28). The long-term target set by the legislation, which does not allow even a single exceedance of the mentioned limit value, was however exceeded in all localities. The number of exceedances in the recent three years has a decreasing trend.
Fig. II.4.1.21 PM10 emissions in Europe in 2010
Fig. II.4.1.22 Number of exceedances of 24-hour PM10 limit value in selected localities and the 36th highest 24-hour concentration of PM10 at individual types of stations, agglomeration Ostrava/Karvin├Ī/Fr├Įdek-M├Łstek, 2006ŌĆō2012
Fig. II.4.1.23 Number of days with concentrations of PM10 > 50 ╬╝g.m-3 in individual months, incl. total number of exceedances, agglomeration Ostrava/Karvin├Ī/Fr├Įdek-M├Łstek, 2012
Fig. II.4.1.24 Average annual PM10 concentrations in selected localities and at individual types of stations, agglomeration Ostrava/Karvin├Ī/Fr├Įdek-M├Łstek, 2006ŌĆō2012
Fig. II.4.1.25 Average annual PM2.5 concentrations, agglomeration Ostrava/Karvin├Ī/Fr├Įdek-M├Łstek, 2004ŌĆō2012
Fig. II.4.1.26 Average annual NO2 concentrations in selected localities and at individual types of stations, agglomeration Ostrava/Karvin├Ī/Fr├Įdek-M├Łstek, 2006ŌĆō2012
Fig. II.4.1.27 Average annual benzo(a)pyrene concentrations, agglomeration Ostrava/Karvin├Ī/Fr├Įdek-M├Łstek, 2006ŌĆō2012
Fig. II.4.1.28 Numbers of exceedances of the limit value of O3 in the average for three years, agglomeration Ostrava/Karvin├Ī/Fr├Įdek-M├Łstek, 2006ŌĆō2012
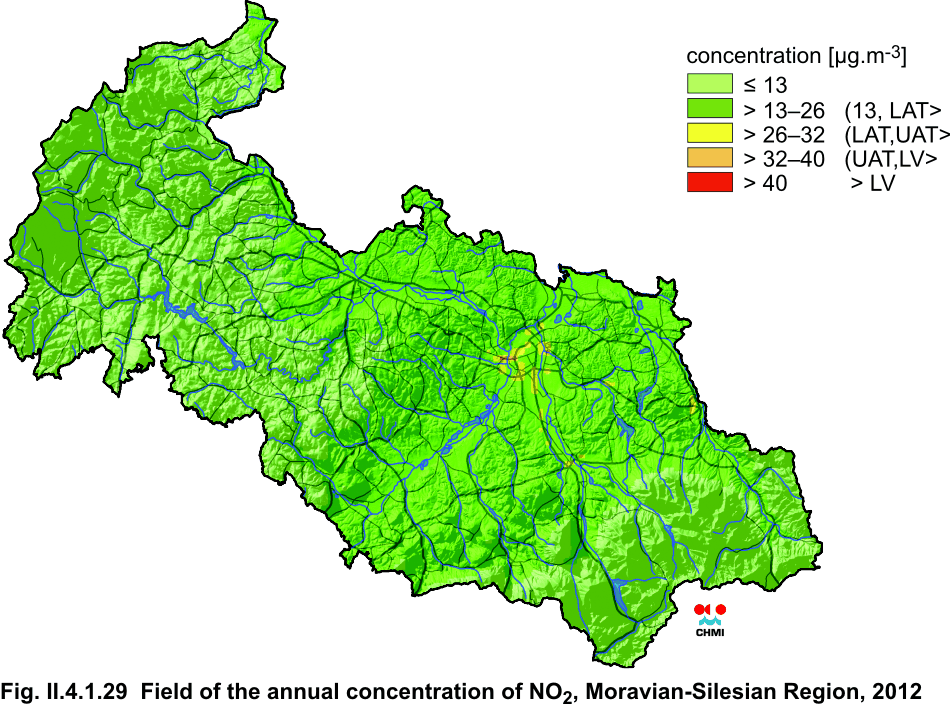
Fig. II.4.1.29 Field of the annual concentration of NO2, Moravian-Silesian Region, 2012
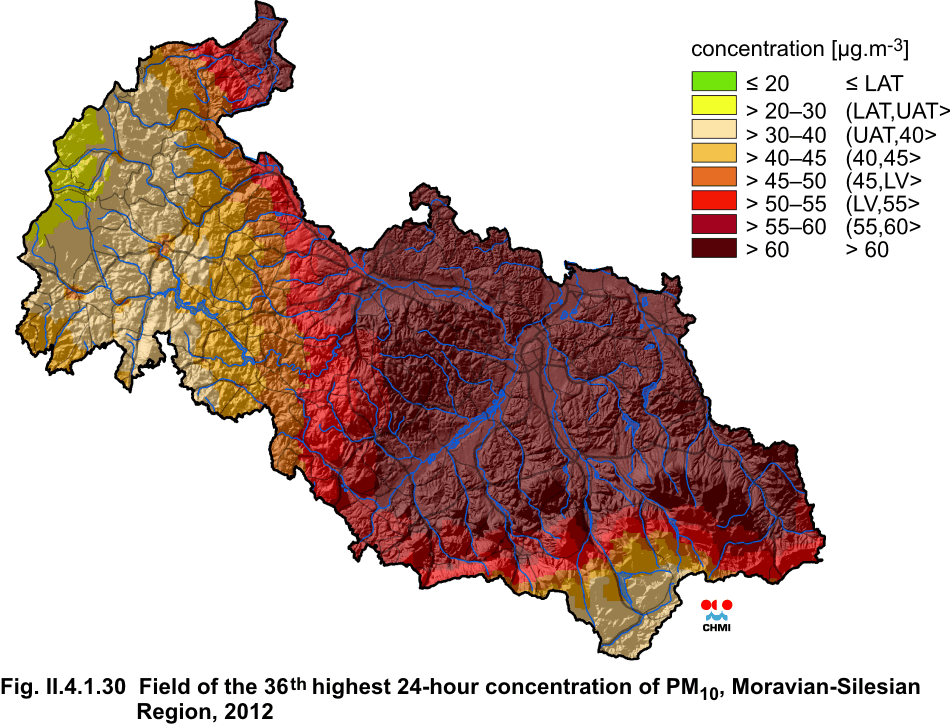
Fig. II.4.1.30 Field of the 36th highest 24-hour concentration of PM10, Moravian-Silesian Region, 2012
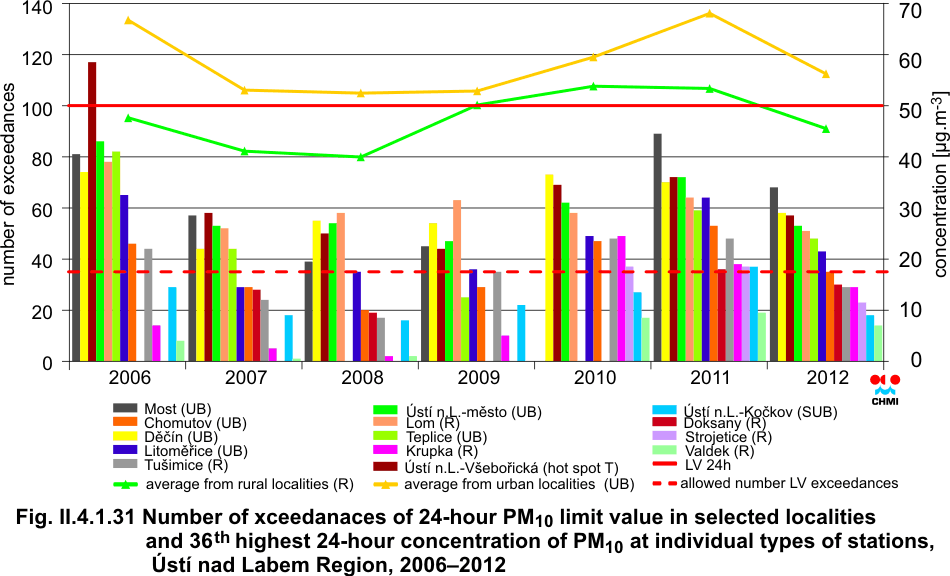
II.4.1.4 ├Üst├Ł nad Labem Region Characteristic of the zone The ├Üst├Ł nad Labem Region is characterized by a variety of both natural conditions and economic structure, as well as population density and the state of the environment. The economic significance of this region is historically predetermined by abundant mineral resources, mainly by large deposits of brown coal close to the surface. The brown coal basin is located in the foothills of the Ore Mts., it stretches from ├Üst├Ł nad Labem up to the city of Kada┼ł. Among further important raw materials mined in this region belong the deposits of high-quality sands for glass industry and stone for building industry. Within the region four main areas can be delineated, differing markedly from
each other. First, it is the area with highly developed industrial production
concentrated mainly in the foothils of the Ore Mts. ŌĆō Podkru┼Īnoho┼Ö├Ł (districts
Chomutov, Most, Teplice and partly ├Üst├Ł nad Labem) with the following branches:
energetics, coal mining, machinery, chemical industry and glass industry. The
second one includes the Litom─ø┼Öice area and the Louny area, both known for the
production of hops and vegetable. Especially the areas around the Labe river and
the Oh┼Öe river are famous fruit-growing regions called Zahrada ─īech (Garden of
Bohemia). Also famous became the wines grown in the Litom─ø┼Öice area and recently
also the Most area has become known for wine grown mainly in the recultivated
land where coal mining ended. The area of the Kru┼Īn├® hory Mts. is a very
scarcely populated mountainous belt with limited economic activities, and
finally, in the D─ø─Ź├Łn area there is neither heavy industry nor agriculture. Its
northern part aroud ┼Āluknov is a typically peripheral territory due to its
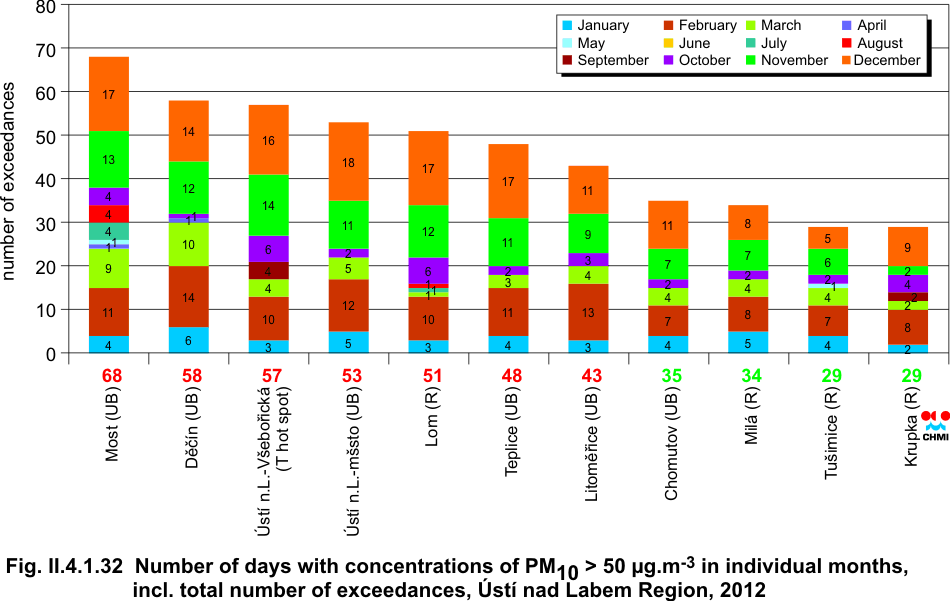
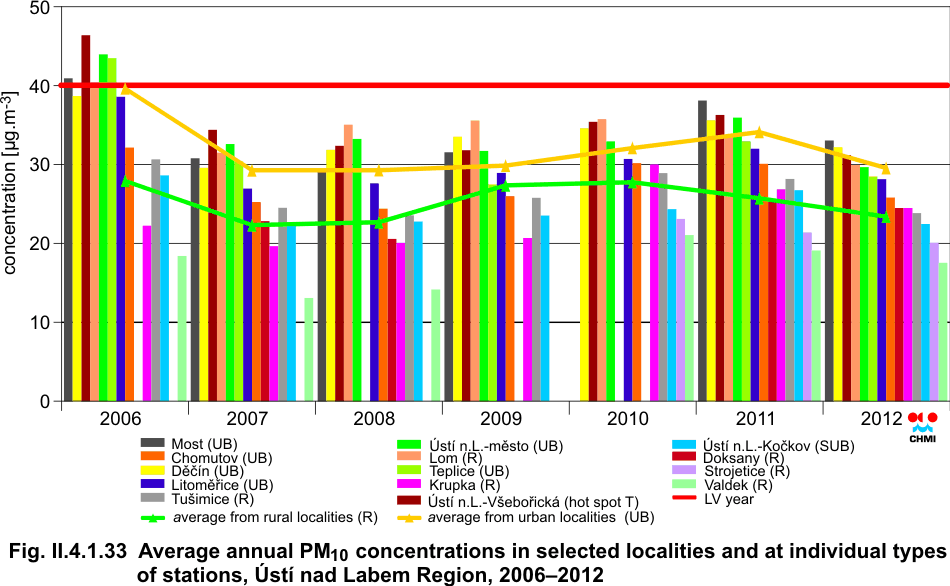
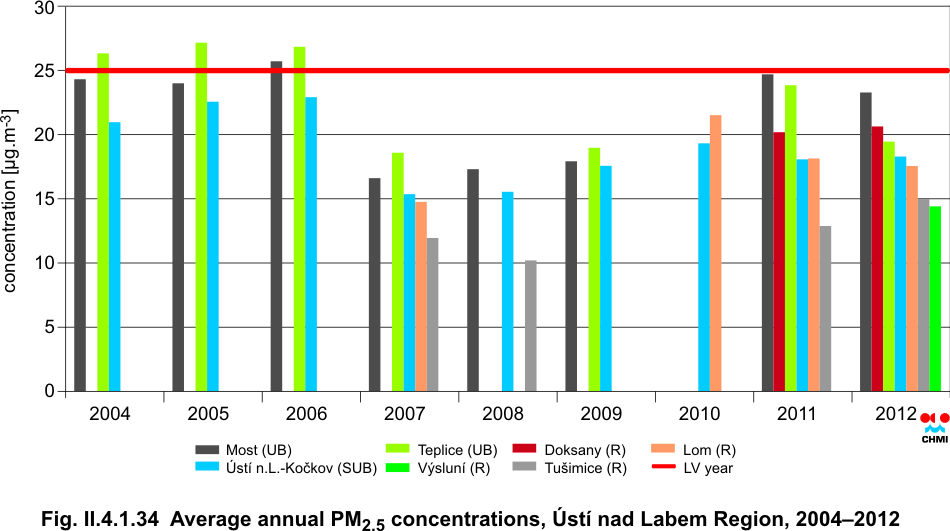
remoteness from the central part of the region and poor accessibility. Concentrations of suspended particles PM10 and PM2.5 The concentrations of PM10 suspended particles were measured in23 localities. The exceedance of the 24-hour limit value for PM10 was measured in 7 localities: Most (the limit value 50 ╬╝g.m-3 exceeded 68x), D─ø─Ź├Łn (58x), ├Üst├Ł nad Labem-V┼Īebo┼Öick├Ī hot spot (57x), ├Üst├Ł nad Labem-m─østo (53x), Lom (51x), Teplice (48x), Litom─ø┼Öice (43x). In comparison with the year 2011 (exceeded in16 localities) the number of localities with exceedances decreased (Fig. II.4.1.31). Also the individual localities recorded lower number of the days with LV exceedance. The order of the localities with regard to the numbers of LV exceedances has partly changed which is caused by local influences. The winters in these years were similar, but the summer periods in 2010 and 2011 were drier, which has impact on dustiness. The exceedance of the24-hour limit value occurrs most frequently in the winter months and it is connected with the respective meteorological and dispersion conditions having the greatest influence on PM10 concentration (Fig. II.4.1.32). There did not appear or ended any significant source of dust in the ├Üst├Ł nad Labem Region in 2012. In the period 2006ŌĆō2012 no clear trend can be indicated. The numbers of exceedances depend on meteorological situation and dispersion conditions; in some years the numbers of excedances are higher, in others lower. The years 2006, 2010 and 2011 rank among the unfavourable ones. In 2012 the annual limit value for PM10 was not exceeded in any station in the ├Üst├Ł nad Labem Region. The highest annual average PM10 concentration was measured at the station Most (33.0 ╬╝g.m-3), D─ø─Ź├Łn (32.2 ╬╝g.m-3), ├Üst├Ł nad Labem-V┼Īebo┼Öick├Ī (31.1 ╬╝g.m-3), Lom (29.9 ╬╝g.m-3) and ├Üst├Ł nad Labem-m─østo (29.6 ╬╝g.m-3). In comparison with the year 2011 the annual average concentrations in individual localities decreased. The annual average concentration in urban localities is 29.5 ╬╝g.m-3, in rural localities 23.4 ╬╝g.m-3 (Fig. II.4.1.33). In urban localities higher average of PM10 concentrations is caused by traffic, local heating and poor cleaning of roads and pavements. In rural areas mainly local heating and agriculture are the sources of PM10. PM2.5 particles were measured in seven localities in the ├Üst├Ł nad Labem Region, the exceedance of the annual average limit value (25 ╬╝g.m-3) was not recorded at any of these stations (Fig. II.4.1.34). At one urban station the values were close to the limit value 25 ╬╝g.m-3. The highest annual average concentration of PM2.5 was in the locality Most with the value 23.3 ╬╝g.m-3. Concentrations of NO2 In 2012 the concentration of NO2 in the ├Üst├Ł nad Labem Region was measured in 24 localities (14 localities operated by CHMI). None of the stations exceeded the annual and the 1-hour limit values in 2012. The highest annual average concentration of NO2 was measured in the locality ├Üst├Ł nad Labem-m─østo, where it reached the value 25.5 ╬╝g.m-3 (Fig. II.4.1.35). The station ├Üst├Ł nad Labem-V┼Īebo┼Öick├Ī, which is markedly influenced by traffic, reported the measurement failure and thus the annual average could not be calculated. As concerns the assessed period (2006ŌĆō2012) it can be stated that the annual average concentrations of NO2 stagnate. Individual stations record small deviations from the annual average concentration. This is most probably due to the ever improving engines and fuels, because the amount of vehicles is increasing and the transportation in general incl. transit is not decreasing in the ├Üst├Ł nad Labem Region. Concentrations of benzo(a)pyrene The concentrations of benzo(a)pyrene were measured in 4 localities (3x urban and 1x suburban). The limit value for annual average concentration was exceeded in two urban localities. (Teplice 2012 ŌĆō 1,2 ng.m-3, 2011 ŌĆō 1.1 ng.m-3, 2010 ŌĆō 1.2 ng.m-3, 2009 ŌĆō 1,0 ng.m-3 and ├Üst├Ł nad Labem-Z├Ü Pasteurova 2012 ŌĆō 1.1 ng.m-3, 2011 ŌĆō 1.8 ng.m-3, 2010 ŌĆō 1.6 ng.m-3, 2009 ŌĆō 1.7 ng.m-3, 2008 ŌĆō 1.5 ng.m-3, 2007 ŌĆō 1.3 ng.m-3). The annual average concentrations for the recent five years can be characterized, within small deviations, as stagnating (Fig. II.4.1.36). Concentrations of ground-level ozone The limit value for the protection of human health for ground-level ozone was
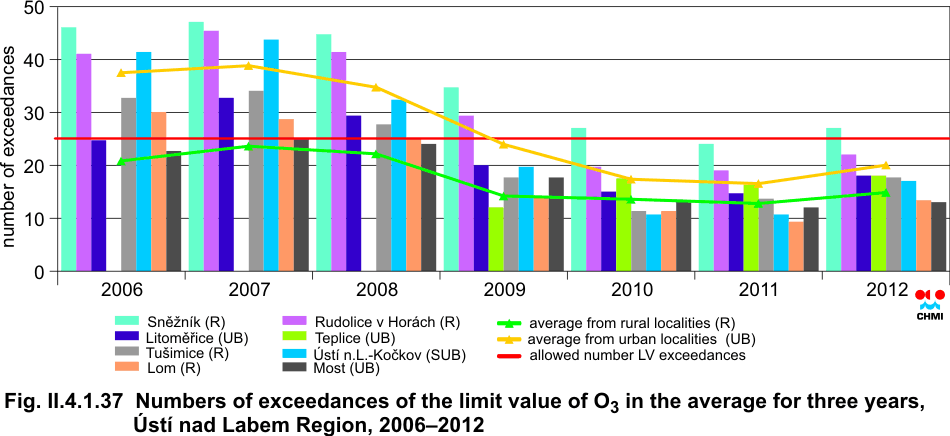
exceeded during the three-year period 2010ŌĆō2012 in one locality only, and namely
Sn─ø┼Šn├Łk (27x); the tolerated number of exceedances is 25. As compared with the
period 2009ŌĆō2011 the number of exceedances slightly increased in individual
stations (Fig. II.4.1.37). Ground-level ozone is measured in ten localities in
total (4 rural, 4 urban and 2 suburban). Similarly as in the whole territory of
the Czech Republic, also in the ├Üst├Ł nad Labem Region the maximum daily 8-hour
running average concentrations in the three-year average have been exceeded in
recent years; the decrease was recorded in all localities. During the recent two
years the difference between the numbers of exceedances in urban and rural
localities became markedly lower. The limit value for the protection of
ecosystems for ground-level ozone (AOT40 exposure index) has a similar character;
for the first time within the period 2008ŌĆō2012 it was not exceeded at any
station in comparison with the previous year when the exceedance was recorded at
the station Sn─ø┼Šn├Łk by about o 3%. Conclusion In 2012 sulphur dioxide was measured at 25 stations. Sulphur dioxide concentrations did not exceed the limit value at any station, both as concerns the protection of health (tolerated number of exceedances for the 24-hourlimit value is 3x/year, the tolerated number of exceedances for 1-hour limit value is 24x/year), and for the protection of ecosystems (the annual average concentration and the winter period). Benzene is measured at 5 stations and the annual limit value (5 ╬╝g.m-3) was not exceeded at any of them. The highest value was measured at the station ├Üst├Ł nad Labem-V┼Īebo┼Öick├Ī, and namely 1.9 ╬╝g.m-3. In general, the concentrations measured at the stations reflect the location of the stations and their values reach one half of the limit value at the maximum. Heavy metals (lead, arsenic, cadmium and nickel in SPM) are measured at three stations and none of them exceeded its respective annual limit value. The concentrations of all metals have a decreasing trend at all stations. In total air pollution concentrations in 2012 in the territory of the ├Üst├Ł nad Labem region were comparable with the previous years. The slight improvement as compared with the year 2011 was recorded only in the exceedances of the 24-hour limit value for PM10 and AOT40 exposure index.
Fig. II.4.1.31 Number of xceedanaces of 24-hour PM10 limit value in selected localities and 36th highest 24-hour concentration of PM10 at individual types of stations, ├Üst├Ł nad Labem Region, 2006ŌĆō2012
Fig. II.4.1.32 Number of days with concentrations of PM10 > 50 ╬╝g.m-3, ├Üst├Ł nad Labem Region, 2012
Fig. II.4.1.33 Average annual PM10 concentrations in selected localities and at individual types of stations, ├Üst├Ł nad Labem Region, 2006ŌĆō2012
Fig. II.4.1.34 Average annual PM2.5 concentrations, ├Üst├Ł nad Labem Region, 2004ŌĆō2012
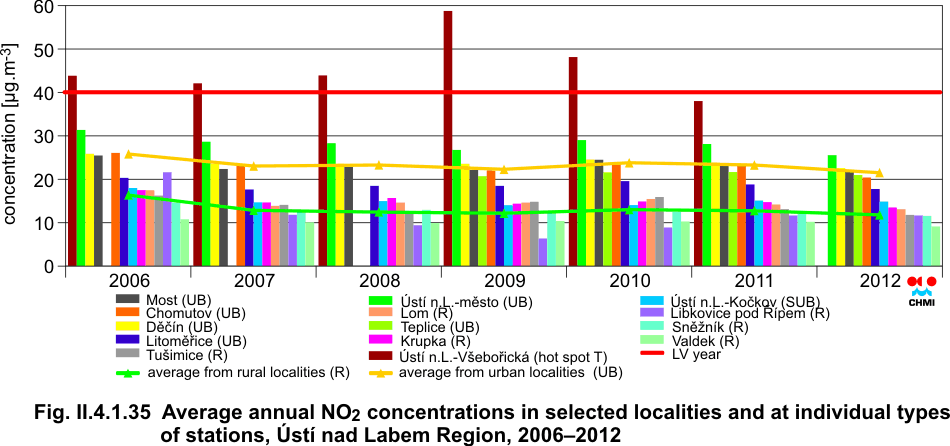
Fig. II.4.1.35 Average annual NO2 concentrations in selected localities and at individual types of stations, ├Üst├Ł nad Labem Region, 2006ŌĆō2012
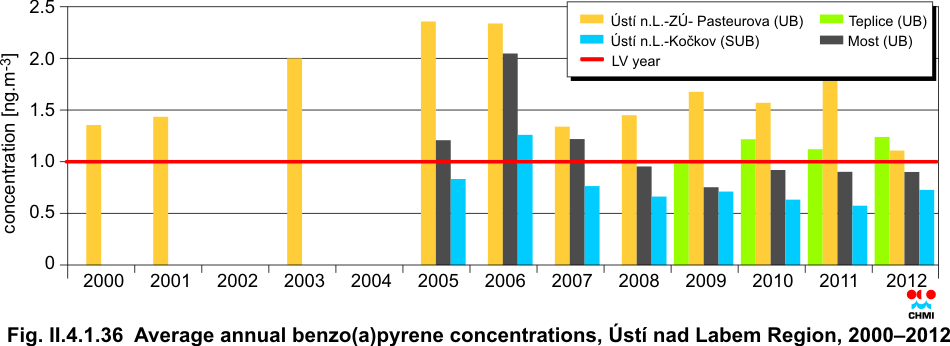
Fig. II.4.1.36 Average annual benzo(a)pyrene concentrations, ├Üst├Ł nad Labem Region, 2006ŌĆō2012
Fig. II.4.1.37 Numbers of exceedances of the limit value for O3 in the averge for three years, ├Üst├Ł nad Labem Region, 2006ŌĆō2012
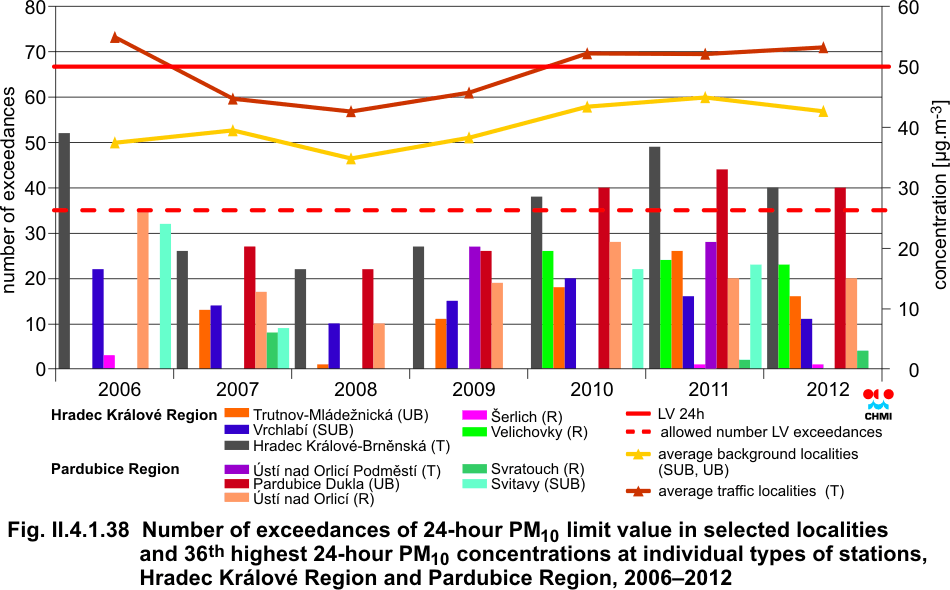
II.4.1.5 The Hradec Kr├Īlov├® Region and the Pardubice Region Characteristic of the area The Hradec Kr├Īlov├® Region is an agro-industrial area with developed tourism. The northeastern part of the region in the Krkono┼Īe Mts. and Orlick├® hory Mts. is less densely populated, without significant sources of air pollution as concerns emission loads. The most populous part of the region is the Hradec Kr├Īlov├® district. Large stationary sources of emissions are concentrated in larger cities and they are represented mainly by companies supplying energy asnd heat for public ŌĆō ─īEZ, a.s., Praha, power plant Elektr├Īrna Po┼Ö├Ł─Ź├Ł II, KA ŌĆō Contracting ─īR s.r.o., heating plant Tepl├Īrna N├Īchod and ─īEZ, a.s. Praha, heating plant Tepl├Īrna Dv┼»r Kr├Īlov├®. At present, continuously increasing traffic is definitely the dominant source of emissions in the territory of the region, and further local heating, and ambient air quality is also influenced by transfer of pollution from the neighbouring industrial Pardubice Region. The Pardubice Region is an industrial-agricultural area. There are several significant large stationary sources of ambient air pollution, and namely ─īEZ, a.s. power plant Elektr├Īrna Chvaletice, International Power Opatovice, a.s. Opatovice nad Labem, cement factory Holcim (─īesko), a.s. Prachovice and chemical industry (SYNTHESIA, a.s., Semt├Łn, PARAMO, a.s. Pardubice). These sources influence ambient air quality also in the surrounding areas. The most polluted parts of the region as concerns emissions include the territory of the Pardubice district. The least loaded territories include the area in the central and northern part of the ├Üst├Ł nad Orlic├Ł district and in the southern part of the Chrudim district. The share of large sources of ambient air pollution in total emissions of the region is crucial in case of sulphur dioxide and nitrogen oxides, in case of particulate matter and carbon monoxide the decisive role is played by traffic followed by local heating. In 2006ŌĆō2011 CO, VOC and NOx emissions decreased in the
Hradec Kr├Īlov├® Region and starting from 2007 also in the Pardubice Region. In
comparison with the year 2010 the emissions of SO2 and NH3 decreased slightly as
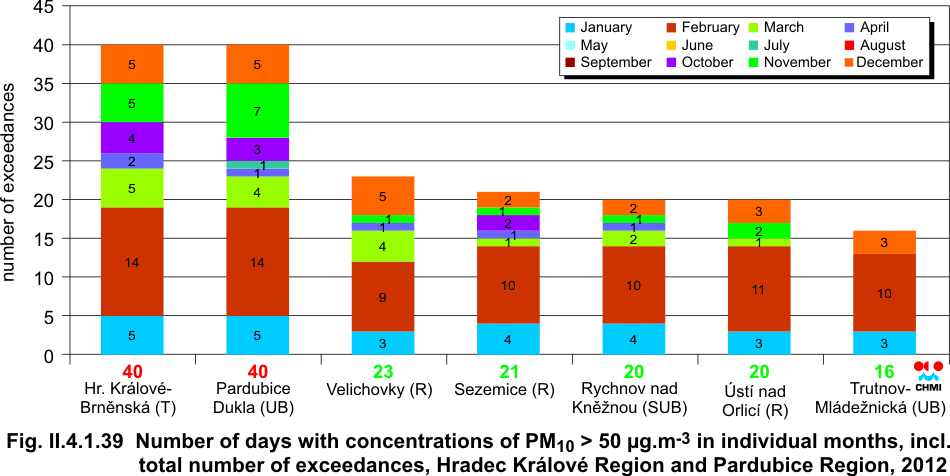
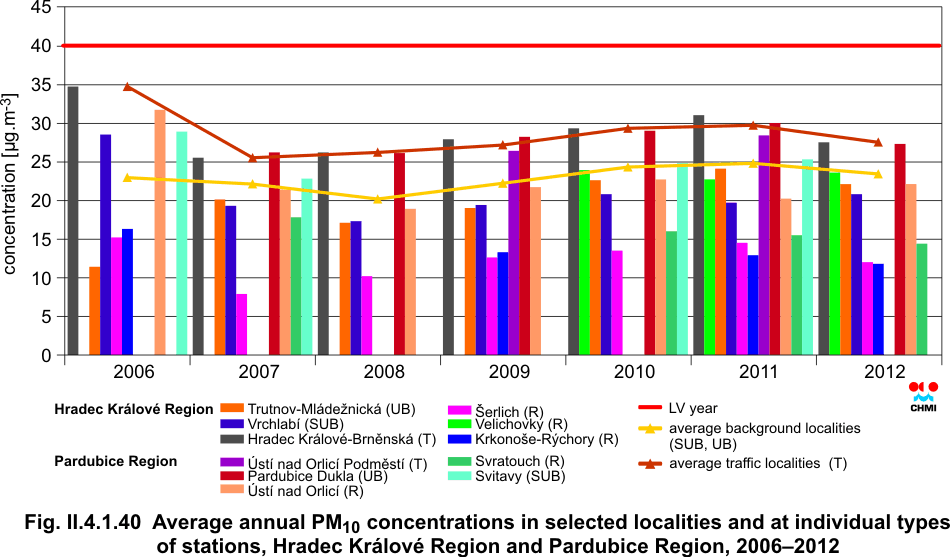
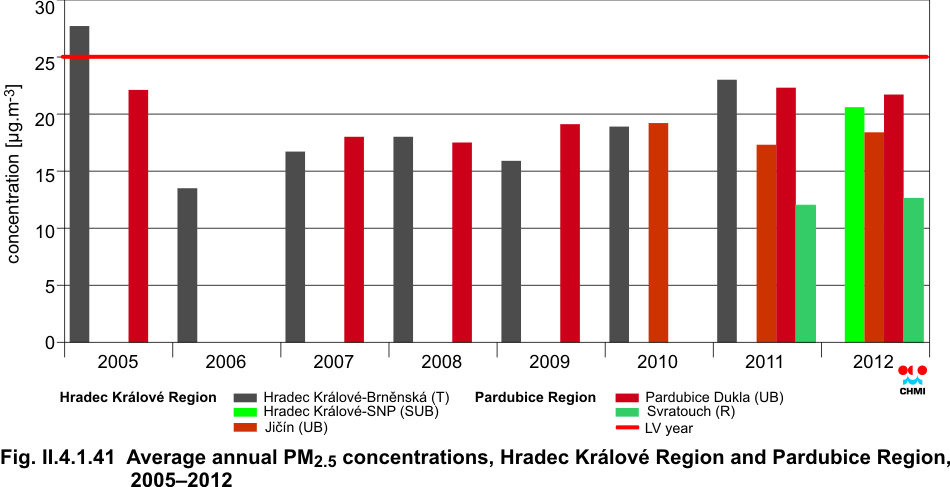
well as emissions of particulate matter in both assessed regions. Concentrations of PM10 and PM2.5 suspended particles The measurement of concentrations of PM10 suspended particles was carried in 2012 in 9 localities in the Hradec Kr├Īlov├® Region and in 7 localities in the Pardubice Region. The exceedance of the 24-hour limit value for PM10 50 ╬╝g.m-3 (the maximum tolerated number of exceedances is 35x per year) was measured at the stations of automated monitoring Hradec Kr├Īlov├®-Brn─ønsk├Ī (40x) and Pardubice-Dukla (40x). The number of exceedances is lower than in the previous year 2011. The highest frequency of the limit value exceedances was recorded during the month of February and further in other winter months, which is connected with deteriorated dispersion conditions in the cold part of the year where inversions occur more frequently. The highest concentrations of PM10 suspended particles were measured on 13. 2. 2012 (Pardubice-Dukla 218.0 ╬╝g.m-3 and Hradec Kr├Īlov├®-Brn─ønsk├Ī 182.0 ╬╝g.m-3). At the same time significant increase of concentrations of suspended particles was recorded in this period at all other stations of the Hradec Kr├Īlov├® Region and the Pardubice Region. This period of step-by-step increase of concentrations lasted from 24 January to 15 February 2012. The maximum values were reached in the period 12ŌĆō14 February 2012. The limit value for annual average concentrations of PM10 has not been exceeded at any station since 2007. In 2012 the annual average concentrations of PM10 suspended particles measured at the traffic station Hradec Kr├Īlov├®-Brn─ønsk├Ī and urban background stations (Pardubice-Dukla and Trutnov-Ml├Īde┼Šnick├Ī) show a slight decrease as againt the years 2010 and 2011. In 2012 the concentrations of PM2.5 suspended particles were measured in 4 localities in the Hradec Kr├Īlov├® Region. There was launched the new manual measurement of PM2.5 at the station Hradec Kr├Īlov├®-t┼Ö. SNP. This measurement was shifted from the station Hradec Kr├Īlov├®-Brn─ønsk├Ī, where monitoring of PM2.5 concentrations goes on continually. The measurement in the Pardubice Region was carried out in two localities. None of the stations of the Hradec Kr├Īlov├® Region and Pardubice Region exceeded the annual limit value for PM2.5 particles in 2012. The concentrations show the stagnating trend similar to the two previous assessed years 2010 and 2011. The highest annual average concentrations of PM2.5 were measured at the stations Pardubice-Dukla (21.7 ╬╝g.m-3) and Rychnov nad Kn─ø┼Šnou (21.0 ╬╝g.m-3). The third highest level of pollution caused by PM2.5 particles was measured at the new station Hradec Kr├Īlov├®-t┼Ö. SNP (20.6 ╬╝g.m-3). Concentrations of NO2 Concentrations of nitrogen dioxide (NO2) were monitored at 8
stations in total in the Hradec Kr├Īlov├® Region and at 7 stations in the
Pardubice Region in 2012. On 30 September 2012 the manual measurement (3
stations in each of the both regions) was put to an end due to the optimization
of the monitoring network and the measurements from these stations thus cannot
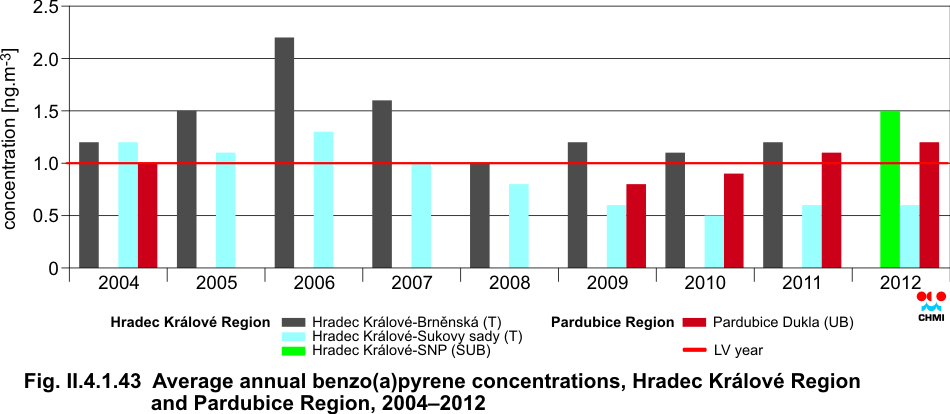
be included in the assessment for the whole year. Concentrations of benzo(a)pyrene Concentrations of benzo(a)pyrene are measured at the traffic station Hradec Kr├Īlov├®-Sukovy sady and at the urban background station Pardubice-Dukla. The measurement from the traffic station Hradec Kr├Īlov├®-Brn─ønsk├Ī was shifted to the urban background station Hradec Kr├Īlov├®-t┼Ö. SNP starting from the beginning of the year 2012. The station Hradec Kr├Īlov├®-Brn─ønsk├Ī has recorded the
exceedance of the annual limit value for benzo(a)pyrene continuously since 2004.
After shifting the station to the locality Hradec Kr├Īlov├®-t┼Ö. SNP the measured
annual average concentration exceeded the limit value as well, and the value 1.5
ng.m-3 is the highest annual average of all the above mentioned stations.
Similarly as in 2011 the limit value was exceded again also at the station
Pardubice-Dukla, due to the measured value 1.2 ng.m-3. The exceedances of the
limit value is influenced mainly by increased concentrations of benzo(a)pyrene
in the winter period connected with local heating. Concentrations of O3 In 2012 the concentrations of the ground-level ozone were
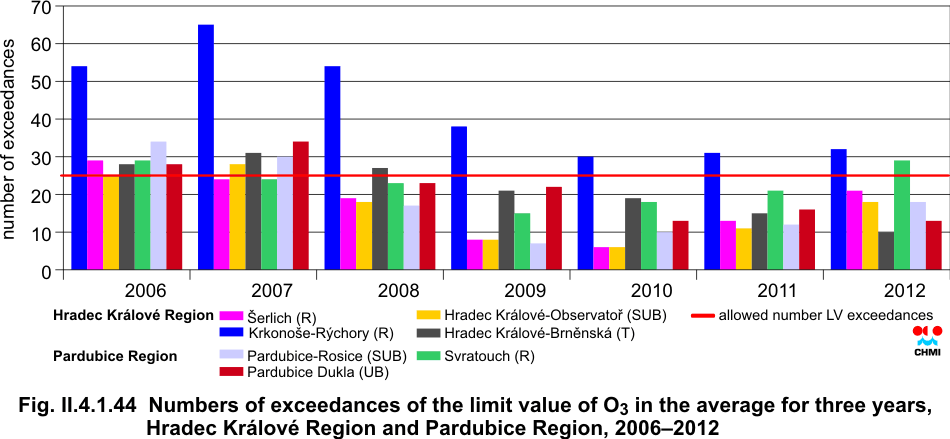
measured at 5 localities in the Hradec Kr├Īlov├® Region and in 3 localities in the
Pardubice Region. The limit value for the protection of human health (the number
of exceedances in the average for 3 years higher than 25x) was exceeded at the
station Krkono┼Īe-R├Įchory (32x), where the limit value has been exceded regularly
since 2006. The limit value was exceeded also at the station Svratouch (29x),
where the last previous exceedance of the limit value occurred in 2008. At the
same time this is the highest number of exceedances at this station starting
from 2006. Conclusion In 2012 the pollutants concentrations in the territory of the Hradec Kr├Īlov├® Region and the Pardubice Region have on the whole a stable character similar to that of 2011. The stagnating trend has been apparent in NO2 concentrations for several years already. The 24-hour limit value 50 ╬╝g.m-3 (maximum number of exceedances = 35x per year) for the concentration of PM10 particles was exceeded at the station Hradec Kr├Īlov├®-Brn─ønsk├Ī and Pardubice-Dukla. The stations Hradec Kr├Īlov├®-Brn─ønsk├Ī, Pardubice-Dukla and Trutnov-Ml├Īde┼Šnick├Ī recorded the decrease of both the values of annual averages and the number of limit value exceedances as compared with the previous year 2011; and thus reach approximately the level of the year 2010. The PM10 concentrations measured at other suburban and rural background stations have remained approximately comparable with the previous 2 years. Similar situation is in suspended particles of PM2.5 fraction. The annual limit value for benzo(a)pyrene was exceeded at the station Hradec Kr├Īlov├®-t┼Ö. SNP. There was measured even higher value than that monitored in the previous years at the station Hradec Kr├Īlov├®-Brn─ønsk├Ī. Similarly as in 2011 the limit value for benzo(a)pyrene was exceeded at also the station Pardubice-Dukla. The increase of concentrations is apparent at rural and background stations monitoring the concentrations of ground-level ozone. Since 2010 the number of exceedances of the limit value for the protection of human health has been increasing. The maximum tolerated number of exceedances per one year was exceeded at the station Krkono┼Īe-R├Įchory and at the station Svratouch. On the contrary, at the stations influenced by traffic, the number of exceedances lowered in comparison with the previous year. The average annual concentrations of benzene in 2012 at the station Hradec Kr├Īlov├®-Brn─ønsk├Ī were 1.0 ╬╝g.m-3 and at the station Pardubice-Dukla 0.9 ╬╝g.m-3, i.e. they do not reach the level of the annual limit value for the protection of human health. The levels of average annual concentrations of heavy metals do not exceed the annual limit values. The highest levels of these concentrations are measured at the new station Hradec Kr├Īlov├®-t┼Ö. SNP, where there were recorded the highest concentrations of lead, cadmium, nickel and arsenic of the stations measuring heavy metals in the territory of the Hradec Kr├Īlov├® Region and the Pardubice Region. Higher levels were measured at the station Hradec Kr├Īlov├®-Sukovy sady, influenced by traffic, and at the station Pardubice-Dukla. The second highest concentrations of lead were recorded at the station ├Üst├Ł nad Orlic├Ł-Podm─øst├Ł, similarly as in the year 2011. In 2012 the limit value concentrations of sulphur dioxide were exceeded extraordinarilly at the station Pardubice-Dukla. The hourly limit value 350 ╬╝g.m-3 with the maximum tolerated number of exceedances 24x per year was exceeded 7x at this station. The highest hourly SO₂ concentration was measured on 15. 3. 2012 (655.1 ╬╝g.m-3). The 24-hour limit value 125 ╬╝g.m-3 was exceeded on 14. 3. 2012, the concentration reached 149.9 ╬╝g.m-3. It was an exceptional situation caused by the increase of SO2 emissions due to non-standard operation of the local industrial air pollution source. These extremely increased values of SO2 concentrations lasted for the period 11. 3. 2012ŌĆō2. 4. 2012. No other station reported the exceedance of the limit value for SO2. Carbon monoxide was measured in 2012 at the traffic stations Hradec Kr├Īlov├®-Brn─ønsk├Ī and Hradec Kr├Īlov├®-Sukovy sady, in the Pardubice Region at the station Pardubice-Dukla. The 8-hour running average for the protection of human health was not exceeded at any station.
Fig. II.4.1.38 Number of exceedances of 24-hour PM10 limit value in selected localities and 36th highest 24-hour PM10 concentrations at individual types of stations, Hradec Kr├Īlov├® Region and Pardubice Region, 2006ŌĆō2012
Fig. II.4.1.39 Number of days with concentrations of PM10 > 50 ╬╝g.m-3 in individual months, incl. total number of exceedances, Hradec Kr├Īlov├® Region and Pardubice Region, 2012
Fig. II.4.1.40 Average annual PM10 concentrations in selected localities and at individual types of stations, Hradec Kr├Īlov├® Region and Pardubice Region, 2006ŌĆō2012
Fig. II.4.1.41 Average annual PM2.5 concentrations, Hradec Kr├Īlov├® Region and Pardubice Region, 2005ŌĆō2012
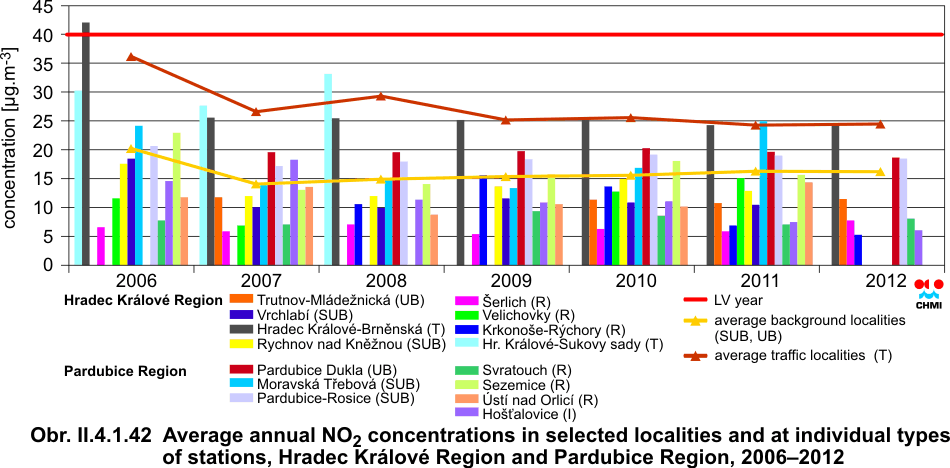
Fig. II.4.1.42 Average annual NO2 concentrations in selected localities and at individual types of stations, Hradec Kr├Īlov├® Region and Pardubice Region, 2006ŌĆō2012
Fig. II.4.1.43 Average annual benzo(a)pyrene concentrations, Hradec Kr├Īlov├® Region and Pardubice Region, 2004ŌĆō2012
Fig. II.4.1.44 Numbers of exceedances of the limit value of O3 in the average for three years, Hradec Kr├Īlov├® Region and Pardubice Region, 2006ŌĆō2012
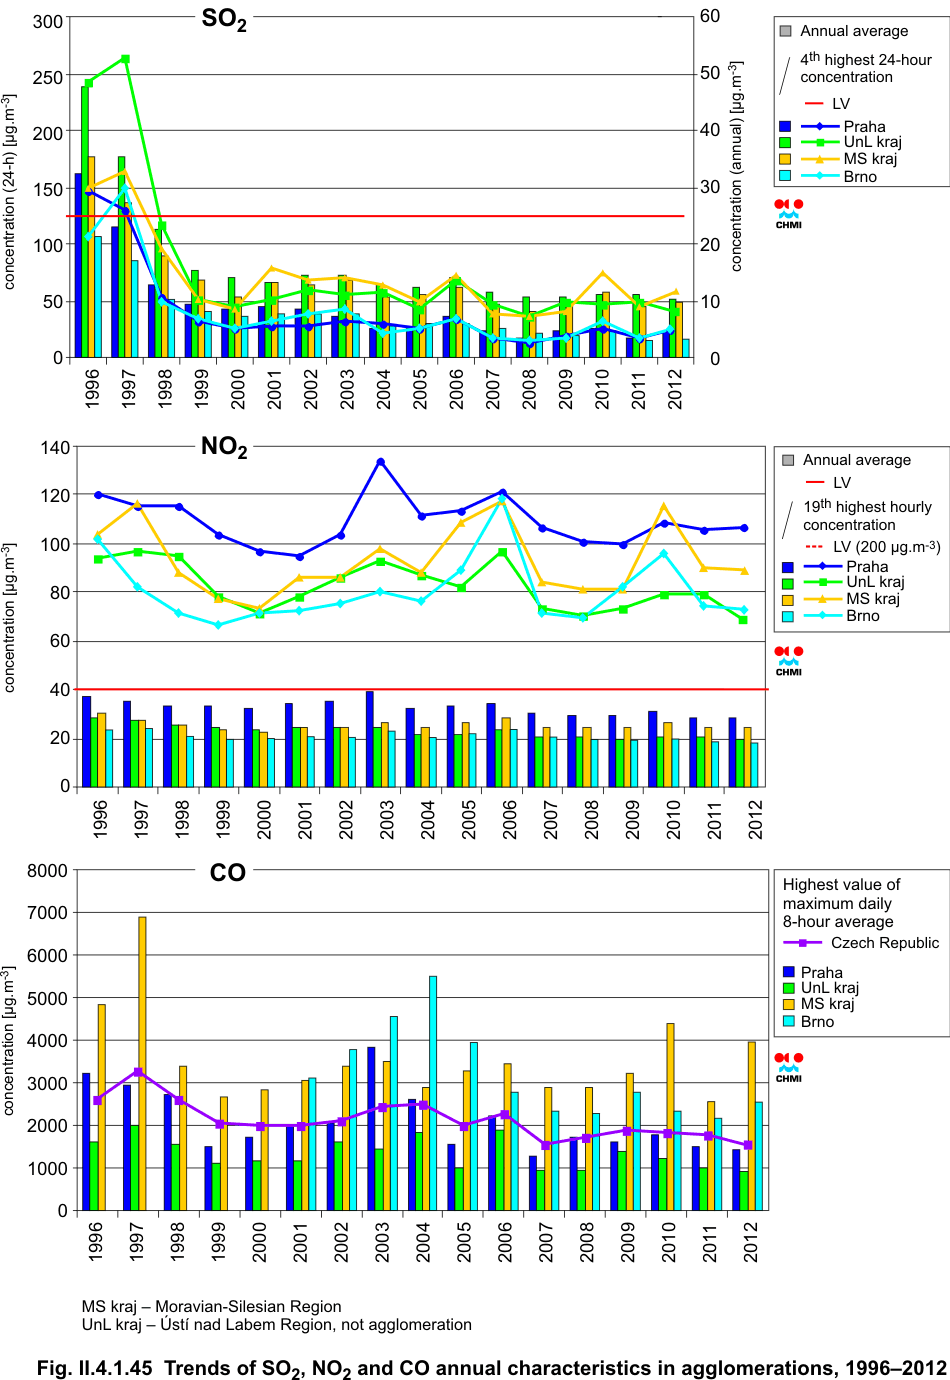
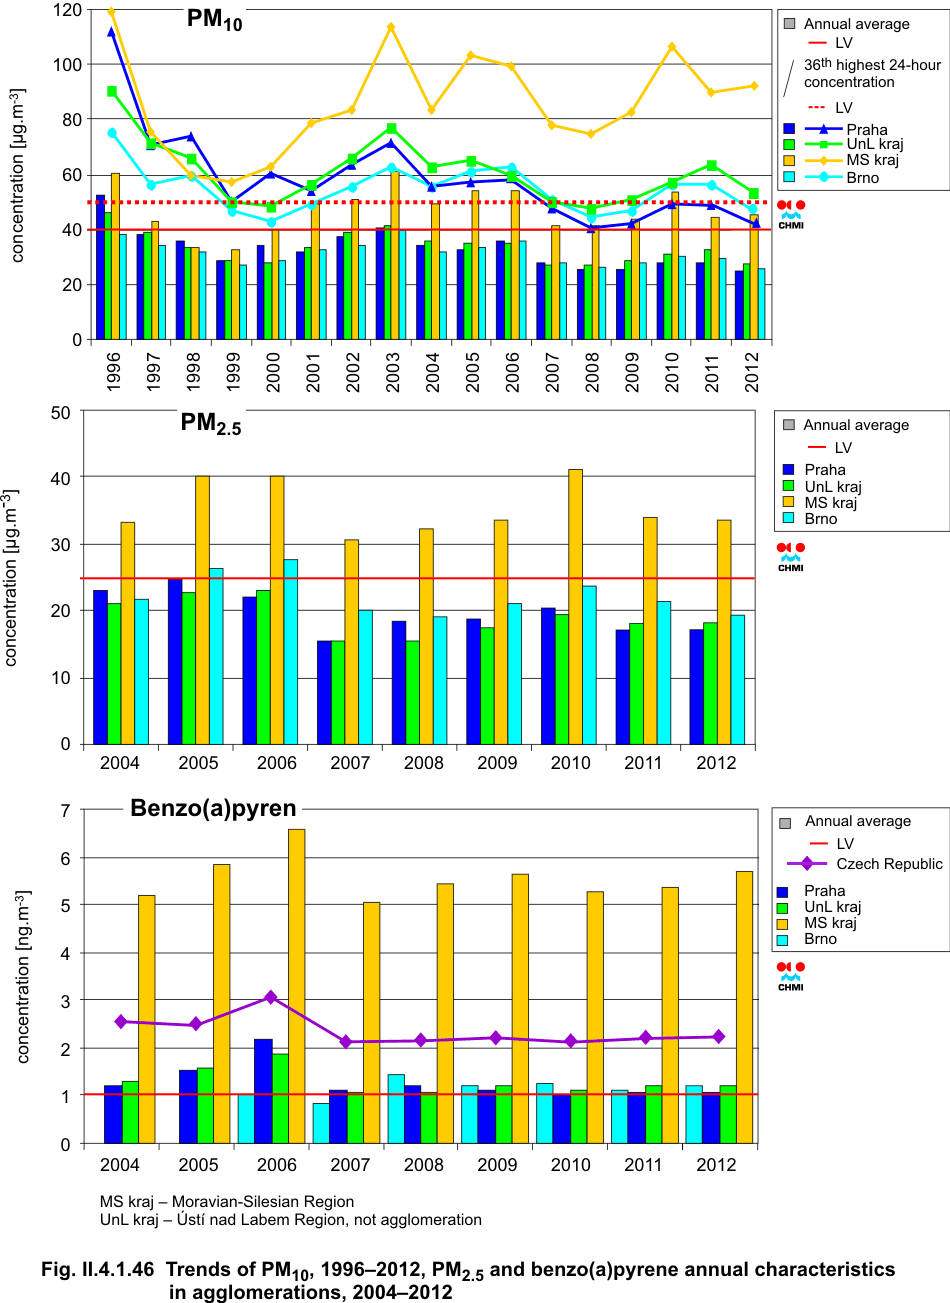
The trends of SO2, PM10, NO2 and CO annual air pollution characteristics for the period 1996ŌĆō2012, of benzo(a)pyrene and PM2.5 for the period 2004ŌĆō2012 for the agglomerations Prague, Brno and the Moravian-Silesian Region (further on agglomerations) and for the ├Üst├Ł nad Labem Region are depicted in Figs. II.4.1.45 and II.4.1.46. In the period from 1996 to 1999 there was a significant decreasing trend in SO2 and PM10 concentrations in the mentioned agglomerations and the ├Üst├Ł nad Labem Region. The greatest decrease of SO2 concentrations was recorded in the ├Üst├Ł nad Labem Region and the greatest decrease of PM10 concentrations was recorded in the agglomerations Moravian-Silesian Region and Prague. In comparison with SO2 and PM10 NO2 concentrations decreased slightly. In the following years 2000ŌĆō2001 the decreasing trend of all pollutants except CO was interrupted and, on the contrary, SO2 concentrations increased in the Moravian-Silesian Region and NO2 concentrations increased in all agglomerations and the ├Üst├Ł nad Labem Region. Significant increase of PM10 concentrations in 2000ŌĆō2001was recorded mainly in the agglomeration Moravian-Silesian Region. CO concentrations have remained at similar level since 1999. The increasing trend of PM10 and NO2 concentrations continued in all agglomerations up to 2003 when there were recorded high concentrations of pollutants comparable with the levels measured in 1996. High pollutantsÆ concentrations in 2003 were caused both by unfavourable dispersion conditions in February and December and by subnormal level of precipitation amounts. In 2004, on the contrary, the ambient air pollution caused by SO2, PM10 a NO2 decreased in the agglomerations and the ├Üst├Ł nad Labem Region. Starting from 2005 all evaluated areas recorded the increasing trend in NO2, which was confirmed in 2006. As concerns PM10 and PM2.5, there was a similar characteristic increase in 2005, with the steepest progress in the agglomeration Moravian-Silesian Region. In 2006 the increasing trend of PM10 concentrations continued and as concerns PM2.5, this increasing trend was recorded in all monitored areas except for Prague. The increase of pollutantsÆ concentrations in the years 2005 and 2006 is given mainly by deteriorated dispersion conditions. In 2006 these unfavourable meteorological conditions occurred in the whole territory of the Czech Republic. In the ├Üst├Ł nad Labem Region and in the Moravian-Silesian Region, on the contrary, there was recorded a very slight decrease of 24-hour PM10 concentrations and the stagnation of annual PM10 concentrations. In 2007 there was a marked decrease of air pollution caused by SO2, PM10, PM2.5, NO2 and CO in all agglomerations. The steepest decrease is apparent, after the previous increase, in hourly NO2 concentrations in Brno. The decrease of pollutantsÆ concentrations in the ambient air was influenced by more favourable meteorological and dispersion conditions in 2007. In 2008 the decrease of SO2, PM10 and NO2 concentrations continued, but it was not as steep as in the previous year. PM2.5 concentrations mostly stagnated. In 2009 the PM10 and PM2.5 concentrations in agglomerations increased. The most prominent increase was recorded in the Moravian-Silesian Region. The increase of NO2 concentrations was recorded in Brno, in other agglomerations the concentrations rather stagnated. The increase of concentrations of pollutants was influenced by less favourable meteorological and dispersion conditions, particularly in January, February and December 2009 as compared with the previous year. In 2010 the increase of concentrations continued in all pollutants in all agglomerations. The highest year-to year increase of PM10 concentrations was recorded in the Moravian-Silesian Region, where the year-to-year increase of average PM10 concentration increased by 10 ╬╝g.m-3; in the remaining agglomerations the year-to-year increase of PM10 was about 2.5 ╬╝g.m-3. The annual average concentrations of PM2.5 also increased in all agglomerations; the highest increase was recorded again in the Moravian-Silesian Region (in the year-to-year comparison by 7.5 ╬╝g.m-3), Further marked increase was recorded in NO2, and namely in the 19th highest hourly concentration in the Moravian-Silesian Region, the second highest increase of NO2 was recorded in the Brno agglomeration. The increase of pollutantsÆ concentrations in 2010 was caused by repeated occurrence of unfavourable meteorological and dispersion conditions in the winter period, both at the beginning of the year (January and February) and at the end of the year (October and December). In 2011, on the contrary, the increase of concentrations in most pollutants in most air pollution characteristics stopped and started to decrease, with the exception of PM10 concentrations which recorded the increase. The year-to- year comparison shows that the 36th highest 24-hour concentration increased in the agglomeration Prague and in the ├Üst├Ł nad Labem Region. On the contrary, the decrease of the 36th highest 24-hour concentration was recorded in the Moravian-Silesian Region, and namely 16 ╬╝g.m-3 (15 % in the year-to-year comparison). Nevertheless, PM10 concentrations in these areas remain above the level of the daily limit values. The average annual PM10 concentrations recorded the decrease in the agglomeration Moravian-Silesian Region and a slight decrease in the agglomeration Brno. The average annual concentrations of PM10 in the Prague agglomeration stagnate, and they slightly increased in the ├Üst├Ł nad Labem Region. The annual average concentrations of fine particles PM2.5 decreased in all the mentioned areas, the most significant decrease was recorded in the agglomerations Moravian-Silesian Region (17 %) and Prague (15 %). However, in the Moravian-Silesian Region, in spite of their decrease, they exceed by more than one third the level of the limit value. The concentrations of the remaining pollutants (SO2, NO2 and CO) stay below the respective limit values and as concerns the years-to-year comparison their decrease or stagnation were recorded. Most distinct relative decrease was recorded in SO2 concentrations in both air pollution characteristics in all areas with the exception of the ├Üst├Ł nad Labem Region. SO2 concentrations in the ├Üst├Ł nad Labem Region show their stagnation (annual average) or slight increase (4th highest 24-hour concentration). On the contrary, in 2012, after the relatively high increase in 2011, the 4th highest 24-hour and the annual average concentration of SO2 increased again by 30 to 50 % and namely in all assessed areas with the exception of the ├Üst├Ł nad Labem Region. The 25th highest 1-hour SO2 concentration increased in the agglomerations Prague and Brno, and it decreased in the remaining areas. PM10 concentrations decreased in all the mentioned areas with the exception of the Moravian-Silesian Region, where a slight increase of the annual average concentration and the increase of the 36th highest 24-hour concentration were recorded by almost 4 %. Nevertheless the 36th highest 24-hour concentration of PM10 still exceeds the limit value in the Moravian-Silesian Region and in the ├Üst├Ł nad Labem Region, the annual average concentration reaches the above-the-limit levels in the Moravian-Silesian Region. The concentrations of PM2.5 particles decreased in Brno and in the Moravian-Silesian Region, nevertheless in the Moravian-Silesian Region the concentration exceeds the limit value. In Prague and in the ├Üst├Ł nad Labem Region the concentrations slightly increased, but the limit value was met in these areas. NO2 concentrations decreased in all areas and air pollution characteristics with the exception of a slight increase of the 19th highest 1-hour concentration of NO2 in the agglomeration Prague. CO concentrations increased in the Moravian-Silesian Region and in Brno; on the contrary, the concentrations decreased in Prague and in the ├Üst├Ł nad Labem Region. CO concentrations are well below its respective limit value in all areas regardless the year-to-year change. Benzo(a)pyrene concentrations exceed the limit value in the Moravian-Silesian Region and in Brno. The average annual concentration in Prague and the ├Üst├Ł nad Labem Region decreased just below the limit value, which occurred for the first time during the assessed period 2005ŌĆō2012. There is almost sixfold exceedance of the annual concentration of benzo(a)pyrene in the Moravian-Silesian Region.
Fig. II.4.1.45 Trends of SO2, NO2 and CO annual characteristics in agglomerations, 1996ŌĆō2012
Fig. II.4.1.46 Trends of PM10, PM2.5 and benzo(a)pyrene annual characteristics in agglomerations, 1996ŌĆō2012
|