| AIR POLLUTION IN THE CZECH REPUBLIC IN 2012 Czech Hydrometeorological Institute - Air Quality Protection Division |
|
|
|
|
|
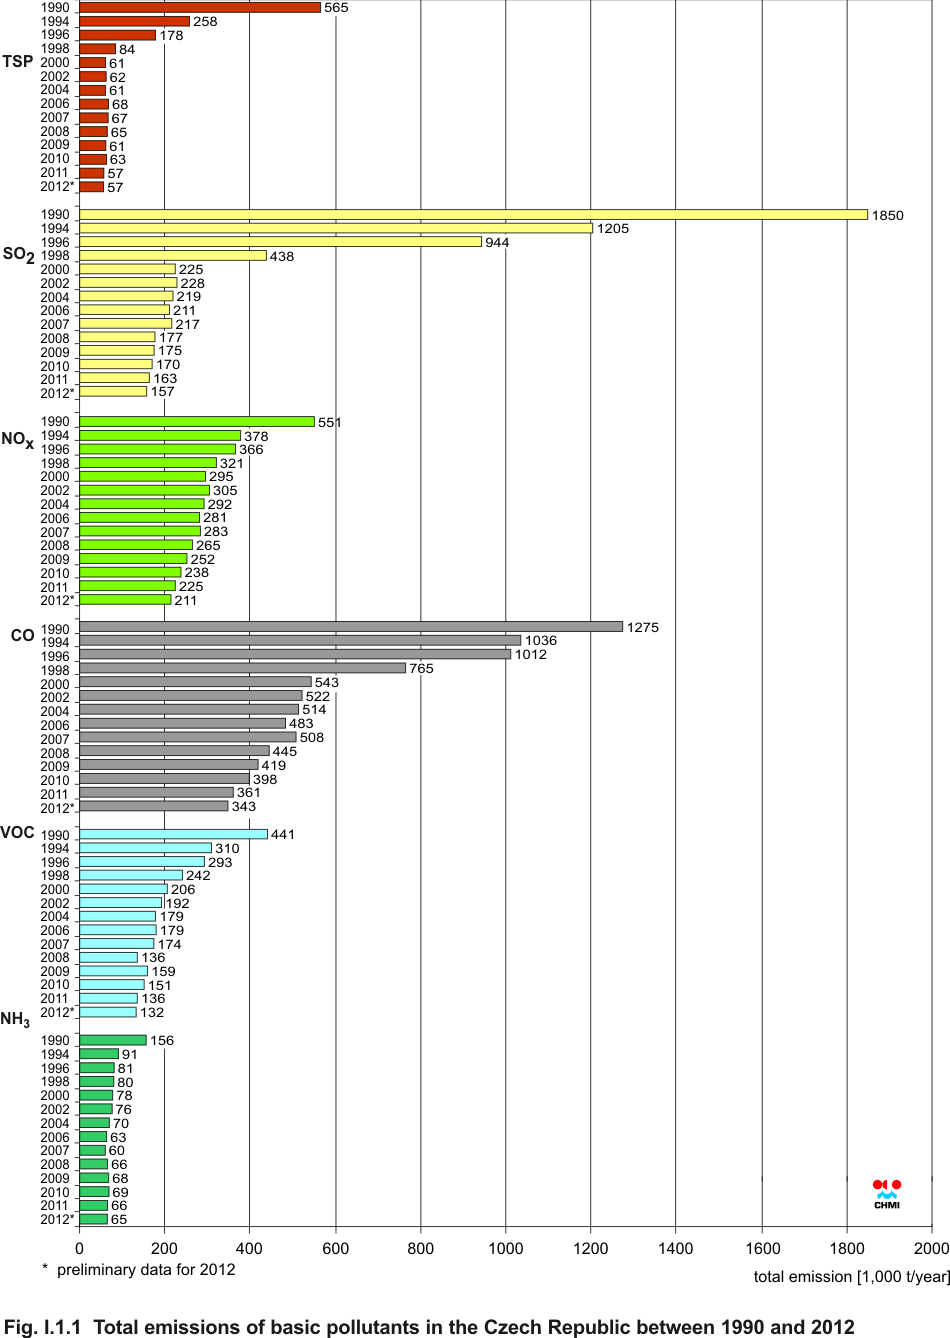
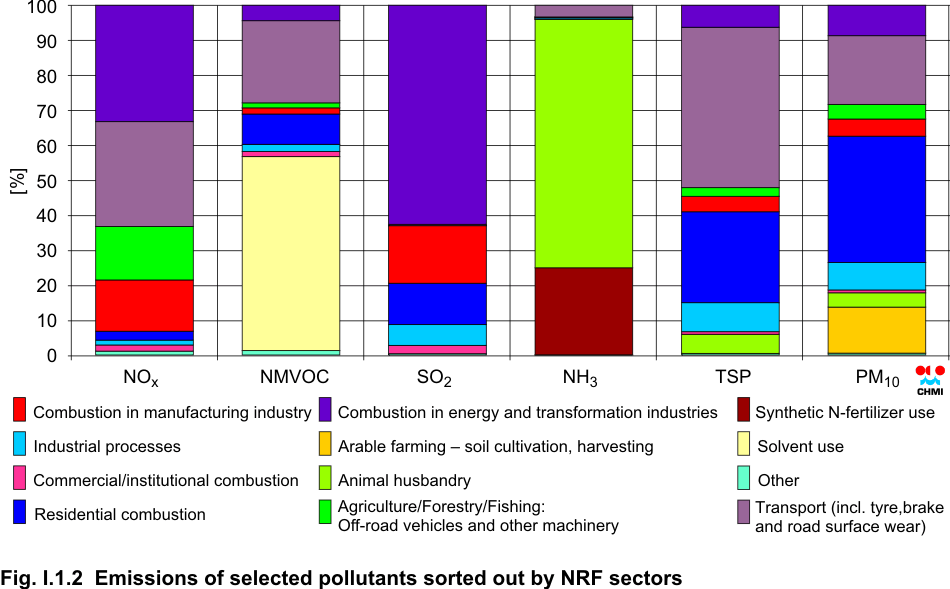
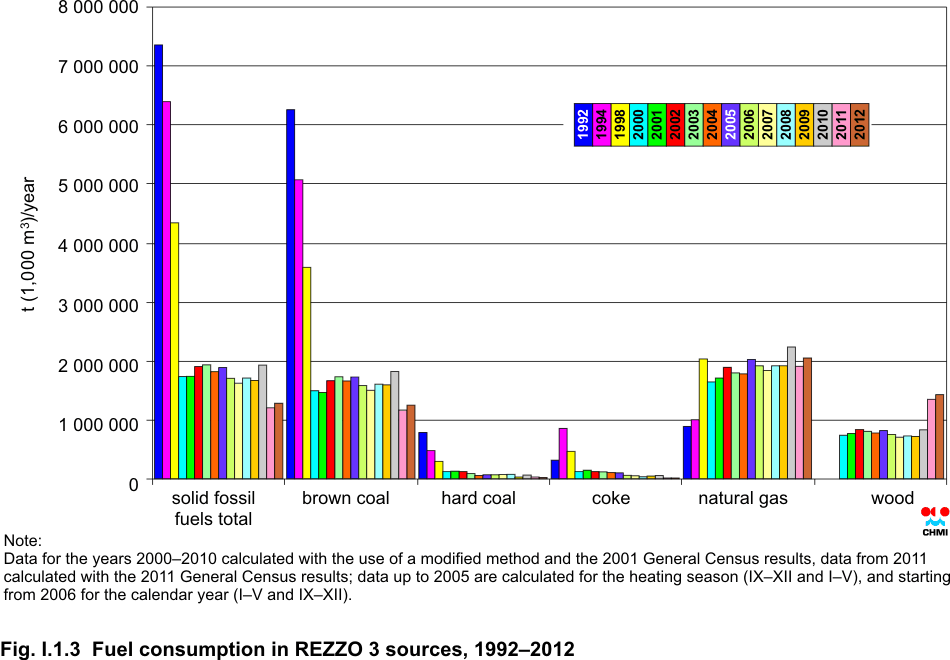
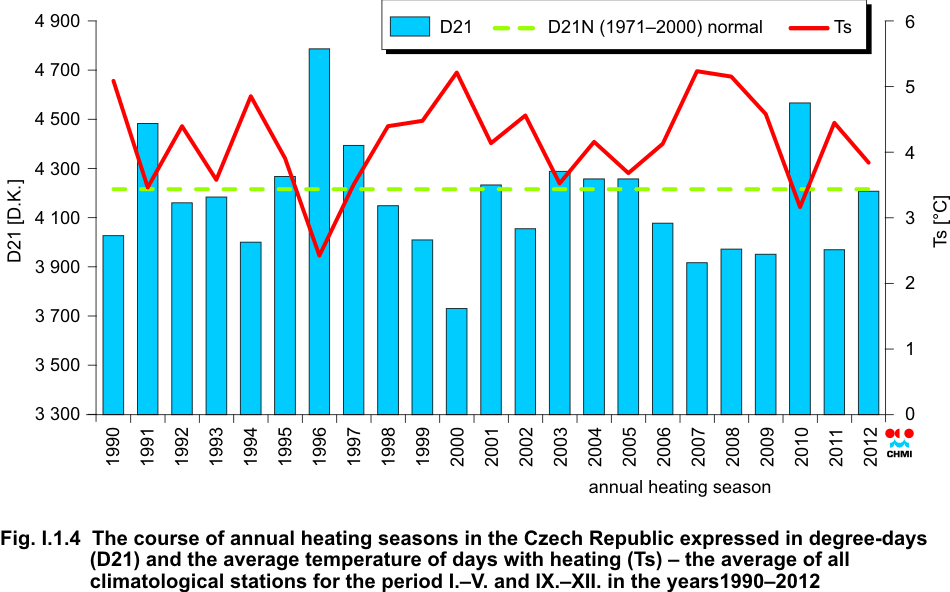
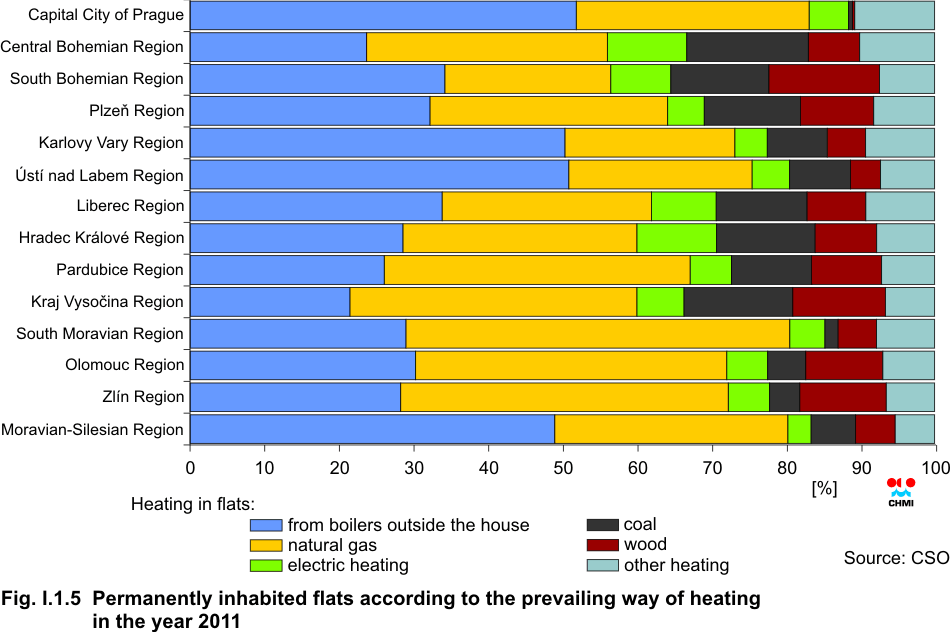
I. ATMOSPHERIC POLLUTANTS EMISSION IN THE CZECH REPUBLIC The Department of Emissions and Sources has been authorized by the Ministry of the Environment to carry out emission inventories of air pollutants and greenhouse gases. In addition to the national and sector inventories, also inventories based on administrative units are produced (regions or districts). The methods are described at the websites www.chmi.cz under “AIR QUALITY”/”Emission inventory”. I.1 Atmospheric pollutants’ emissions The Register of Emissions and Air Pollution Sources (REZZO) which serves for storage and presenting data on stationary and mobile air pollution sources, is pursuant to the valid legislation (Act No. 201/2012 Coll. on Clean Air Protection) the part of the Air Quality Information System (ISKO) operated by CHMI. Although the traditional categorization of air pollution sources implemented as early as 1980, into large, medium-sized, small and mobile sources will be modified next year pursuant to the new legislation, the division of the data for presentation will remain the same as in the previous years: REZZO 1 and REZZO 2 sources monitored as point sources and emissions calculated by the model (REZZO 3 stationary sources monitored as area sources and REZZO 4 mobile sources). Since the year 2010 the reporting procedure of the Summary operational records data has been carried out through the Integrated System of Compliance with Reporting Duty in Environmental Areas (ISPOP). The reported data are thus available already in early April, and in the following months the reported data are reviewed and, if necessary, the suppliers were asked to correct the erroneous data. More detailed information to the control mechanism of the Summary operational records are presented at portal.chmi.cz/files/portal/docs/uoco/oez/emise/evidence/aktual/spe_kont_cz.html . Final data on emissions of mainly mobile sources and several stationary sources monitored as area sources are not available by the deadline of the Yearbook. Consequently, the emission data for the year 2012 are presented as preliminary. Table I.1.1 documents data on total emissions of basic air pollutants in 2011, and namely total suspended particles (TSP), SO2, NOx, CO, volatile organic compounds (VOC) and ammonia (NH3), and the shares contributed by each of the emission source categories to total air pollutant emissions. Preliminary data on the amount of emissions of basic pollutants in 2012 are shown in Tab. I.1.2. The development of total emissions of basic pollutants in 1990–2012 is shown in Fig. I.1.1. In comparison with the year 2010 there was recorded again the decrease of emissions in all basic pollutants. The international reporting of summary emission data uses the so called sector classification of sources based on the codes set by the Nomenclature for Reporting (NFR). The main monitored groups of sources include combustion sources, technological sources without combustion (so called emissions from technological processes), sources using solvents, agricultural activities, incl. farm animals breeding, and waste treatment. In addition to the emissions of major pollutants also emissions of PM10 and PM2.5 particles, heavy metals and POPs are reported. More detailed information in English version incl. the reported emissions are available at www.ceip.at. Emissions of selected pollutants sorted out by NFR sectors are presented in Fig. I.1.2. Emissions from the monitored area sources in the Czech Republic The air pollution sources monitored as area sources within the REZZO 3 include emissions from local household heating, fugitive dust emissions from building and agricultural activity, ammonia emissions from breeding of farm animals and application of mineral nitrogenous fertilizers and VOC emissions from the use of organic solvents. With the exception of emissions from household heating, other groups of sources are calculated exclusively with the use of data obtained within the national statistical monitoring and the potential year-to year changes ensue usually from the development of statistical indicators. On the contrary, the year-to year changes of the amount of emissions from local household heating are dependent primarily on the character of the heating season, which is expressed in the emission model by the number of degree days D21 (Fig. I.1.4), and on the changes of the compositions of combustions plants. Emissions for the years 2011 and 2012 were calculated according to the results of the Population and Housing Census statistical survey carried out in 2011 (SLDB 2011). The prevailing type of flat heating according to individual regions is presented in Fig. I.1.5. The use of data from SLDB 2011 for the model calculation leads, in comparison with the preliminary results presented in the previous year, to the decrease of emissions of SO2 by 26 %, VOC by 24%, CO by 28 % and NOx by 10 %. The main causes of this reduction include mainly the change of the share of coal and wood combustion as compared with the results of SLDB 2001 (Fig. I.1.3). TSP emissions remained at approximately same level. The data calculated for the year 2012 show, in comparison with the previous year, a slight increase in all pollutants due to longer and colder heating season (Fig. I.1.4.). The development of emissions from large combustion plants (LCP) Combustion plants with total rated thermal input equal to or greater than 50 MW, regardless the type of the used fuel, are classified according to the Directive No. 2010/75/EU on Industrial Emissions (further on IED) as Large Combustion Plants – LCP). Table I.1.3. presents the
development of emission of selected pollutants in the period 2000–2012. These
are the pollutants included in the international reporting procedure, i.e. SO2,
NOx and TSP. It is apparent that all reported substances recorded the
marked decrease of emissions as compared with the year 2000; the most marked
difference is in SO2 (36 %). The two remaining substances recorded
similar decrease (31 %). Further marked decrease is ensured by the European legislation. Starting from the year 2016 the plants are obliged to meet the emission limit values pursuant to Annex No. V of IED, which makes the previous limit values set by the Directive No. 2001/80/EC and depending on the rated thermal input and the type of fuel stricter. The plants thus may apply some of the transitional plans pursuant to the Articles 32–35 of IED:
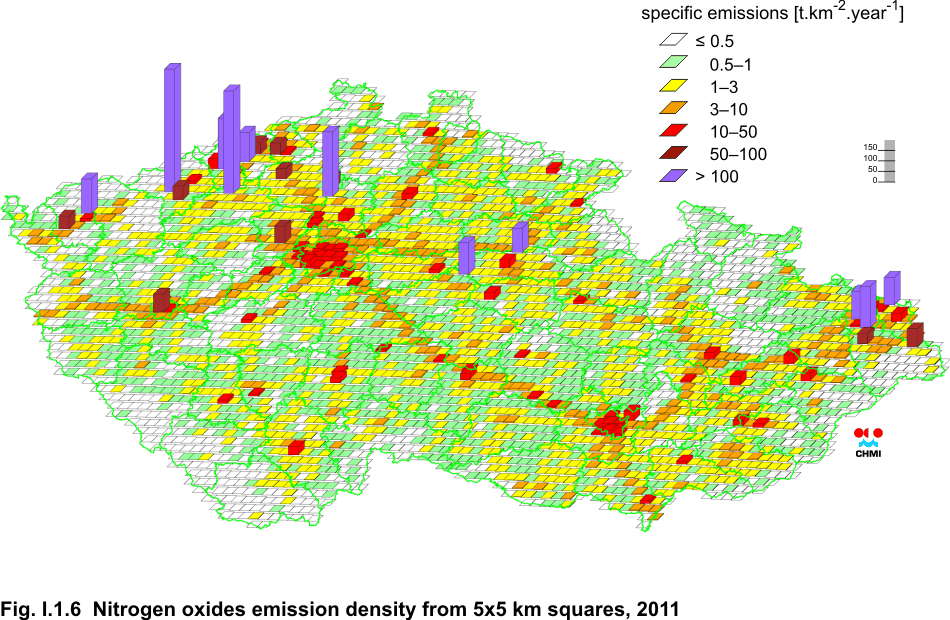
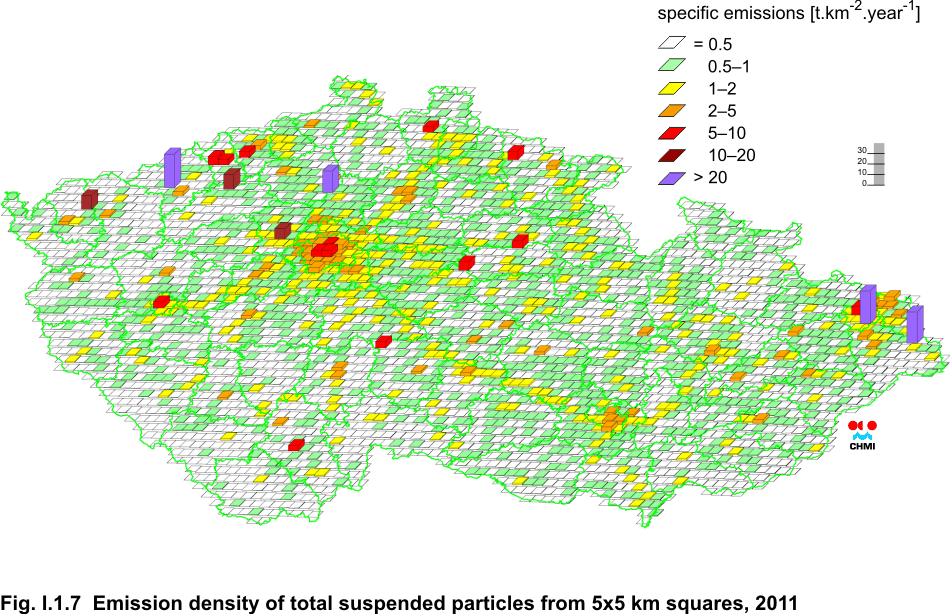
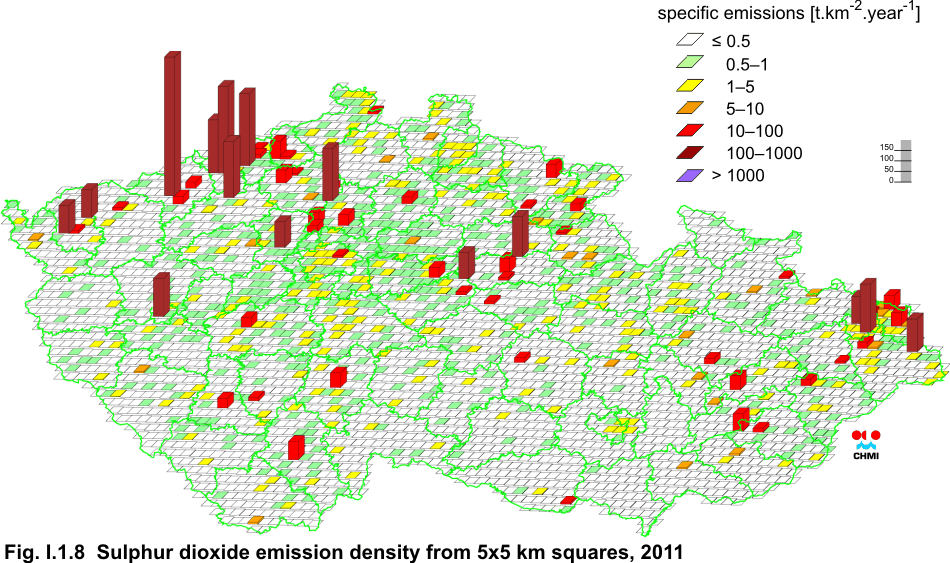
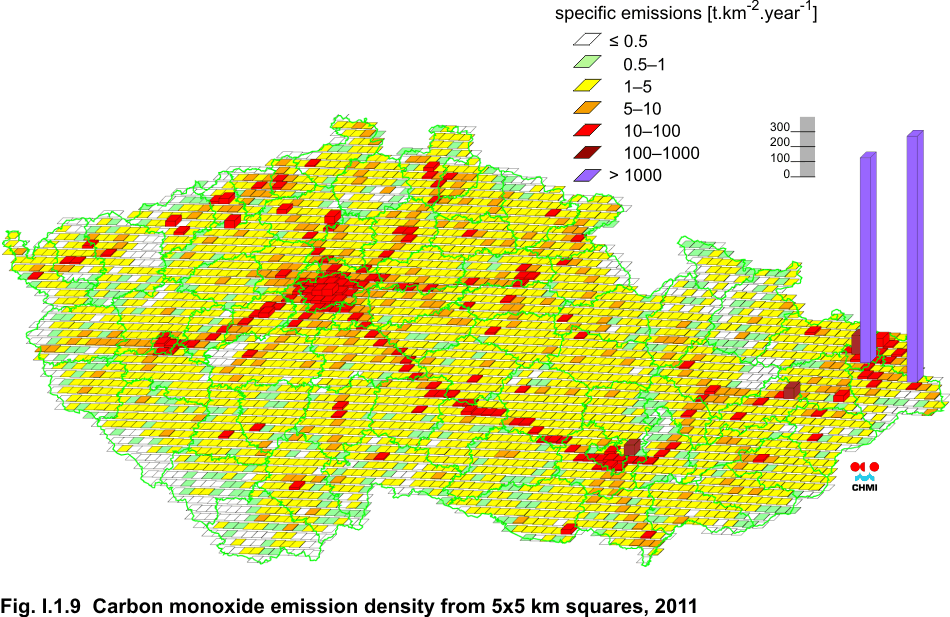
Most plants used the Transitional National Plan, which gives the stationary combustion sources covered by IED with the possibility to postpone the fulfilment of the new emission limit values for SO2, NOx and TSP by 1 July 2020, provided that the sources covered by the plan meet within the given period at least the current emission limit values and simultaneously the linear decrease of emission ceilings set by IED criteria. Emission densities in 5 x 5-km grid squares Emission data processed into charts with the help of GIS are shown in Figs. I.1.6–I.1.9. Emission densities for NOx, TSP, sulphur dioxide and carbon monoxide emissions are plotted in 5 x 5-km grid-squares. The charts are based on emissions from stationary sources (REZZO 1 to 3) and mobile sources (REZZO 4) for the year 2011, with regional disaggregation of emissions from line sources according to the 2010 vehicle census. Assessment of emission development In the monitored categories of REZZO 1–4 emissions decreased again in comparison with the year 2011. The development of emissions presented in Fig. I.1.1. reflects partly also the change of the method of calculation of emissions from household heating, which for the years 2011 and 2012 used the data from the 2011 Census. To analyse of the main causes of emission decrease, influenced definitely also by the lingering economic recession, thorough assessment of the reported data will have to be done in more detail. Tab. I.1.1 Total emissions of basic air pollutants in 2011 – final data Tab. I.1.2 Total emissions of basic air pollutants in 2011– preliminary data Tab. I.1.3 Development of emissions from large combustion plants (LCP)
Fig. I.1.1 Total emissions of basic pollutants in the Czech Republic between 1990 and 2012
Fig. I.1.2 Emissions of selected pollutants sorted out by NRF sectors
Fig. I.1.3 Fuel consumption in REZZO 3 sources, 1992–2012
Fig. I.1.4 The course of annual heating seasons in the Czech Republic expressed in degree-days (D21) and the average temperature of days with heating (Ts) – the average of all climatological stations for the period I.–V. and IX.–XII. in the years1990–2012
Fig. I.1.5 Permanently inhabited flats according to the prevailing way of heating in the year 2011 (Source: CSO)
Fig. I.1.6 Nitrogen oxides emission density from 5x5 km squares, 2011
Fig. I.1.7 Emission density of total suspended particles from 5x5 km squares, 2011
Fig. I.1.8 Sulphur dioxide emission density from 5x5 km squares, 2011
Fig. I.1.9 Carbon monoxide emission density from 5x5 km squares, 2011
|