| AIR POLLUTION IN THE CZECH REPUBLIC IN 2012 Czech Hydrometeorological Institute - Air Quality Protection Division |
|
|
|
|
|
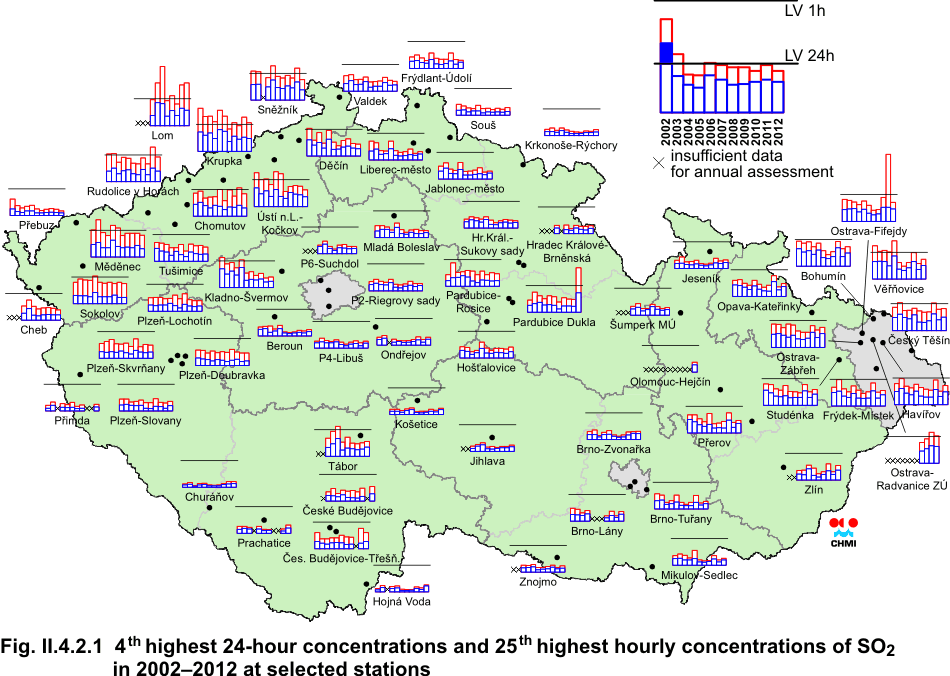
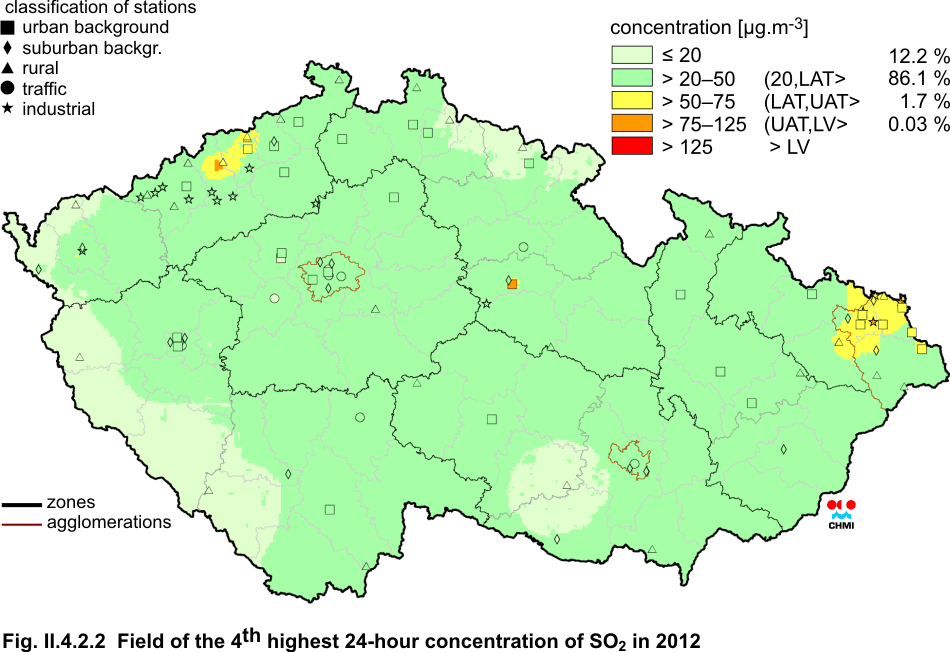
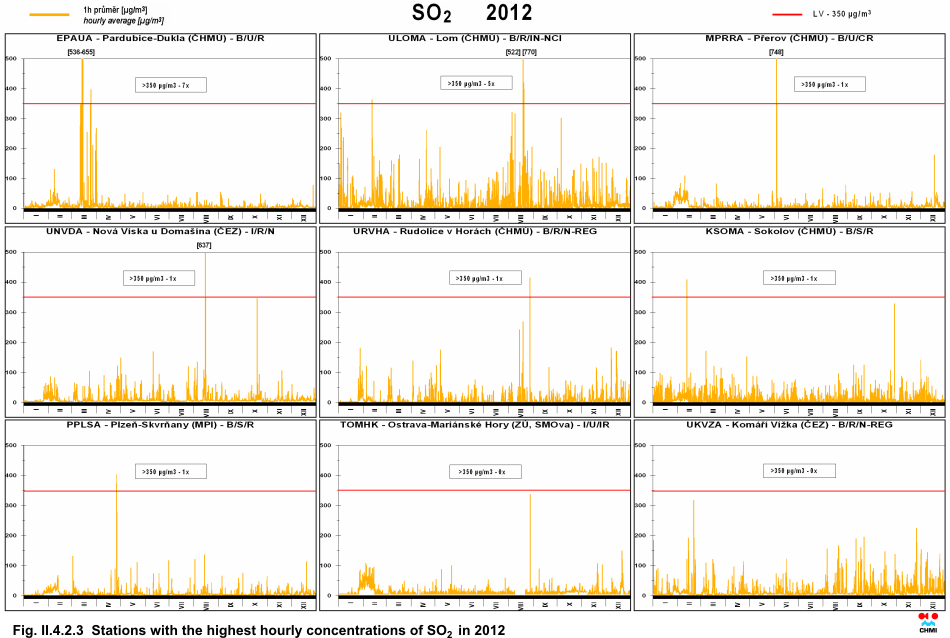
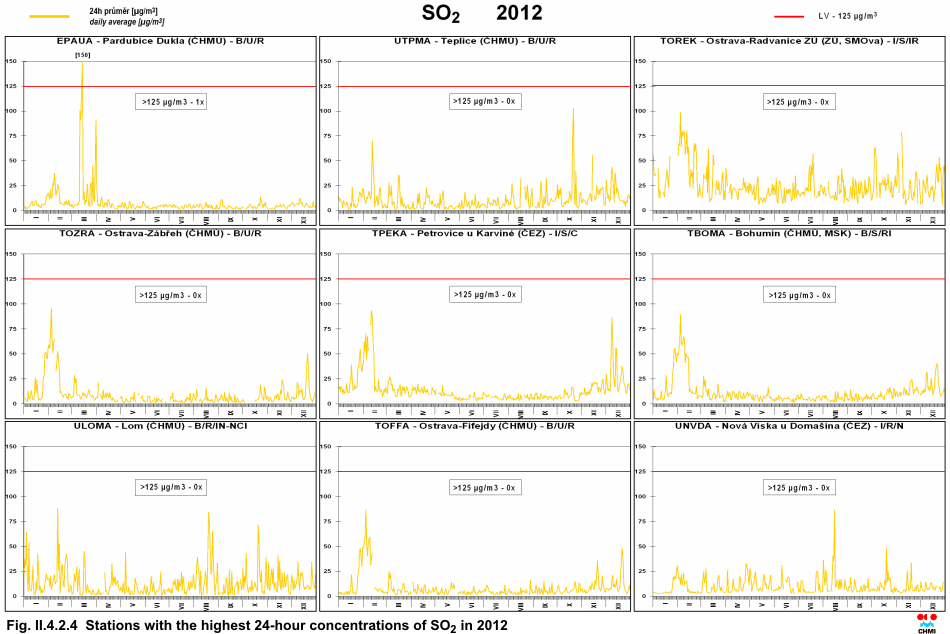
II.4.2 Czech Republic II.4.2.1 Air quality with regard to health protection limit values II.4.2.1.1 Sulphur dioxide Sulphur dioxide (SO2) emitted from anthropogenic sources is created mainly by burning the fossil fuels (coal and heavy fuel oils) and by smelting ores containing sulphur. In the atmosphere, SO2 is oxidized to sulphates and H2SO4, creating aerosol both in the form of droplets and suspended particles of broad size range. SO2 and the substances originating from it are removed from the atmosphere through wet and dry deposition. SO2 has irritating effects, high concentrations can cause lung function impairment and the change of lung capacity [15]. The 2012 situation of air pollution caused by SO2 with regard to the limit values set by the legislation is documented by the Tables II.4.2.1 and II.4.2.2 and Figs. II.4.2.1ŌĆōII.4.2.4. The table of annual average SO2 concentrations is also included to illustrate the situation (Table II.4.2.3). In 2012 neither the limit value for the hourly SO2 concentration nor for the 24-hour SO2 concentration were exceeded in the Czech Republic at any measuring station. The exceedance of the 24-hour limit value (125 ╬╝g.m-3) in the tolerated number of cases (less than or equal to three) occurred only at the station Pardubice Dukla. In case of hourly concentrations the limit value (350 ╬╝g.m-3) was exceeded in the tolerated number (less than or equal to 24); the highest number of exceedances was recorded in the localities in the Pardubice Region and ├Üst├Ł nad Labem Region (Pardubice-Dukla 7x, Lom 5x).Less than three exceedances were recorded in the localities in Plze┼ł-m─østo, Chomutov, Sokolov, Most and P┼Öerov. Fig. II.4.2.1 shows the development of the 4th highest 24-hour and 25th highest hourly SO2 concentration in selected localities. In 2012, in comparison with the year 2011, SO2 average annual concentrations increased in 52 % of localities. In comparison with the year 2011 both the increase of the 25th highest 1-hour concentration was recorded (in 52 % of localities) and the of 4th highest 24-hour concentration (in 65 % of localities). Higher concentrations in 2012 were given mainly by the occurrence of unfavourable meteorological and dispersion conditions in the winter period (mainly in January and February). Spatial distribution of the 4th highest 24-hour SO2 concentration is presented in Fig. II.4.2.2. It is apparent that only in approx. 1.73 % of the territory of the Czech Republic SO2 concentrations exceeded the lower assessment threshold. Figs. II.4.2.3 and II.4.2.4 document the courses of 1-hour and 24-hour SO2 concentrations at selected stations in 2012. Tab. II.4.2.1 Stations with the highest values of the 25th and maximum hourly concentrations of SO2 Tab. II.4.2.2 Stations with the highest numbers of exceedances of the 24-hour limit value of SO2 Tab. II.4.2.3 Stations with the highest values of annual average concentrations of SO2
Fig. II.4.2.1 4th highest 24-hour concentrations and 25th highest hourly concentrations of SO2 in 2002ŌĆō2012 at selected stations
Fig. II.4.2.2 Field of the 4th highest 24-hour concentration of SO2 in 2012
Fig. II.4.2.3 Stations with the highest hourly concentrations of SO2 in 2012
Fig. II.4.2.4 Stations with the highest 24-hour concentrations of SO2 in 2012
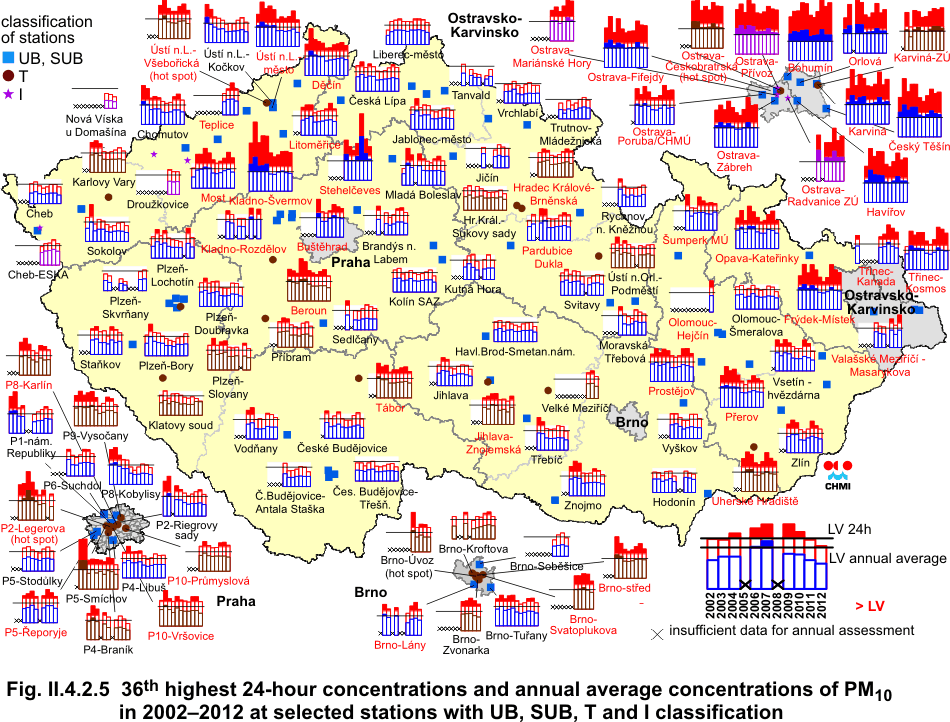
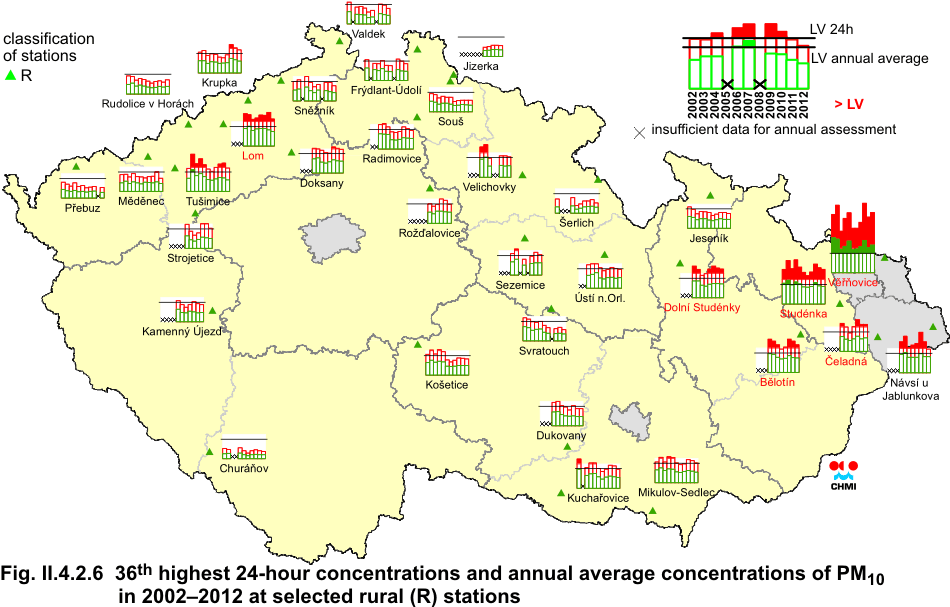
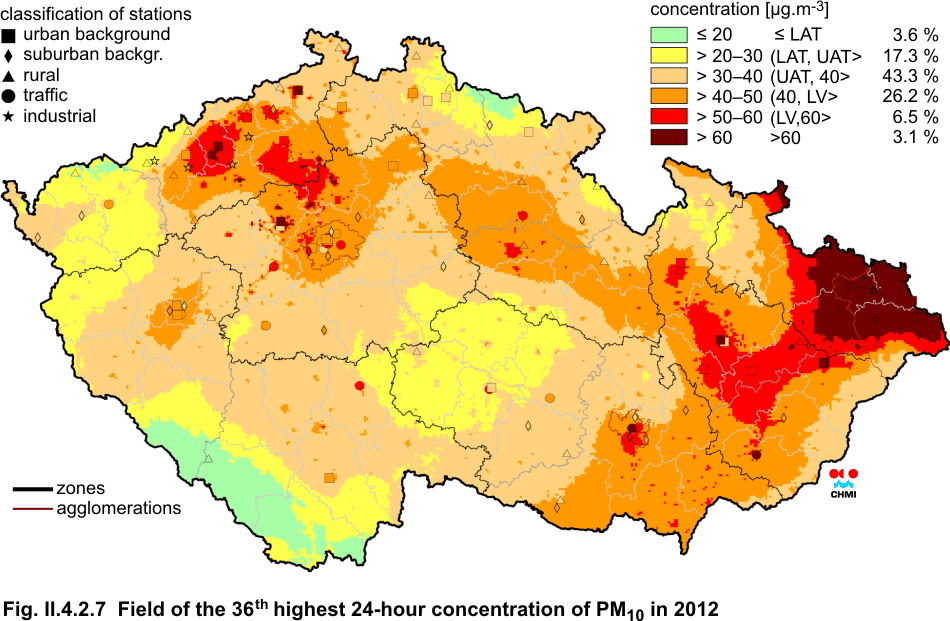
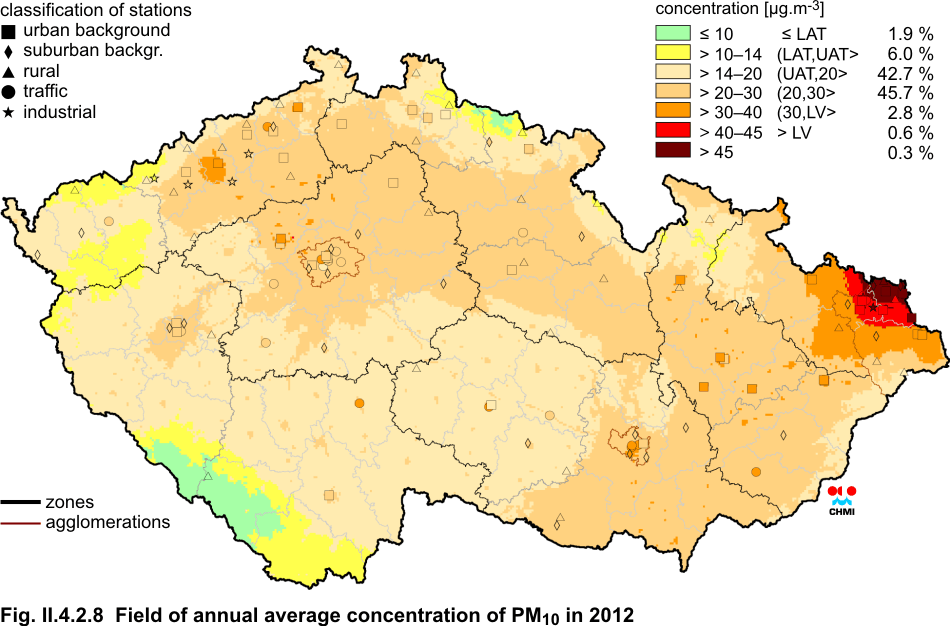
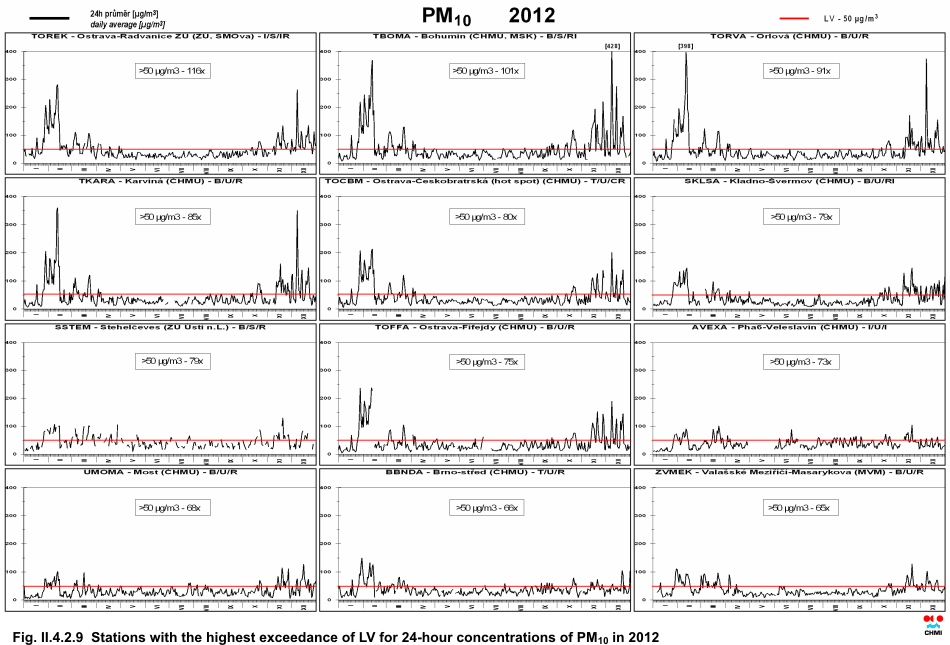
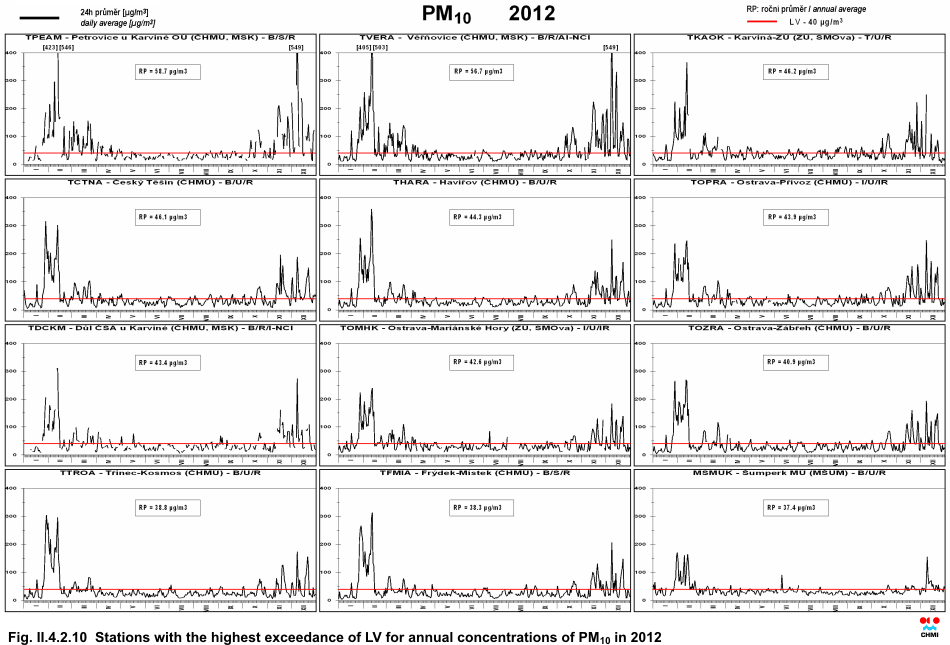
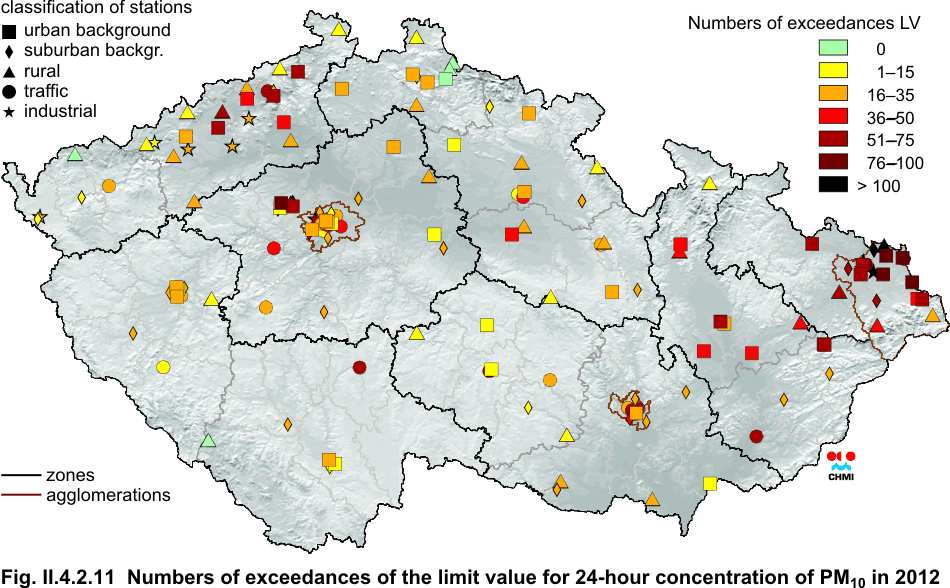
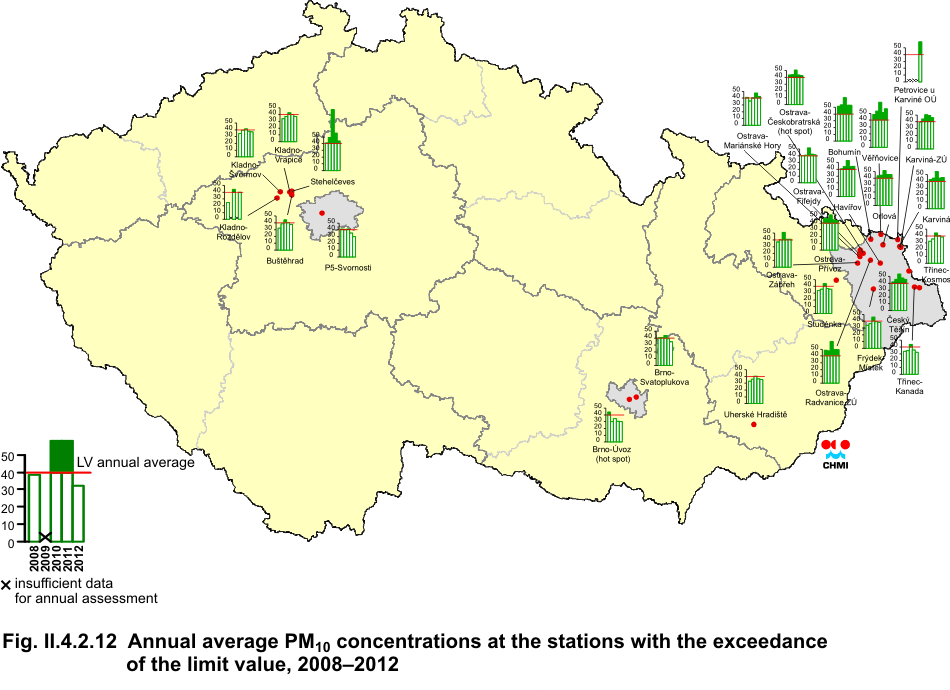
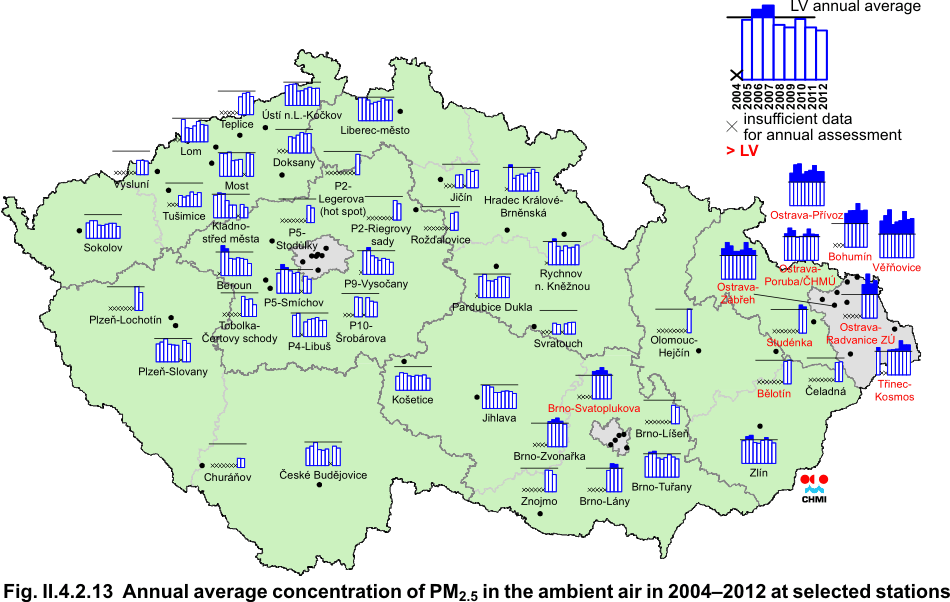
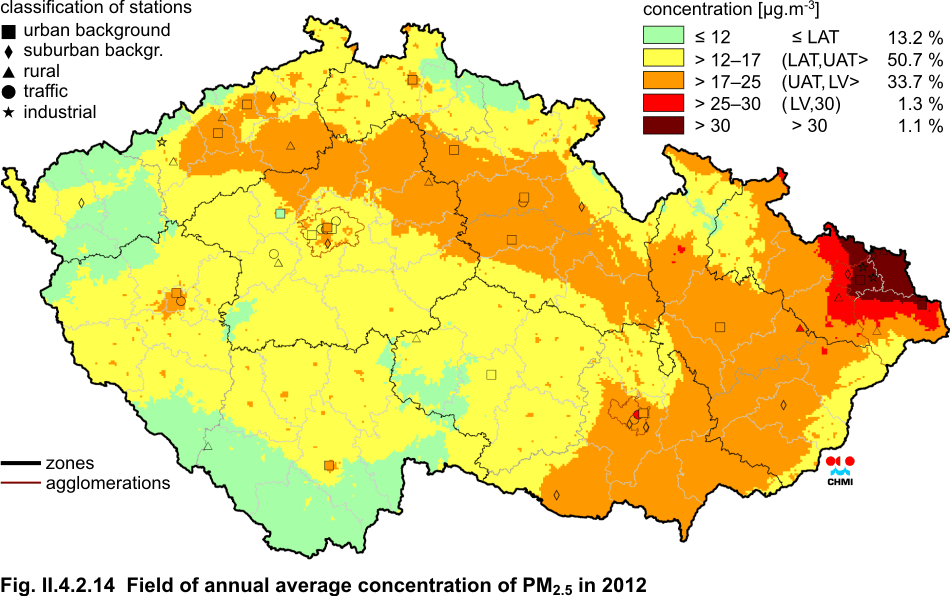
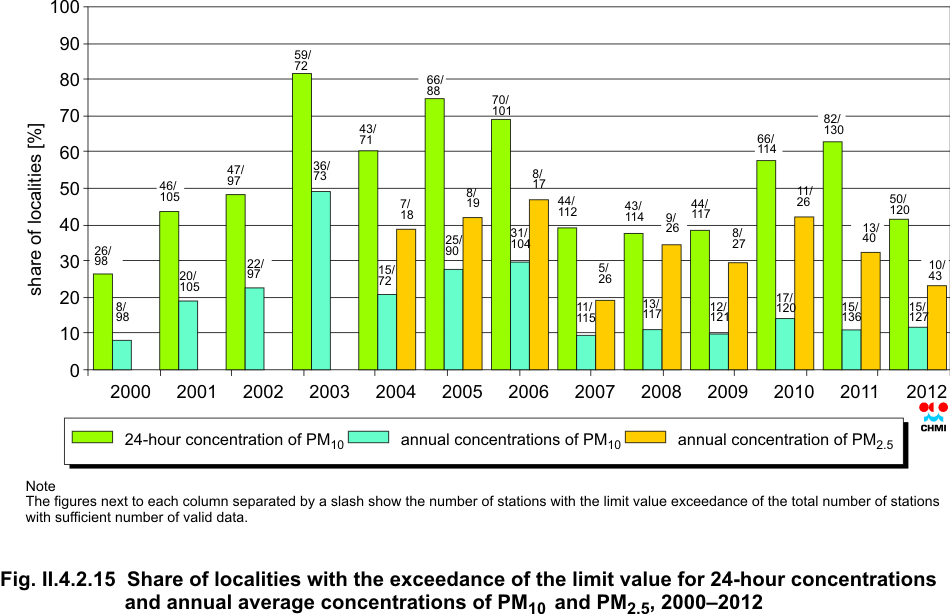
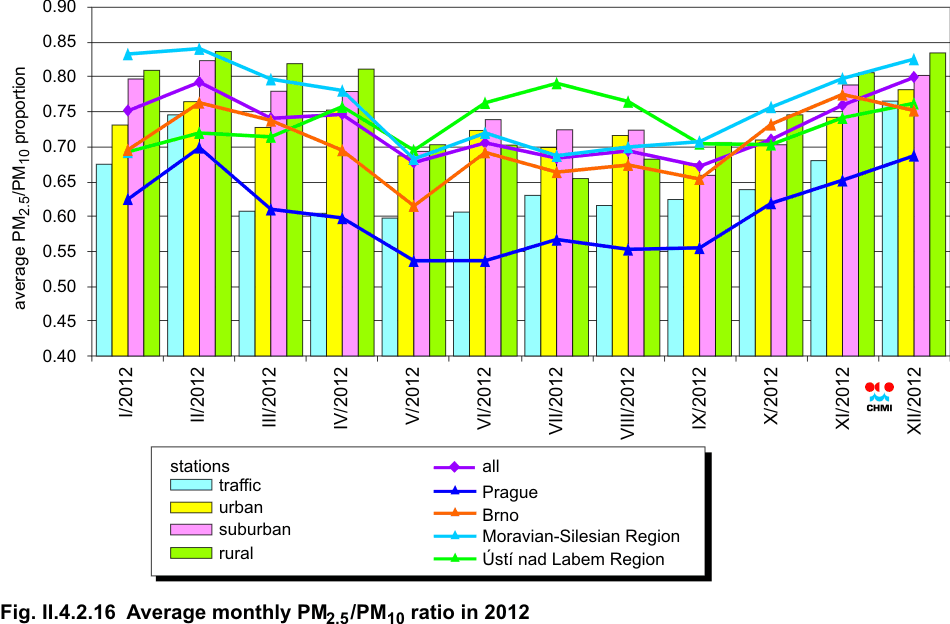
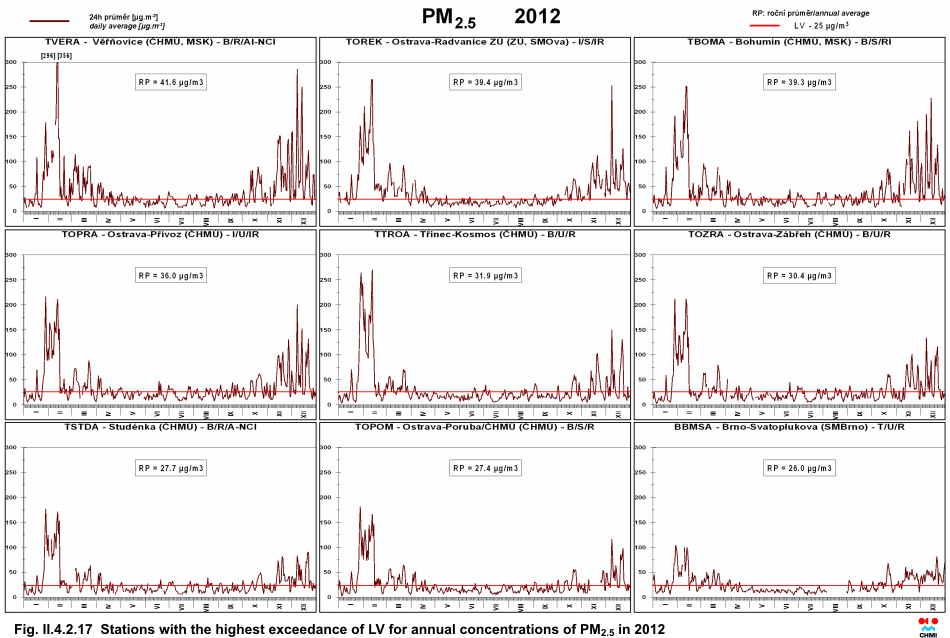
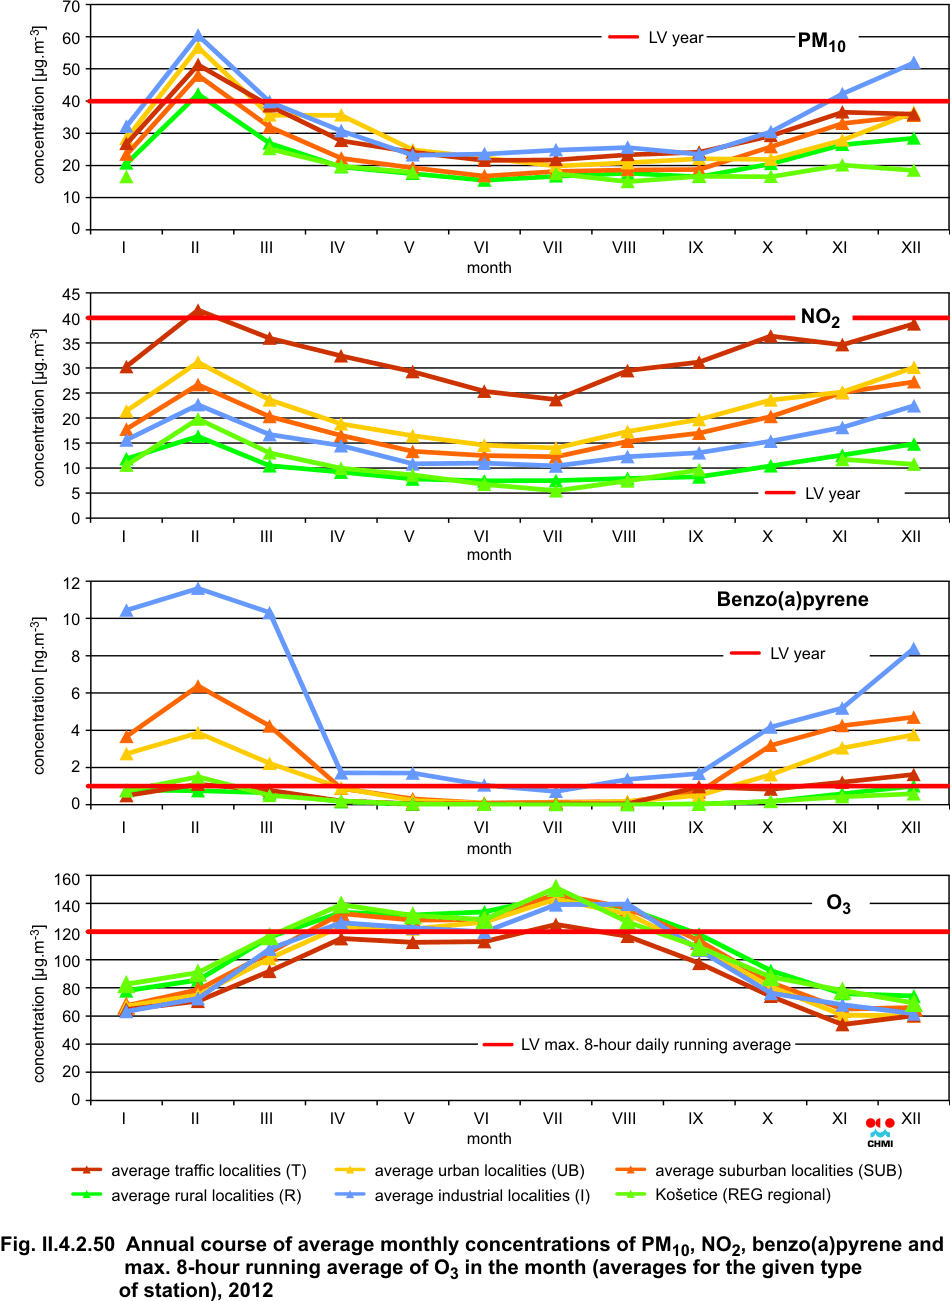
II. 4.2.1.2 Suspended particles, PM10 fraction and PM2.5 fraction The particles contained in the ambient air can be divided into primary and secondary particles. The primary particles are emitted directly into the atmosphere, from the natural sources (e.g. volcanic activity, pollen dust or sea spray aerosols) or anthropogenic sources (e.g. combustion of fossil fuels in stationary and mobile sources, tyre wear particulate matter, brake lining dust, road dust). Secondary particles are created in the atmosphere from their gaseous precursors SO2, NOx, NH3 and VOC through the process called gas-particles conversion. The main sources of total particle emissions, i.e. primary particles and precursors of secondary particles in the Czech Republic include power engineering (production of electric and heat energy), transport and public utility sector (incl. household heating) and agriculture. Due to the diversity of emission sources the suspended particles have various chemical composition and various size. The PM10 suspended particles have serious health impacts appearing already at low concentrations without a clear lower safe concentrations threshold. Health impacts of particles are influenced by their concentration, size, shape and chemical composition. The acute impact of particles may cause the irritation of mucous membranes of the respiratory system, the increased production of mucus etc. These changes may cause hypo-immunity and increase predispositions to respiratory diseases. The recurrent diseases may result in chronic bronchitis and cardiovascular disorders. The acute impact of particles may accentuate the symptoms in asthmatics and increase the total morbidity and mortality of population. The long-term exposure to particles may result in diseases of the respiratory and cardiovascular system. The level of health impacts is influenced by a number of factors, such as the current health condition of the individual, allergic predisposition or smoking. Children, the elderly and people with respiratory and circulatory system diseases are the sensitive groups [22]. Recently it has been proved that the most serious health impacts, i.e. cardiovascular and respiration problems and increased mortality, are produced by fine and ultrafine particles [23]. According to WHO the death rate in the towns with high level of ambient air pollution is increased by 15 to 20 % in comparison with the death rate in the towns with relatively clean air [24]. Air pollution caused by PM10 remains one of the main problems of air quality assurance. In almost all localities in the Czech Republic there is an apparent increasing trend in air pollution caused by PM10 from 2001 to 2003. In 2004 this trend stopped but in 2005 the PM10 concentrations increased again at almost all localities. In 2006 this trend continued at most localities in annual averages. In 2007, on the contrary, the decrease of PM10 concentrations was recorded. In 2008 the decreasing trend continued at most stations, mainly in daily concentrations. In 2009 there prevailed a slight increase, more marked in the agglomeration Moravian-Silesian Region. In 2010 the PM10 concentrations increased, both in daily and annual characteristics. The growth of concentrations of the suspended particles in 2010 was caused mainly by repeated occurrence of unfavourable meteorological and dispersion conditions in the winter period and at the end of the year. The increase of PM10 concentrations in 2010 was caused probably also by the coldest heating season for the recent 10 years. In 2011 the slight decrease of the 36th highest PM10 concentration was recorded (in average for all types of stations). In 2012 the year-to-year decrease of the 36th highest PM10 concentration was measured again, and namely by more than 5 ╬╝g.m-3 (in average for all types of stations which measured the 36th highest PM10 concentration both in 2011 and 2012). In 2012 also the decrease of average annual concentration was recorded at most measuring stations (Figs. II.4.2.5 and II.4.2.6). The year-to-year comparison shows the decrease of the maximum average daily PM10 concentrations as well as the share of the territory with daily limit value exceedances. It is clear from the data from the localities where the annual limit value was exceeded at least once in the recent 5 years (2008ŌĆō2012) that the most loaded areas are: the Ostrava-Karvin├Ī area, the agglomerations Prague and Brno and the Kladno area. Further, the data show that the highest PM10 loads were recorded in the year 2010, as concerns the assessment of the recent 5 years (Fig. II.4.2.12 and Table II.4.2.6). The exceedance of the daily limit value for PM10 in 2012 at least in one locality was recorded in all zones and agglomerations (Fig. II.4.2.11). In comparison with the year 2011 the highest 36th average 24-hour concentration decreased at 81 % of stations (the same file of stations with measurements both in 2011 and 2012 has been assessed). In 2012 the most affected area of large coverage was, similarly as in the previous years, the agglomeration Ostrava/Karvin├Ī/Fr├Įdek-M├Łstek. The limit value of 24-hour PM10 concentration was exceeded in 2012 in all localities in the agglomeration the Ostrava/Fr├Įdek-M├Łstek/Karvin├Ī, in the zone Moravia-Silesia. In the zone Central Moravia the daily limit value was exceeded at three quarters of measuring stations, in the Brno agglomerations at one half of the stations. The remaining areas recorded the exceedance at approx. 11 % of the station (zones South-East, South-West and North-West), 22 % (zone Central Bohemia), 28 % (zone North-West) to 38 % of the stations (Prague agglomeration). Of the total number of 120 localities with sufficient number of data for the assessment 50 localities (42 % of the stations) reported the exceedance of 24-hour PM10 limit value. In comparison with the year 2011, when the daily limit value was exceeded in 63 % of the station, it can be stated that the situation has improved (Fig. II.4.2.15). Limit value exceedances are still significant for listing the basic administrative units among the areas with deteriorated air quality. Especially in the towns where the PM10 measurements are carried out the 24-hour average concentrations are above the limit value. However, it can be admitted that also in other larger and smaller settlements without PM10 measurements the concentrations of this pollutant can be high or exceeding the limit value. The spatial projections of PM10 concentrations show, that in 2012 the limit values for PM10 24-hour average concentration were exceeded in 9.6 % of the territory of the Czech Republic (Fig. II.4.2.7) with approx. 30.93 % of inhabitants (in 2011 the exceedance was recorded in 21.8 % of the territory with ca 50.8 % of inhabitants). The graphs of courses of 24-hour concentrations of PM10 in 2012 in the localities, where the limit values for annual average and for 24-hour average were exceeded, are shown in Figs. II.4.2.9 and II.4.2.10. The concentrations of PM10 show a clear course with the highest concentrations in the cold months of the year. Higher concentrations of PM10 in the ambient air during the cold part of the year may be influenced both by higher emissions of particles from seasonal sources (e.g. the share of local heating as concerns PM10 emissions is 35 %), and by deteriorated dispersion conditions. In 2012 this applied mainly to the periods JanuaryŌĆōMarch and OctoberŌĆōDecember. The maximum concentrations in February correspond with bad dispersion conditions in this month. At the same time, February was the coldest month of the year 2012 (more details see Chapter II.5), which could have contributed also to higher fuel consumption. In February there were recorded concentrations exceeding the 36th highest 24-hour limit value in all types of localities (Fig. II.4.2.50). In 2012 the annual PM10 limit value was exceeded in 15 of 127 localities with sufficient number of data for the assessment (in 2011 in 15 of 136 ŌĆō Fig. II.4.2.15), the highest annual averages were recorded in the locality Petrovice u Karvin├® O├Ü (58.7 ╬╝g.m-3), V─ø┼Ö┼łovice (56.7 ╬╝g.m-3) and Bohum├Łn (52.8 ╬╝g.m-3). The limit value was exceeded in 2012 only in the localities in the Ostrava-Karvin├Ī area (Table II.4.2.5). The average annual concentrations of PM10 decreased at 79 % of stations (again, the same file of stations for the years 2011 and 2012 has been assessed); the limit value was exceeded in 0.9 % of the territory of the Czech Republic with 5.21 % of inhabitants (in 2011 the limit value was exceeded in 0.7 % of the territory). Since 2004 the fine fraction of suspended particles (PM2.5) has been measured in the Czech Republic. The measurement results show significant contribution of PM2.5 fraction to air pollution situation, and particularly in the agglomeration Ostrava/Karvin├Ī/Fr├Įdek-M├Łstek. When comparing the results with the annual limit value (25 ╬╝g.m-3) it is evident that in 10 localities of the total number of 43 with sufficient number of data for the assessment the limit value was exceeded (in 2011 the limit value was exceeded in 13 localities of 40; Fig. II.4.2.15). The annual average PM2.5 concentrations at individual localities in the period 2004ŌĆō2012 are presented in Fig. II.4.2.13. The year-to-year comparison (again, the same file of stations with measurements both in 2011 and 2012 has been assessed) shows that there was the decrease of the average annual concentration at 65 % of stations. The estimated part of the territory of the Czech Republic with the exceedances of the limit value is 2.4 % (Fig. II.4.2.14). In comparison with the year 2011 when the limit value for PM2.5 was exceeded in 2.6 % of the territory the improvement is not marked. According to the annual course of PM2.5 concentrations with regard to the exceedance of the annual limit value (Fig. II.4.2.17) it can be stated that the pollution caused by this pollutant occurs mainly during the cold part of the year. Higher concentrations of this pollutant in the cold part of the year are caused by emissions from heating and by deteriorated dispersion conditions. The measurement results indicate that the ratio between PM2.5 and PM10 is not constant but shows certain seasonal course and it is also dependent on the locality position (Fig. II.4.2.16). In 2011 the ratio, in the average from 31 localities in the Czech Republic simultaneously measuring PM2.5 and PM10 and with sufficient number of values, ranged from 0.67 (September) to 0.80 (December) with lower values in the summer period. In Prague, where the annual course is influenced by a large share of traffic localities, this ratio ranged from 0.54 (May and June) to 0.70 (February), in Brno from 0.62 (May) to 0.77 (November) and in the Moravian-Silesian Region from 0.68 (May) to 0.84 (February). When comparing the ratio with regard to the classification of localities, the ratio in rural localities is from 0.65 (July) to 0.84 (February), in urban localities from 0.67 (September) to 0.78 (December), in suburban localities from 0.66 (September) to 0.82 (February), in traffic localities from 0.60 (April and May) to 0.76 (December) and in industrial localities 0.68 (May) to 0.88 (February). The seasonal course of PM2.5/PM10 fraction ratio is connected with the seasonal character of several emission sources. Emissions from combustion sources show higher shares of PM2.5 fraction than for instance emissions from agriculture and reemissions during dry and windy weather. Consequently, heating in the winter period can cause the higher share of PM2.5 fraction in comparison with PM10 fraction. The decrease during the spring and early summer is also explained by the increased amount of larger biogenic particles (e.g. pollen) by some authors [25]. The higher PM2.5/PM10 fraction ratio due to combustion is observed also at industrial stations. The lowest PM2.5/PM10 ratio is at traffic localities (Fig. II.4.2.16). During fuel combustion the emitted particles occur mainly in PM2.5 fraction and thus the ratio should be high in traffic localities. The fact that this is not the case, accents the significance of emissions of larger particles caused by tire, break lining and road surface abrasion. The share of the coarse fraction at traffic stations increases also due to the re-suspension of particles following winter spreading of roads. The growth of PM10 concentrations can be caused also by the increased abrasion of road surface by spreading and the subsequent re-suspension of the abraded material [26].
Tab. II.4.2.4 Stations with the highest numbers of exceedances of the 24-hour limit value of PM10 Tab. II.4.2.5 Stations with the highest values of annual average concentrations of PM10 Tab. II.4.2.7 Stations with the highest values of annual average concentrations of PM2.5
Fig. II.4.2.5 36th highest 24-hour concentrations and annual average concentrations of PM10 in 2002ŌĆō2012 at selected stations with UB, SUB, I and T classification
Fig. II.4.2.6 36th highest 24-hour concentrations and annual average concentrations of PM10 in 2002ŌĆō2012 at selected rural (R) stations
Fig. II.4.2.7 Field of the 36th highest 24-hour concentration of PM10 in 2012
Fig. II.4.2.8 Field of annual average concentration of PM10 in 2012
Fig. II.4.2.9 Stations with the highest exceedance of LV for 24-hour concentrations of PM10 in 2012
Fig. II.4.2.10 Stations with the highest exceedance of LV for annual concentrations of PM10 in 2012
Fig. II.4.2.11 Numbers of exceedances of the limit value for 24-hour concentration of PM10 in 2012
Fig. II.4.2.12 Annual average PM10 concentrations at the stations with the exceedance of the limit value, 2008ŌĆō2012
Fig. II.4.2.13 Annual average concentrations of PM2.5 in the ambient air in 2004ŌĆō2012 at selected stations
Fig. II.4.2.14 Field of annual average concentration of PM2.5 in 2012
Fig. II.4.2.15 Share of localities with the exceedance of the limit value for 24-hour concentrations and annual average concentrations of PM10 and target value for the annual average concentration of PM2.5, 2000ŌĆō2012
Fig. II.4.2.16 Average monthly PM2.5/PM10 ratio in 2012
Fig. II.4.2.17 Stations with the highest exceedance of LV for annual concentrations of PM2.5 in 2012
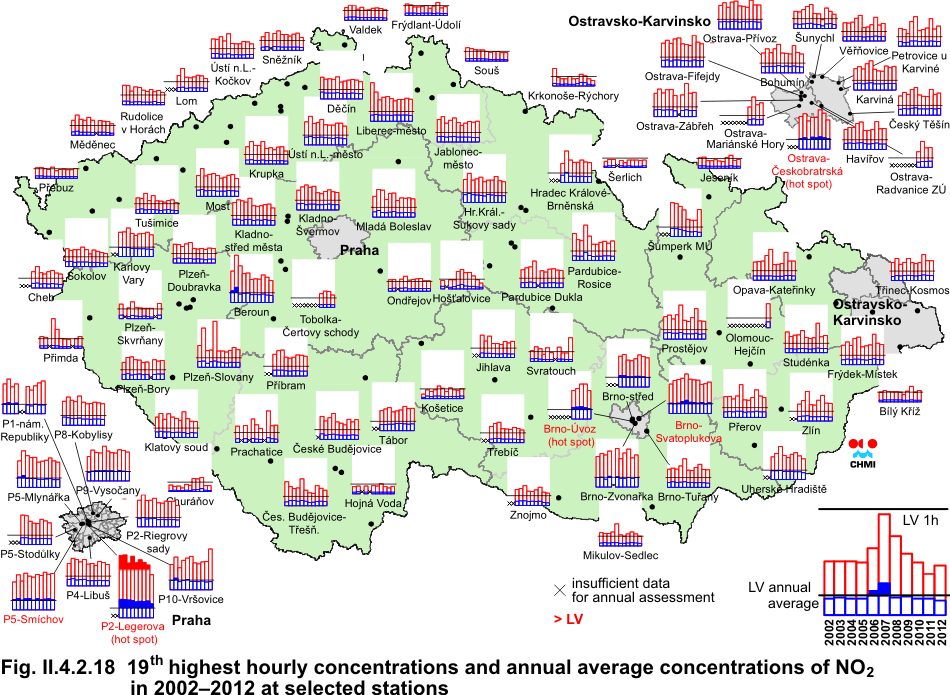
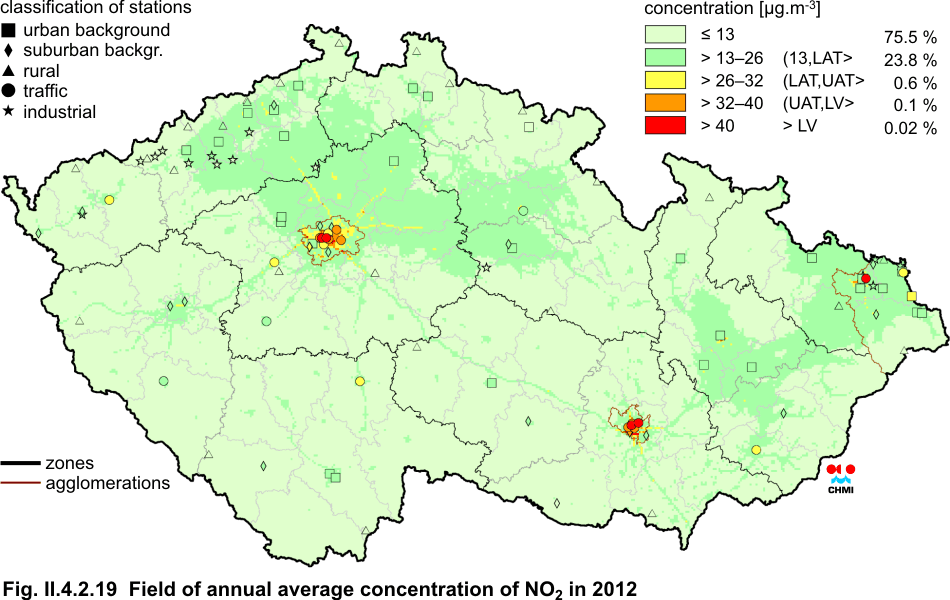
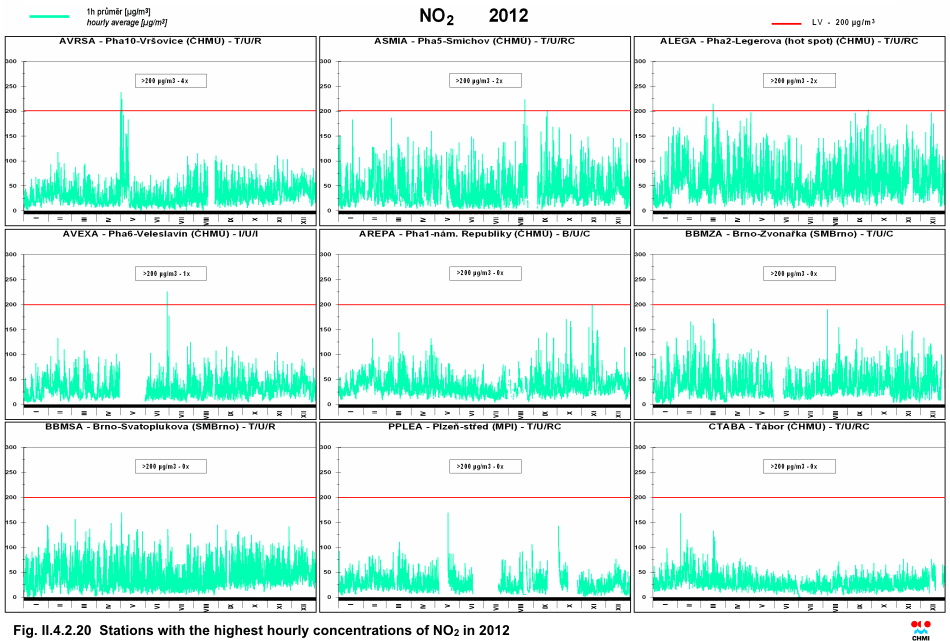
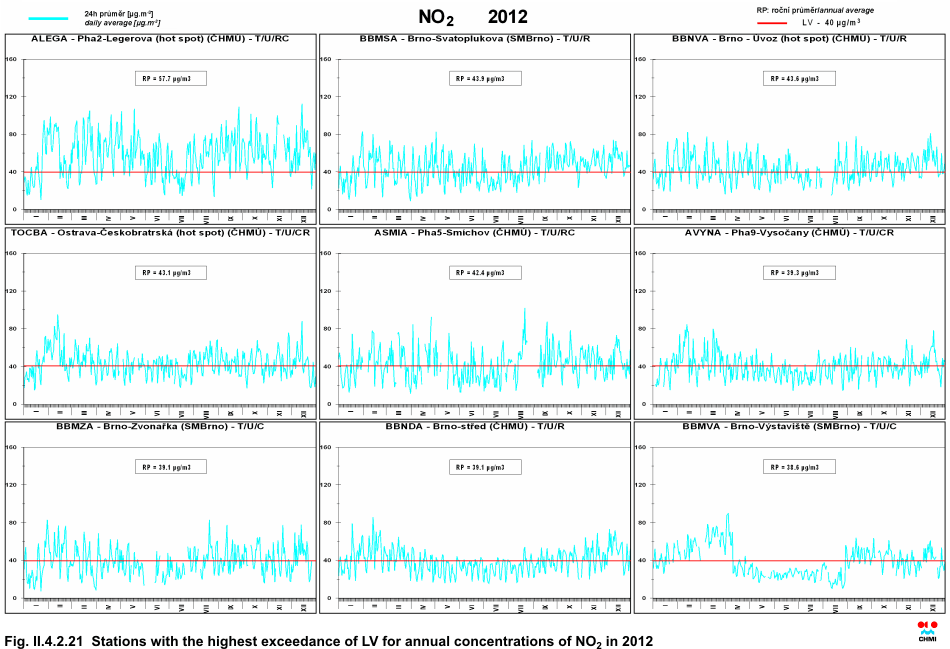
II.4.2.1.3 Nitrogen dioxide In the field of ambient air monitoring and assessment the term nitrogen oxides (NOx) is used for the mixture of (NO) and (NO2) Air pollution limit value for the protection of human health is set for NO2, the limit value for the protection of ecosystems and vegetation is set for NOx. More than 90 % of the total nitrogen oxides in the ambient air are emitted in the form of NO. NO2 is formed relatively quickly in the reaction of NO with ground-level ozone or with HO2 or RO2 radicals. In a number of chemical reactions part of NOx is transformed to HNO3/NO3-, which are removed from the atmosphere through dry and wet deposition. NO2 is dealt with due to its negative influence on human health. It plays also the key role in the formation of photochemical oxidants. In Europe, NOx emissions result mainly from anthropogenic combustion processes during which NO is formed in reaction between nitrogen and oxygen in the combusted air, and partly also by oxidation of nitrogen from the fuel. Road transport is the main anthropogenic source (significant shares however, have also air transport and water transport), and also combustion processes in stationary sources. Less than 10 % of total NOx emissions result from combustion directly in the form of NO2. Natural NOx emissions result mainly from soil, volcanic activity and creation of bolts of lightning. Globally, they are important, on the European scale, however, they represent less than 10 % of total emissions [27]. Exposure to the increased NO2 concentrations affects lung function and can cause lower immunity [28]. The exceedances of annual limit values for NO2 occur only in limited number of stations, and namely in the localities in agglomerations and large cities exposed to traffic. Of the total number of 112 localities in which NO2 was monitored in 2012 the annual limit value was exceeded at 5 stations (Table II.4.2.9). All five stations are classified as traffic urban. It can be expected that the exceedances of the limit values can occur also at other sites exposed to traffic, where there is no measurement. In 2012 none of the stations recorded the exceedance of the limit value for 1-hour NO2 concentration. The exceedance of the limit value (200 ╬╝g.m-3) occurred only at 3 station in Prague, nevertheless in none of them the number of exceedances was higher than 18 days in the year (Prague10-Vr┼Īovice 4x, Prague 5-Sm├Łchov 2x and Prague 2-Legerova hot spot 2x). Fig. II.4.2.18 presents the development of the 19th highest hourly concentration and the annual average concentration of NO2 in the period 2002ŌĆō2012 in selected localities. In 2002, in comparison with the previous years, this decreasing trend of NO2 concentrations stopped and in 2003 there was a slight increase of NO2 pollution at most localities. In 2004 a slight decrease was recorded but in 2005 the increasing trend of NO2 concentrations appeared again, and continued in 2006. In 2007 a marked decrease of NO2 concentrations was recorded due to more favourable meteorological and dispersion conditions, similarly as in 2008; in the following year, 2009, on the contrary, most stations recorded a slight increase of NO2 concentrations. In 2010, in comparison with 2009, there was recorded a slight increase of annual average concentration in more than 70 % of localities. On the contrary, in 2011 in comparison with the year 2010 the NO2 concentrations decreased in most localities. Approximately 80% of localities recorded both the decrease of the 19th highest 1-hour concentration and the annual average. In 2012 this decreasing trend continued. The average annual concentration of NO2 dropped in 71 % of localities and the 19th highest 1-hour concentration in 62 % of localities. The map of the field of NO2 annual average concentration (Fig. II.4.2.19) gives evidence of air pollution in the cities caused mainly by traffic. Figs. II.4.2.20 and II.4.2.21 show the graphs of the courses of daily and hourly concentrations in 2012 showing the evident limit value exceedances in selected localities. When constructing the map in Fig. II.4.2.19 also the updated data on emissions from mobile sources in the Czech Republic were regarded. The higher NO2 concentrations can occur also in the vicinity of local communications with intensive traffic and dense local transport network. Tab. II.4.2.8 Stations with the highest values of the 19th and maximum hourly concentrations of NO2
Tab. II.4.2.9 Stations with the highest values of annual average concentrations
of NO2
Fig. II.4.2.18 19th highest hourly concentrations and annual average concentrations of NO2 in 2002ŌĆō2012 at selected stations
Fig. II.4.2.19 Field of annual average concentration of NO2 in 2012
Fig. II.4.2.20 Stations with the highest hourly concentrations of NO2 in 2012
Fig. II.4.2.21 Stations with the highest exceedance of LV for annual concentrations of NO2 in 2012
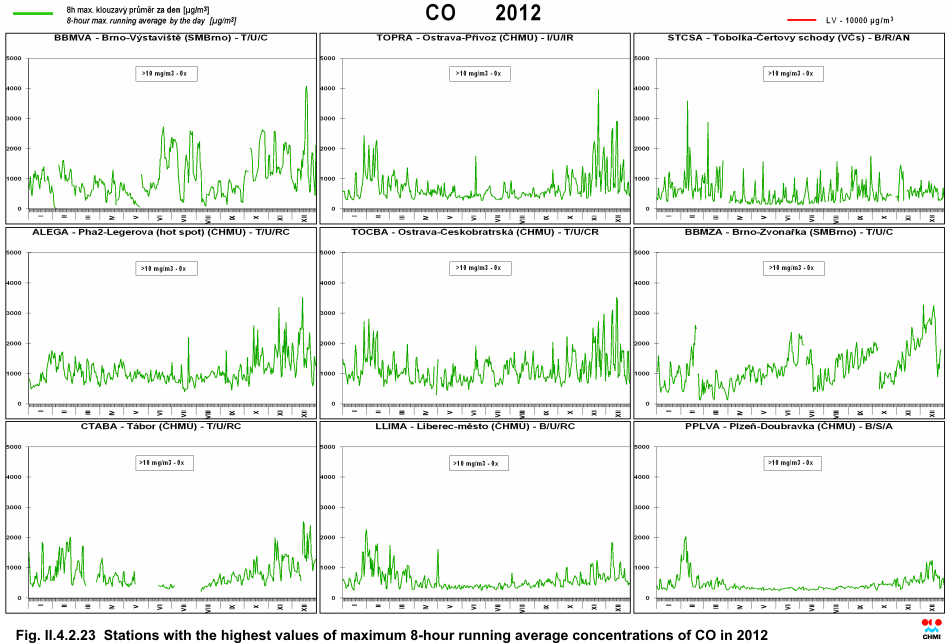
The insufficient burning of fossil fuels may be an anthropogenic source of air pollution caused by carbon monoxide (CO). These processes occur mainly in transport and in stationary sources, namely household heating. Increased CO concentrations can cause headache, deteriorated coordination and attention. CO binds to haemoglobin and the increased concentrations of the created carboxyhaemoglobin reduce the capacity of blood for the oxygen transport. In 2012 carbon monoxide concentrations were measured in 28 localities, classified in most cases as traffic localities in which the highest measured concentrations can be expected. The maximum daily 8-hour running averages did not exceed, similarly as in the previous years, the limit value (10 mg.m-3) at any of the stations (Table II.4.2.10). The highest daily 8-hour average concentration was measured, in the locality Ostrava-P┼Ö├Łvoz (3,971.1 ╬╝g.m-3). The courses of maximum daily 8-hour running averages for selected localities are presented in Fig. II.4.2.23.
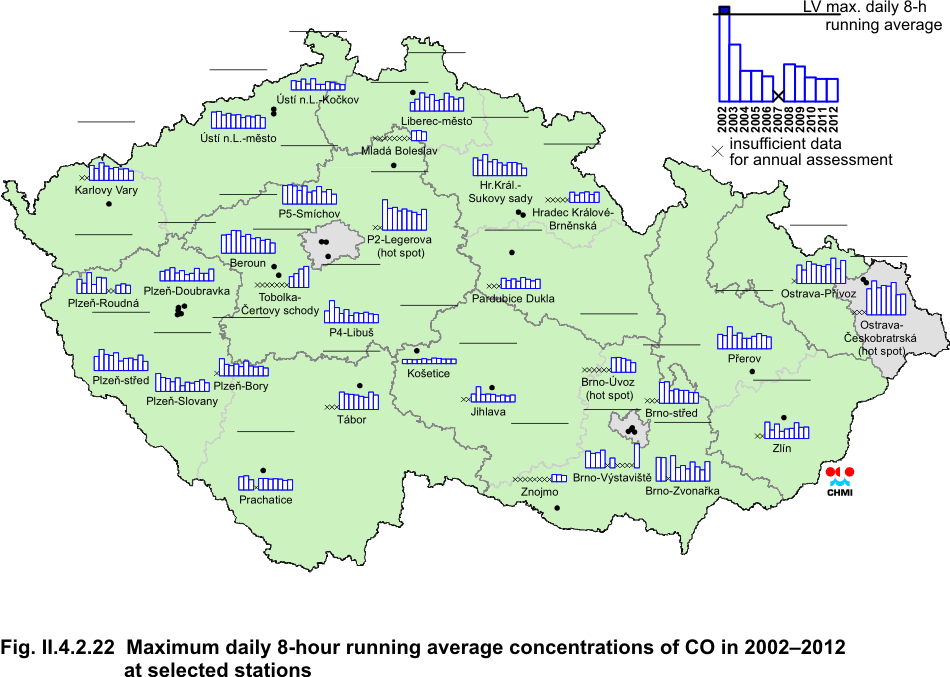
Fig. II.4.2.22 Maximum daily 8-hour running average concentrations of CO in 2002ŌĆō2012 at selected stations
Fig. II.4.2.23 Stations with the highest values of maximum daily 8-hour running average concentrations of CO in 2012
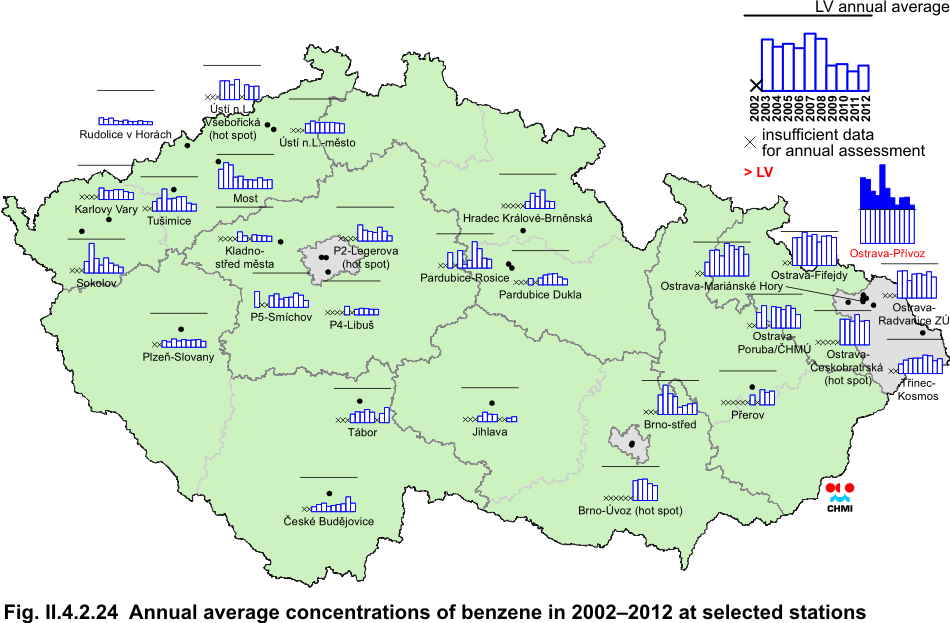
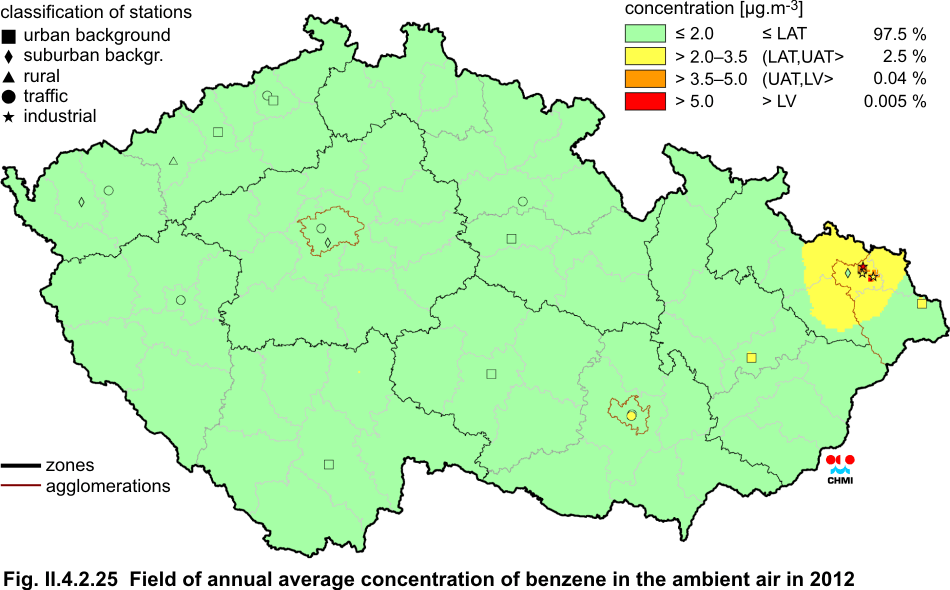
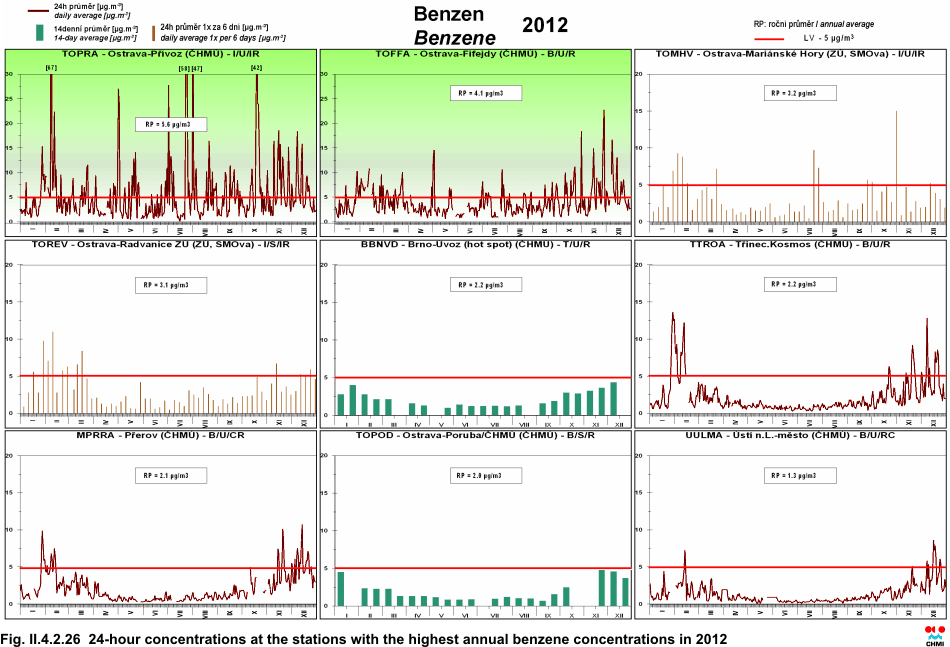
II.4.2.1.5 Benzene The anthropogenic sources produce more than 90 % of total emissions in the air. The decisive emission sources are combustion processes, mainly mobile sources, representing about 85 % of total anthropogenic emissions of aromatic hydrocarbons. The prevailing share is contributed by exhaust gases emissions. It is estimated that the remaining 15 % of emissions come from stationary sources. Many of these are related to industries producing aromatic hydrocarbons and the industries that use these compounds to produce other chemicals. Another significant source is represented by loss evaporative emissions produced during petrol handling, storing and distribution. Exhaust benzene is produced primarily by unburned benzene from fuels. Non-benzene aromatics or non-aromatic hydrocarbons in the fuels can contribute to exhaust benzene emissions. The most significant adverse effects from exposure to benzene are haematotoxicity and carcinogenicity [29]. In 2012 benzene concentrations were measured in total in 23 localities with valid annual average. The limit value is defined as an annual average concentration 5 ╬╝g.m-3. The value of the limit value was exceeded, similarly as in the previous years, in the locality Ostrava-P┼Ö├Łvoz (5.6 ╬╝g.m-3). Higher concentrations in this area are connected with industrial activities (mainly with coke production). In comparison with the year 2011, approximately three quarters of localities recorded the decrease of annual average concentration, one quarter of localities recorded similar concentrations as in 2011. The courses of annual average concentrations in selected localities are shown in Fig. II.4.2.24. Fig. II.4.2.26 presents the annual course of 24-hour averages in selected localities. Tab. II.4.2.11 Stations with the highest values of annual average concentrations of benzene
Fig. II.4.2.24 Annual average concentrations of benzene in 2002ŌĆō2012 at selected stations
Fig. II.4.2.25 Field of annual average concentration of benzene in the ambient air in 2012
Fig. II.4.2.26 24-hour concentrations at the stations with the highest annual benzene concentrations in 2012
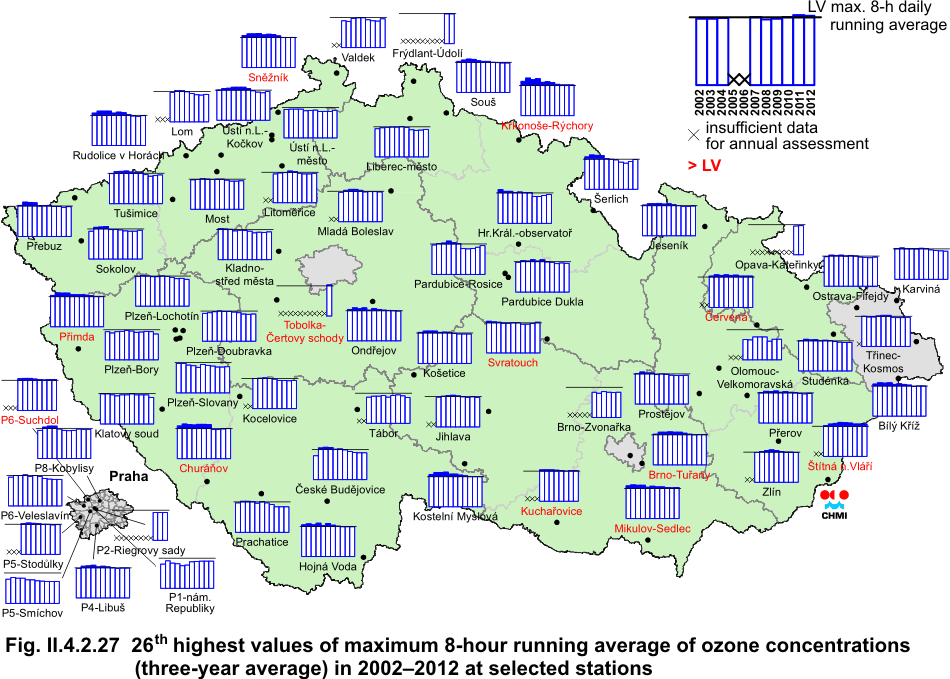
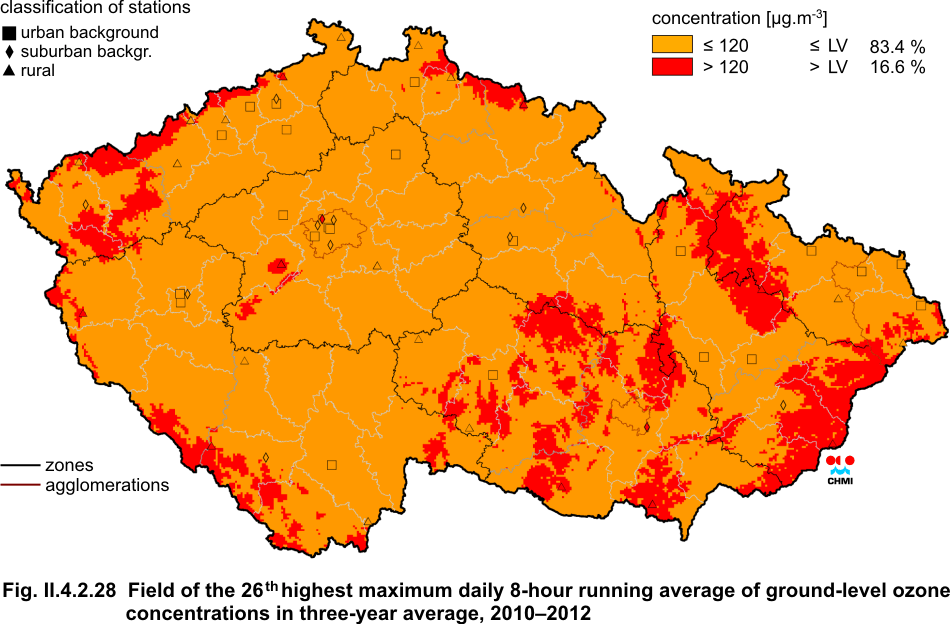
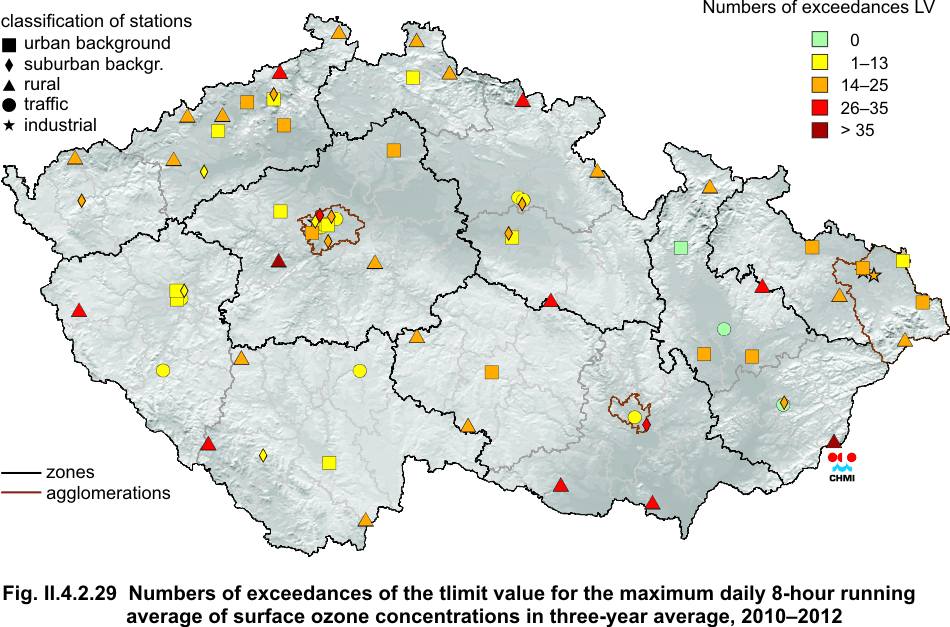
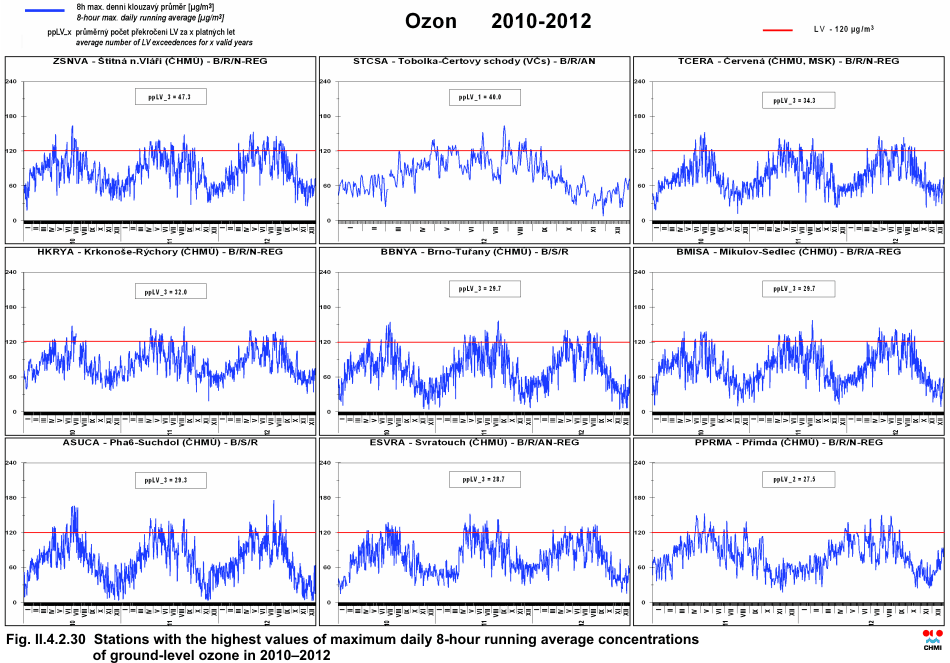
II.4.2.1.6 Ground-level ozone Ground-level ozone is a secondary pollutant in the ambient air with no significant emission source of its own. It is formed under the influence of solar radiation during complex photochemical reactions mainly between nitrogen oxides (NOx), VOCs and other components of the atmosphere. Ozone is a very powerful oxidizing agent. Ozone impairs mainly the respiratory system and irritates mucous membranes. It causes morphological, biochemical and functional changes and impairs the immune system response. There is evidence for ozone toxicity to vegetation. The Act No. 201/2012 Coll., on Clean Air Protection requires the assessment of ozone concentrations in relation to human health protection as an average for the latest three years. If the latest three years are not available, the average for the latest two years or one year is taken into account. In 2012 ozone was measured in 67 localities out of which 12 (17.9 %) exceeded the limit value within the three-year period 2010ŌĆō2012, or shorter. In comparison with the previous three-year period 2009ŌĆō2011 the number of exceedances of the limit value 120 μg.m-3 decreased in 30 % of localities, 58 % of localities recorded the increase and 12 % of localities did not record any difference. Consequently, in comparison with the previous three-year period 2009ŌĆō2011, the situation has changed to a certain extent as it is documented in Fig. II.4.2.29. The comparison of the assessed three-year periods is based mainly on meteorological conditions, i.e. the values of solar radiation, temperature and precipitation in the period from April to September when the highest ozone concentrations are usually measured. When comparing the meteorological conditions in the year 2009, which was not included in the three-year assessment period, and in 2012, there were measured slightly higher temperatures in 2012 during the period AprilŌĆōSeptember (in average by 0.3 ░C). Approximately 96 % of localities monitoring the respective meteorological parameters recorded the increase of maximum temperatures and 82 % of localities recorded the increase of the total values of daily averages of global solar radiation. According to [30] the year-to-year differences in ozone concentrations are, at the current level of the concentrations of ground-level ozone precursors, given primarily by the above mentioned meteorological conditions and the influence of precursors concentrations is not much significant. The comparison of the concentrations of ground-level ozone precursors in 2009 and 2012 shows that in about two thirds of substances included into the VOC group, monitored in detail in Ko┼Īetice and Libu┼Ī, a slight increase of concentrations was recorded. On the contrary, the annual NO2 concentrations slightly decreased (in 55 % of localities) in comparison with the year 2009. With regard to rather complicated atmospheric chemical processes during ozone formation and disintegration, its dependence on absolute amount and relative representation of its precursors in atmosphere, connected also with long-range transboundary air pollution and on meteorological conditions, it is difficult to comment the year-to-year changes in more detail. The localities with the respective numbers of exceedances of the limit value (120 ╬╝g.m-3) are presented in Table II.4.2.12). The traffic localities in the cities are the least loaded ones as ozone is degraded there through chemical reaction with NO, as it is apparent from Fig. II.4.2.50. It can be expected that the ozone concentrations are below the limit value also in other cities with heavier traffic. However, due to the absence of measurements the probable decrease cannot be documented by the use of current methods of map construction. On the contrary, the highest concentrations are measured in rural background localities due to lower concentrations of substances able to degrade ozone (NO). Fig. II.4.2.27 shows the 26th highest value of maximum 8-hour running average of ozone concentrations (three-year average) in 2002ŌĆō2012. Table II.4.2.12 presents the stations with the highest values of maximum daily 8-hour running average ozone concentrations in three-year average. Fig. II.4.2.29 shows the graph of the number of exceedances of the limitt value for ground-level ozone and Fig. II.4.2.30 presents the annual courses of maximum daily 8-hour running averages in the localities with the heaviest loads. Table II.4.2.13 presents the number of hours of the ozone alert threshold exceedance (180 μg.m-3) at selected AIM stations for the period of 1995ŌĆō2012. Fig. II.4.2.50 characterizing the monthly trends of ozone (max. 8-hour running average for the given month) shows apparently the increase of concentrations in spring and summer months due to favourable conditions for ozone formation, such as high intensity of solar radiation, high temperatures and low air humidity. It is apparent that the highest maximum 8-hour running averages are recorded in rural localities, and, on the contrary, the lowest ones are recorded in traffic localities. As against the previous year, the maximum 8-hour running averages in 2012 reached rather higher values; in most types of localities the measured levels exceeded 140 ╬╝g.m-3.
Fig. II.4.2.27 26th highest values of maximum daily 8-hour running average of ground-level ozone concentrations (three-year average) in 2002ŌĆō2012 at selected stations
Fig. II.4.2.28 Field of the 26th highest maximum daily 8-hour running average of ground-level ozone concentrations in three-year average, 2010ŌĆō2012
Fig. II.4.2.29 Numbers of exceedances of the target value for the maximum daily 8-hour running average of ground-level ozone concentrations in three-year average, 2010ŌĆō2012
Fig. II.4.2.30 Stations with the highest values of maximum daily 8-hour running average concentrations of ground-level ozone in 2010ŌĆō2012
II.4.2.1.7 Heavy metals Lead Most lead contained in the atmosphere result from
anthropogenic emissions caused by high-temperature processes, primarily the
burning of fossil fuels, production of iron and steel and metallurgy of non-ferrous
metals. In the natural processes lead is released through the weathering of
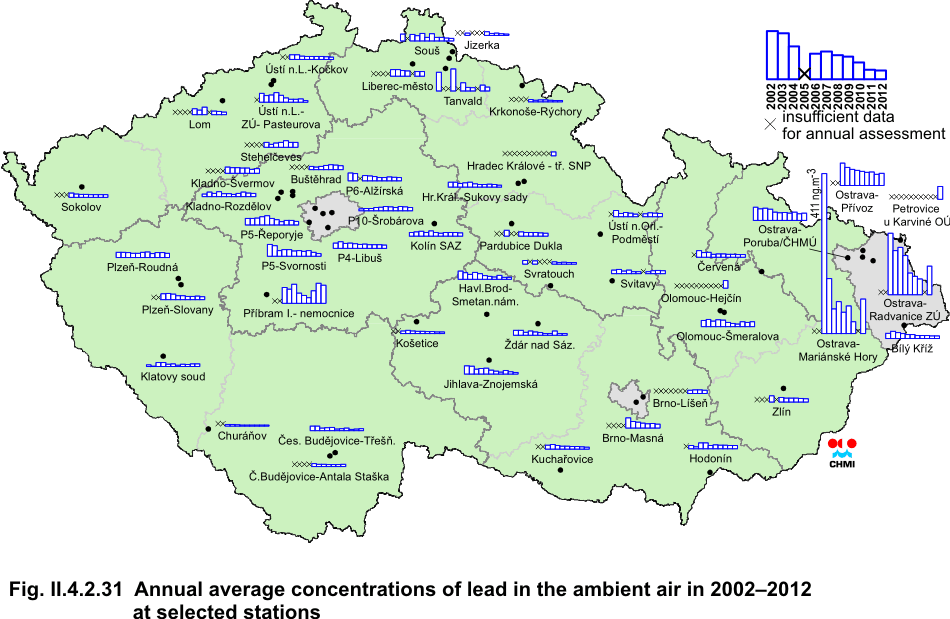
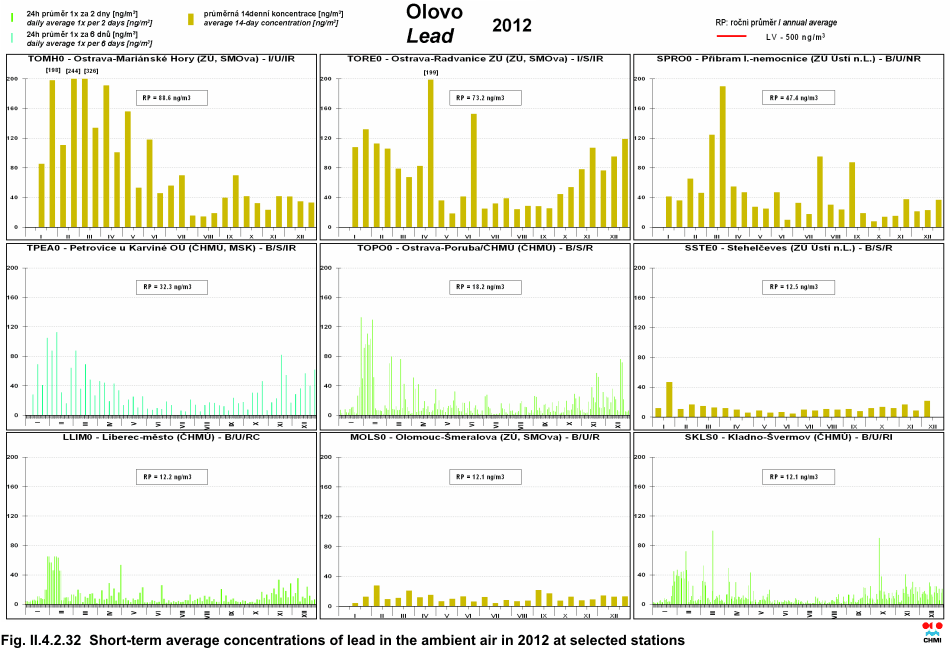
rocks and volcanic activity [31]. The long-term exposure to lead results in harmful impacts on biosynthesis of haem (nonproteinic component of haemoglobin), on nervous system and blood pressure in humans. The exposure to lead brings the risk for the developing foetus; it may negatively influence brain development and consequently the mental development [32, 33]. The International Agency for Research on Cancer (IARC) classifies lead as concerns its carcinogenity in 2B group (i.e. possibly carcinogenic to humans) [34]. None of 51 localities reporting sufficient data for the calculation of the valid annual average for the year 2012 recorded the exceedance of the limit value (500 ng.m-3). The highest annual average was recorded in the locality Ostrava-Mari├Īnsk├® hory (88.5 ng.m-3). With the exception of the year 2011 when the maximum concentration was recorded in the locality P┼Ö├Łbram I-nemocnice, the highest lead concentrations are repeatedly measured in the Ostrava-Karvin├Ī area. Lead concentrations in all localities remain far below the limit value and do not even reach the value of the lower assessment threshold 250 ng.m-3 (see Fig. II.4.2.31). As compared with the year 2011 the concentrations decreased in almost three quarters of localities (of the total number of 45 stations measuring lead concentrations both in 2011 and 2012). The courses of short-term (24-hour or14-day concentrations, depending on the measurement schedule of the given station) average concentrations at selected localities are presented in Fig. II.4.2.32. The highest concentrations were measured at the stations in Ostrava, in the zone
Central Bohemia and at one station in Liberec (Table II.4.2.14).
Fig. II.4.2.31 Annual average concentrations of lead in the ambient air in 2002ŌĆō2012 at selected stations
Fig. II.4.2.32 Short-term average concentrations of lead in the ambient air in 2012 at selected stations
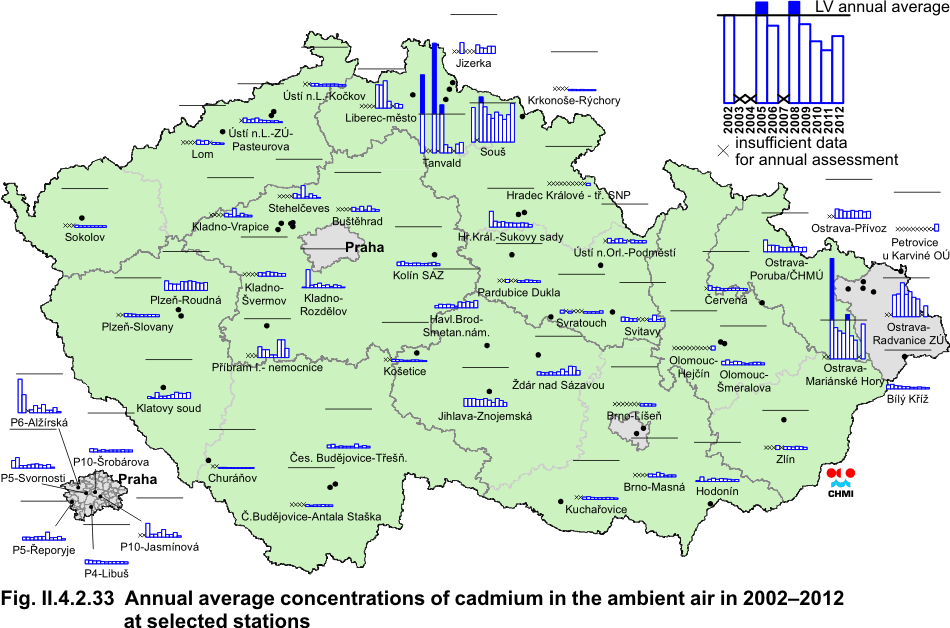
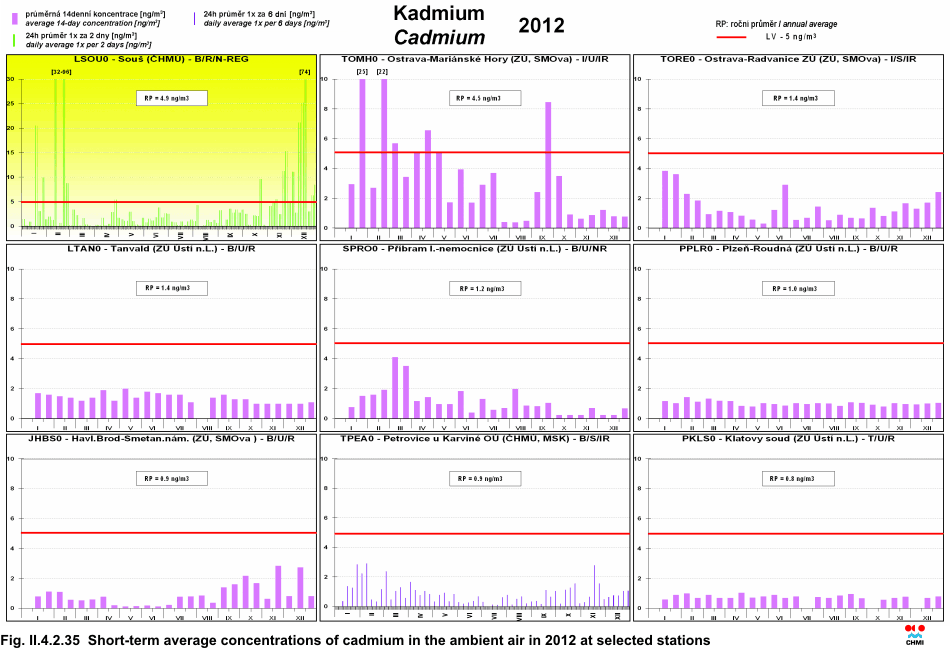
Globally, the anthropogenic sources of cadmium emission in the ambient air represent about 90 % (mainly iron and steel production, metallurgy of non-ferrous metals, refuse incineration and fossil fuels combustion (brown coal, hard coal and heavy fuel oils) [35]. Emissions from transport are less significant. The remaining 10 % represent natural sources (mainly caused by volcanic activity). Cadmium is bound mainly to the fine particles (aerodynamic diameter up to 2.5 μm), with higher risk of negative effects on human health. Almost all cadmium is bound to particles up to 10 μm, while the minimum amount of cadmium is found in particles with diameter above 10 μm. Long-term exposure to cadmium has negative effects to kidney as well as the breathing system, which could result in lung cancer [28]. Its carcinogenic effects are evident in experimental animals and in humans [34]. None of 51 localities which measured the valid annual average exceeded the annual limit value (5 ng.m-3) in 2012. Similarly as in two previous years the highest annual average was measured in the locality Sou┼Ī (4.9 ng.m-3). As compared with the year 2011 there was recorded a decrease of average annual concentration in more than 70 % of localities (of the total number of 45 stations measuring lead concentrations both in 2011 and 2012). The development of annual average concentrations in the period of 2002ŌĆō2012 is apparent from Fig. II.4.2.33. The courses of short-term (24-hour or 14-day concentrations, according to the measurement schedule at the respective station) average cadmium concentrations in selected localities in 2012 are presented in Fig. II.4.2.35. The stations with the highest values of annual average concentrations are
presented in Table II.4.2.15.
Fig. II.4.2.33 Annual average concentrations of cadmium in the ambient air in 2002ŌĆō2012 at selected stations
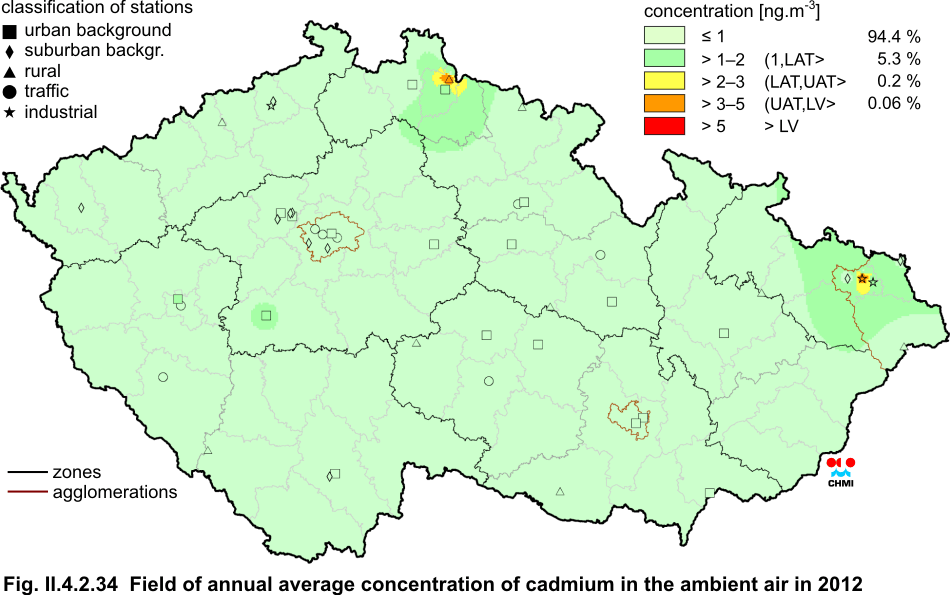
Fig. II.4.2.34 Field of annual average concentration of camium in the ambient air in 2012
Fig. II.4.2.35 Short-term average concentrations of cadmium in the ambient air in 2012 at selected stations
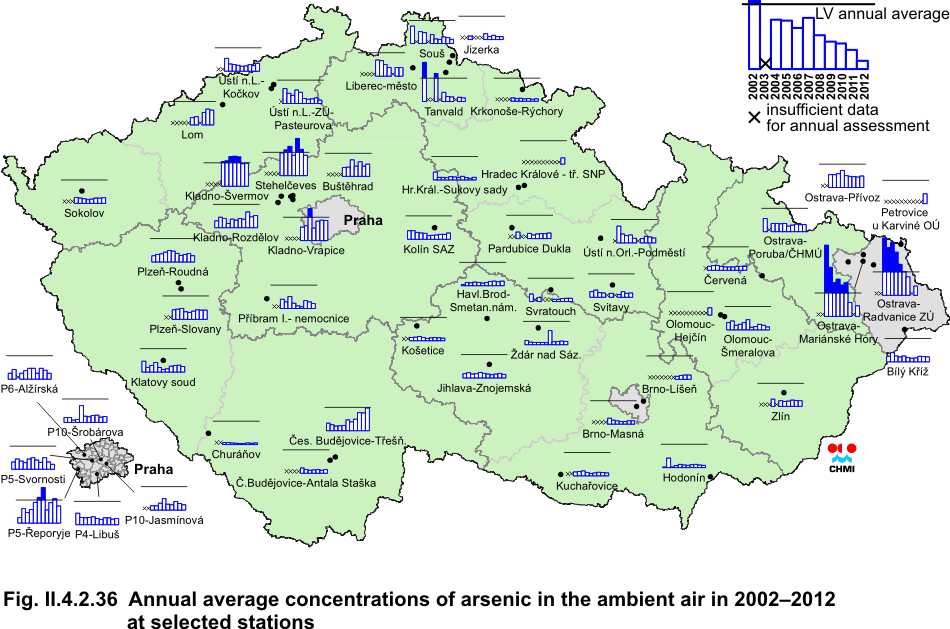
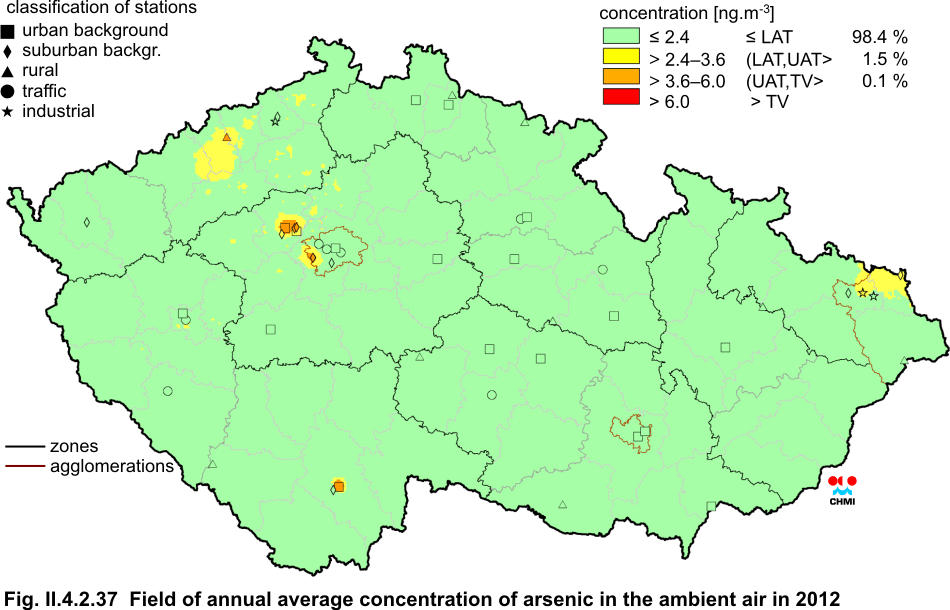
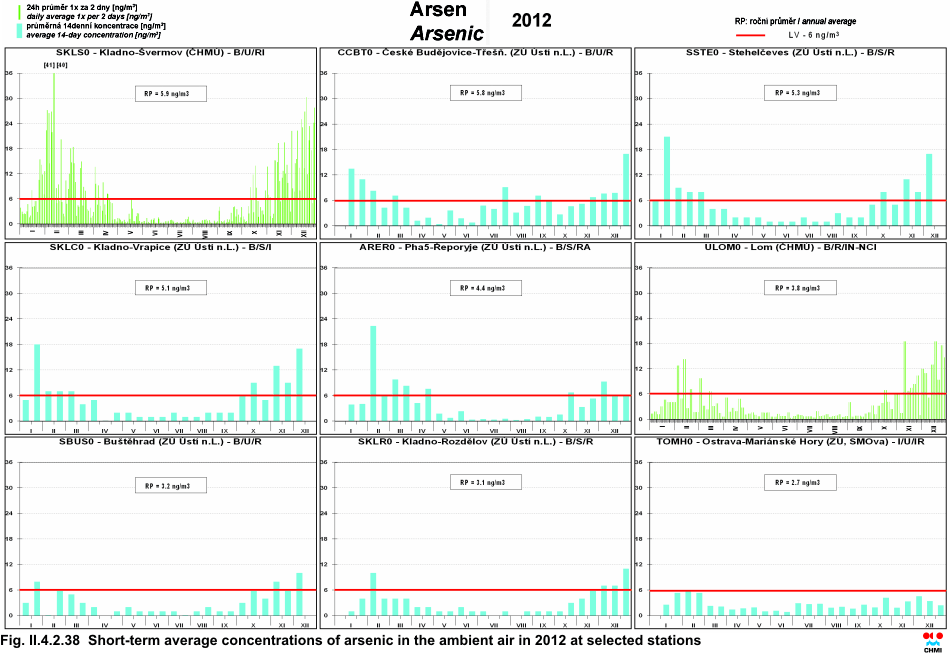
Arsenic Arsenic occurs in many forms of inorganic and organic compounds. Anthropogenic sources produce about three quarters of total emissions in the ambient air. Significant amounts are contributed mainly from combustion processes (brown coal, hard coal and heavy fuel oils), iron and steel industry and production of copper and zinc. Main natural sources of arsenic include mainly volcanic activity, wildfires, weathering of minerals and activity of microorganisms (in wetlands, swamps and circumlittoral areas). Arsenic occurs largely in fine fractions (aerodynamic diameter up to 2.5 μm), which can be transported over long distances and can penetrate deeply into the respiratory system. Almost all arsenic is bound to particles with aerodynamic diameter up to 10 μm [35]. According to IARC [34] classification there is evidence of arsenic carcinogenicity to humans. Inorganic arsenic can cause acute, subacute or chronic effects (local or affecting the whole organism). Lung cancer can be considered the critical effect following inhalation exposure [29, 35]. None of the total number of 51 localities which reported sufficient data for the calculation of the valid annual average for the year 2012 exceeded the limit value. In 2012 the limit value for arsenic, i.e. no exceedance of the annual average concentration 6 ng.m-3 at any of the measuring stations, was met for the first time since 1986 when measurements of arsenic in SPM, resp. in PM10 was launched. In comparison with the previous year 2011 approximately in more than half of the localities recorded the decrease of the annual average concentration. The development of annual average concentrations during the years 2002ŌĆō2012 is apparent from Fig. II.4.2.36. The courses of short-term (24-hour or 14-day concentrations, according to the measurement schedule at the respective station) average arsenic concentrations show the seasonal character and confirm the significant arsenic contribution from the burning of fossil fuels (Fig. II.4.2.38). The stations with the highest annual average concentrations are presented in
Table II.4.2.16.
Fig. II.4.2.36 Annual average concentrations of arsenic in the ambient air in 2002ŌĆō2012 at selected stations
Fig. II.4.2.37 Field of annual average concentration of arsenic in the ambient air in 2012
Fig. II.4.2.38 Short-term average concentrations of arsenic in the ambient air
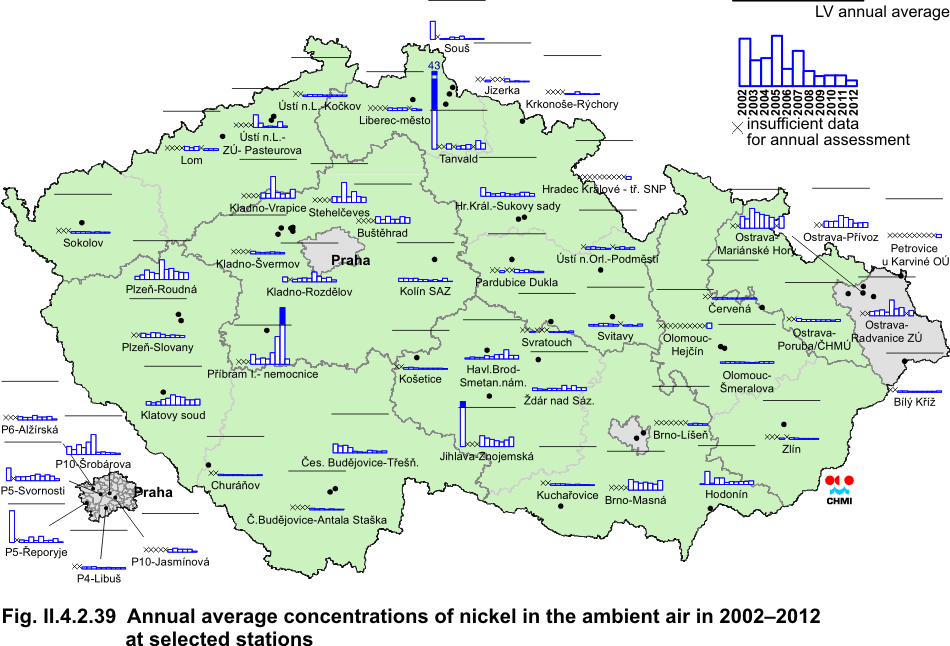
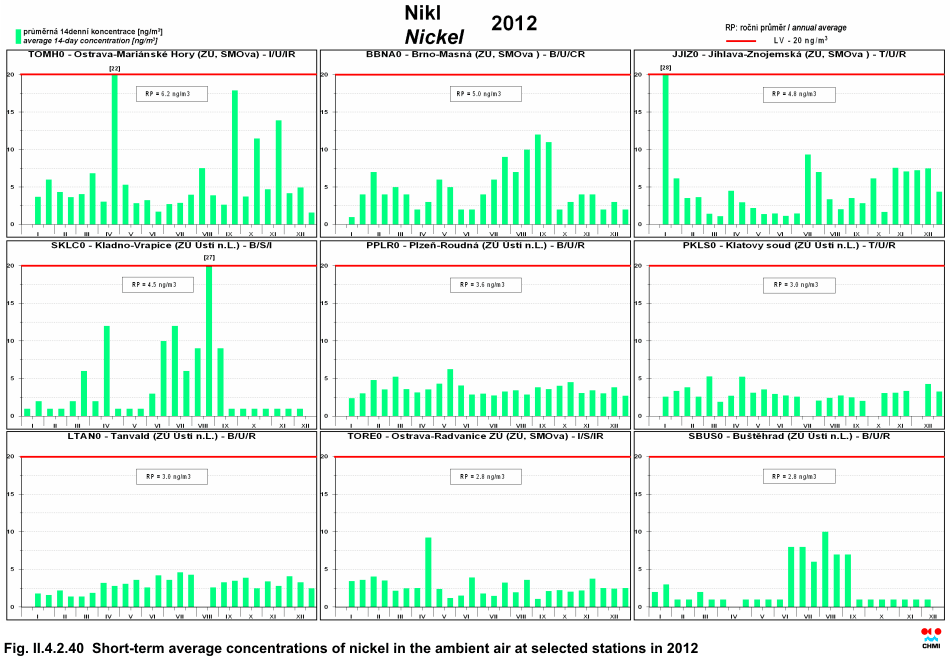
in 2012 at selected stations Nickel Nickel is the fifth most abundant element of the earth core, though in the earth crust its percentage share is lower. The main anthropogenic sources, which globally represent over 60 % of total emissions, include metallurgy, mining of nickel-containing ores and nickel refinement, waste incineration and fossil fuels combustion. Main natural sources include continental dust and volcanic activity [35]. Nickel occurs in the atmospheric aerosol in several chemical compounds which differ by its toxicity for human health and ecosystems. About 70 % of particles containing nickel comprise the fraction smaller than 10 ╬╝m. These particles can be transported over long distances. About 30 % of particles containing nickel have aerodynamic diameter equal or higher than 10 ╬╝m and quickly settle in the vicinity of the source [35]. The health effects of nickel include allergic dermatitis, it can affect the respiratory system and human immune system [28, 32]. Nickel compounds are classified by IARC as a proven human carcinogen, metallic nickel and it alloys are classified as possible carcinogen [34]. None of 51 localities reporting sufficient data for the calculation of the valid annual average for the year 2012exceeded the limit value. The highest concentration 6.2 ng.m-3 was measured at the station Ostrava-Mari├Īnsk├® hory. The slight decrease of annual average concentration as compared with the previous year was recorded in more than half of localities. The stations with the highest values of the annual average concentrations are presented in Table II.4.2.17. The annual course of short-term (14-day) nickel concentrations is apparent from
Fig. II.4.2.40.
Fig. II.4.2.39 Annual average concentrations of nickel in the ambient air in 2002ŌĆō2012 at selected stations
Fig. II.4.2.40 Short-term average concentrations of nickel in the ambient air in 2012 at selected stations
The cause of the presence of benzo(a)pyrene, the main
representative of polycyclic aromatic hydrocarbons (PAH) in the ambient air is,
similarly as in other PAH, the insufficient burning of fossil fuels both in
stationary and mobile sources, and also some technologies, as coke and iron
production. Stationary sources are represented mainly by local heating (coal and
wood combustion) which produces more than 60 % of total benzo(a)pyrene emissions,
and waste combustion. Mobile sources are represented mainly by diesel
compression ignition engines. Mobile sources are the second most significant
source of benzo(a)pyrene emissions (more than 20 %) in the Czech Republic [32,
36]. The natural sources of benzo(a)pyrene include wildfires and volcanic
eruptions which may contribute to the local background levels of benzo(a)pyrene
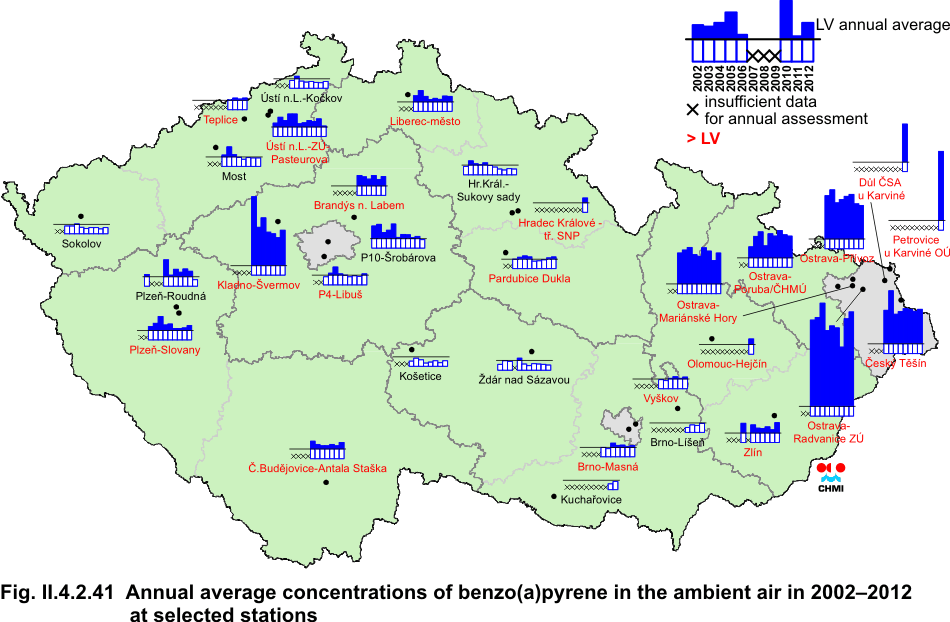
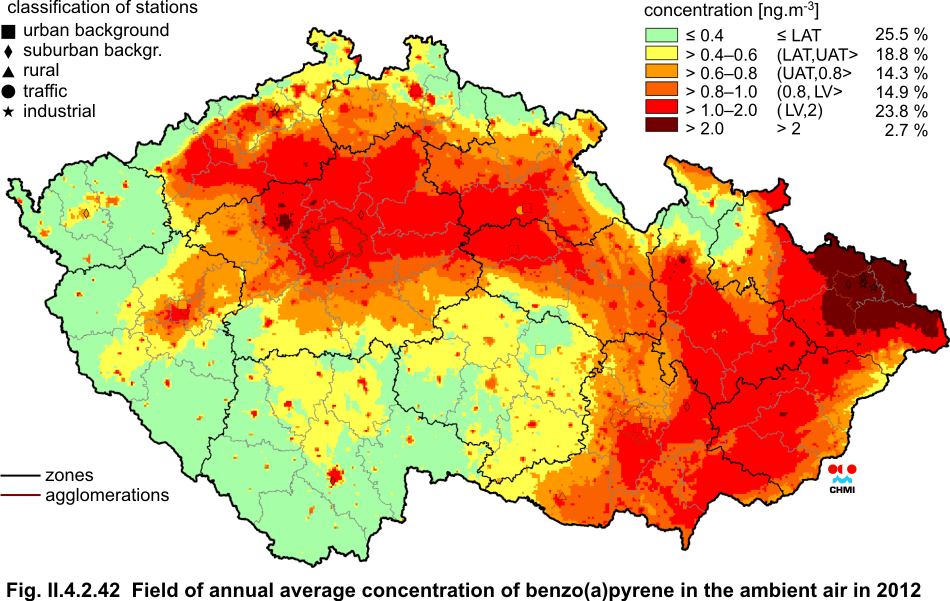
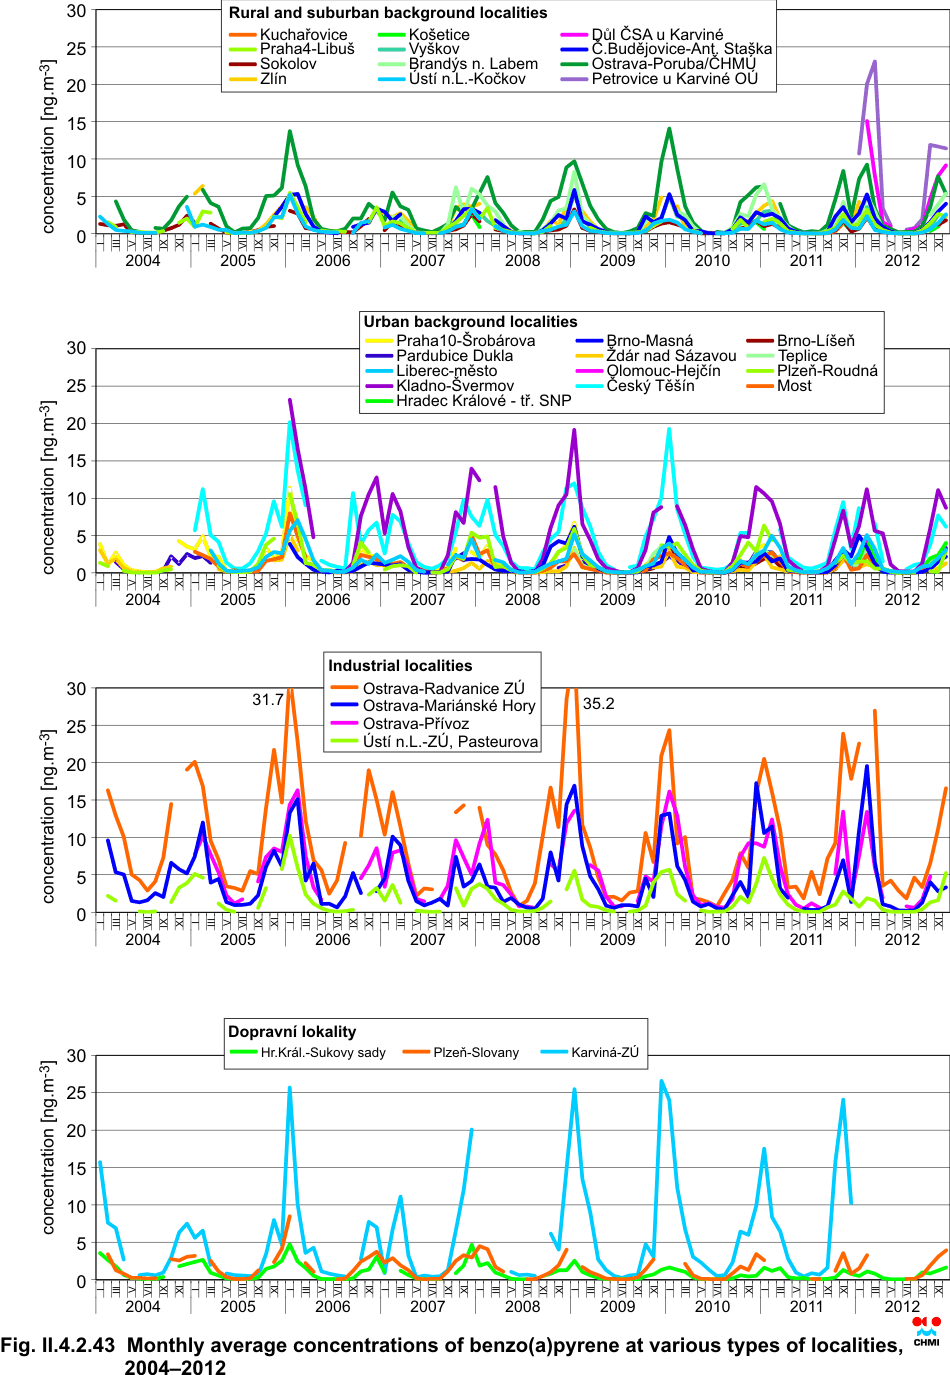
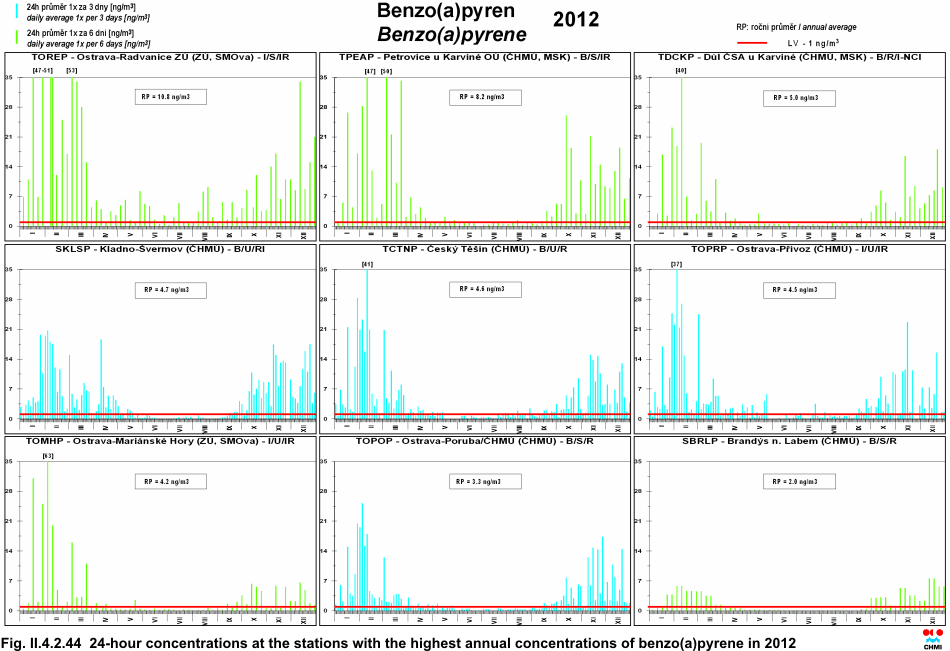
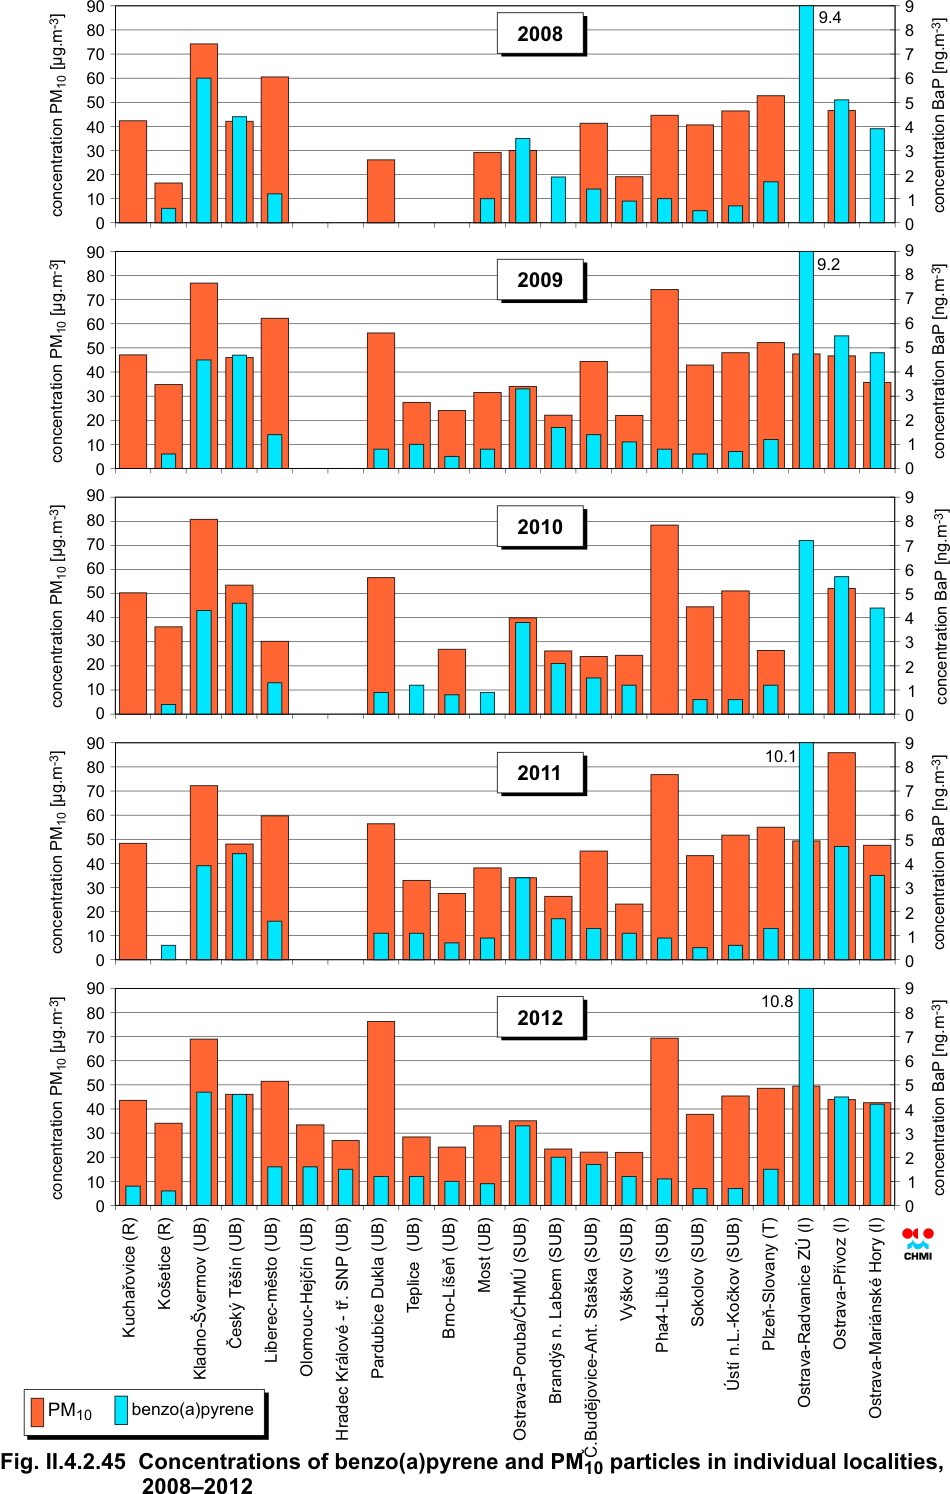
[37]. In 2012 the annual average benzo(a)pyrene concentrations exceeded the limit value at 20 of 29 stations with sufficient number of measurement for the assessment. In the year-to-year comparison there was no significant change, because in 2011 exceedances were recorded in 23 localities of 30 (with sufficient number of the measured date for the assessment). The average concentration (averaged for all types of stations that measured both in 2011 and 2012) reached the value 2.20 ng.m-3; in 2011 2.12 ng.m-3. The highest annual average concentration in 2012 was measured, similarly as in the previous years, in the industrial locality Ostrava-Radvanice Z├Ü (10.8 ng.m-3) with almost elevenfold exceedance of the level of the limit value. High above-the-limit concentrations, however, are reached also in traffic localities as well as in the background urban and suburban localities. A number of towns and villages were assessed, similarly as in the previous years, as the areas with the exceeded limit value (Fig. II.4.2.42). In 2012 the limit value was exceeded in 26.5 % of the territory of the Czech Republic (in 2011 in 16.8 % of the territory of the Czech Republic). The percentage of inhabitants exposed to the above-the-limit benzo(a)pyrene concentrations in 2012 is estimated to 66.26 % (in 2011 it was approx. 60.2 %). It is necessary to consider that the estimate of the fields of annual average benzo(a)pyrene concentrations (Fig. II.4,2.42), in comparison with other mapped pollutants, is loaded with the greatest uncertainties resulting from insufficient density of measurement. The uncertainty of the map is influenced also by the absence of measurements at rural regional stations. However, the uncertainty is contributed also by the absence of measurements in small settlements in the Czech Republic which would represent the fundamental influence of local heating as concerns ambient air quality pollution caused by benzo(a)pyrene. The average annual concentrations in comparison with the year 2011 slightly increased in 61 % of localities. The development of average annual concentrations in individual localities during the years 2002ŌĆō2012 is apparent from Fig. II.4.2.41. Benzo(a)pyrene concentrations show the marked annual course with the maxima in the winter period (due to the seasonal sources, worse dispersion conditions and easier gas-particles conversion) and the minima in the summer period (due to the end of the heating season and the chemical and photochemical disintegration of benzo(a)pyrene). The increased concentrations during the winter period (Figs. II.4.2.43,
II.4.2.44 and II.4.2.50) confirm the influence of local heating; in 2012 this
applied mainly to the periods JanuaryŌĆōMarch and OctoberŌĆōDecember. The maximum
concentrations in February correspond with bad dispersion conditions in this
month. Moreover, February was the coldest month of the year 2012 (more details
see Chapter II.5), which might have contributed also to higher intensity of
heating. The annual courses of short-term concentrations (24-hour once in 3 or 6
days) of benzo(a)pyrene in localities with highest annual averages are apparent
from Fig. II.4.2.44. The fluctuations of monthly averages of concentrations for
different types of stations in 2004ŌĆō2012 are shown in Fig. II.4.2.43.
Fig.
II.4.2.45 depicts benzo(a)pyrene concentrations in individual localities in
2008ŌĆō2012 in relation to PM10 concentrations, resp. to its fine fraction PM2.5
to which benzo(a)pyrene is mainly bound.
Fig. II.4.2.41 Annual average concentrations of benzo(a)pyrene in the ambient air in 2002ŌĆō2012 at selected stations
Fig. II.4.2.42 Field of annual average concentration of benzo(a)pyrene in the ambient air in 2012
Fig. II.4.2.43 Monthly average concentrations of benzo(a)pyrene in various types of localities, 2004ŌĆō2012
Fig. II.4.2.44 24-hour concentrations at the stations with the highest annual concentrations of benzo(a)pyrene in 2012
Fig. II.4.2.45 Concentrations of benzo(a)pyrene and PM10 particles in individual
localities, 2008ŌĆō2012 II.4.2.1.9 Other substances Mercury Main anthropogenic sources of mercury include combustion of fossil fuels, chlor-alkali production, metallurgy, cement production and refuse incineration. Mercury and its compounds are used in paint industry, battery production, measuring and control instruments (thermometers) [38]. The natural sources (representing about 60 % of total emissions) include mainly mercury evasion from aquatic ecosystems and vegetation, volcanic activity and de-gassing from mercury-rich minerals. As for anthropogenic emissions it is estimated that in Europe approximately 60 % of mercury is emitted in the form of elemental vapour Hg0, 30 % as divalent mercury (Hg (II)), and only 10 % as particulate phase mercury (Hg(p)). Most emissions from natural sources are in gaseous form Hg0 [38]. Studies of occupationally exposed humans have shown adverse effects on the central nervous system and kidneys at high mercury vapour levels [38]. The increased concentrations in the ambient air result in higher atmospheric deposition on top water layers and, consequently, in higher methylmercury concentrations in freshwater fish and its accumulation in food chains [38, 39]. In spite of the fact that the limit value for mercury has not been set yet, the Czech national legislation recommends, pursuant to the European directives, to carry out its monitoring and assessment according to the annual arithmetic mean. In 2012 the CHMI ISKO database received data on mercury concentrations in PM10 particles in the ambient air from the locality Ko┼Īetice where the annual average reached the value 0.016 ng.m-3. Table II.4.2.19 presents the overview of the stations measuring mercury in the ambient air and the annual average and maximum 24-hour concentrations. Ammonia Major part of ammonia emitted in the ambient air is created by disintegration of nitrogenous organic materials from domestic animals breeding. The remaining amount is emitted through combustion processes or production of fertilizers. It is apparent that ammonia emissions in the ambient air are contributed by vehicles (formation of ammonia in catalytic convertors). Ammonia has irritating effects on eyes, skin and respiratory system. Chronic exposure to increased concentrations can cause headache and vomiting [39]. Quite significant are ammonia odour annoyance impacts on the population. Similarly as in the case of mercury, the limit value for ammonia is not defined in the current European and Czech legislation. Ammonia monitoring was carried out in 2 localities in 2012. As compared with the year 2011 the number of localities monitoring ammonia lowered from 3 to 2. The NH3 measurement in the locality Mikulov-Sedlec was closed. The highest annual average concentration was measured, similarly as in 2011, at the station Pardubice-Dukla (5.1 μg.m-3). This value however slightly increased as against the previous year (from 4.4 μg.m-3). Table II.4.2.20 presents the overview of stations measuring ammonia in the ambient air and annual average and maximum 24-hour concentrations.
Elemental and organic carbon in the particles of PM2.5 fraction It is a known fact that carbon is an important component of particles of PM2.5 and PM10 fractions [40, 41]. The results [41, 42] show that in Europe the average share of carbon is 20ŌĆō40 % of PM10 fraction and 25ŌĆō50 % of PM2.5 fraction. As concerns carbon in aerosol, we distinguish organic carbon (OC) and elemental carbon (EC). Due to their varied physical and chemical properties both EC and OC have significant impact on climate and human health [43, 44]. EC is formed mainly in insufficient combustion of fossil fuels, and primarily in urban traffic. Other sources include biomass burning which, however, is much less significant and its impact is apparent mainly during winter in rural settlements or when fires take place [45]. OC can be emitted also directly in the solid phase, or its formation is secondary through gas-particles transformation in the atmosphere [46]. Primary OC is created also during the combustion of fossil fuels, in biomass burning or the particles are of biological nature (e.g. plant residues). The EC/OC proportion suggests the proportion of emission sources. Carbon in the form of EC and OC has been monitored since 2009 in PM2.5 fraction in the locality Ko┼Īetice. The results of the 2012 measurements are presented in Table II.4.2.21. The annual average of EC in PM2.5 fraction was 0.5 ╬╝g.m-3, the annual average of OC in PM2.5 fraction reached the value 3.6 ╬╝g.m-3 in 2012.
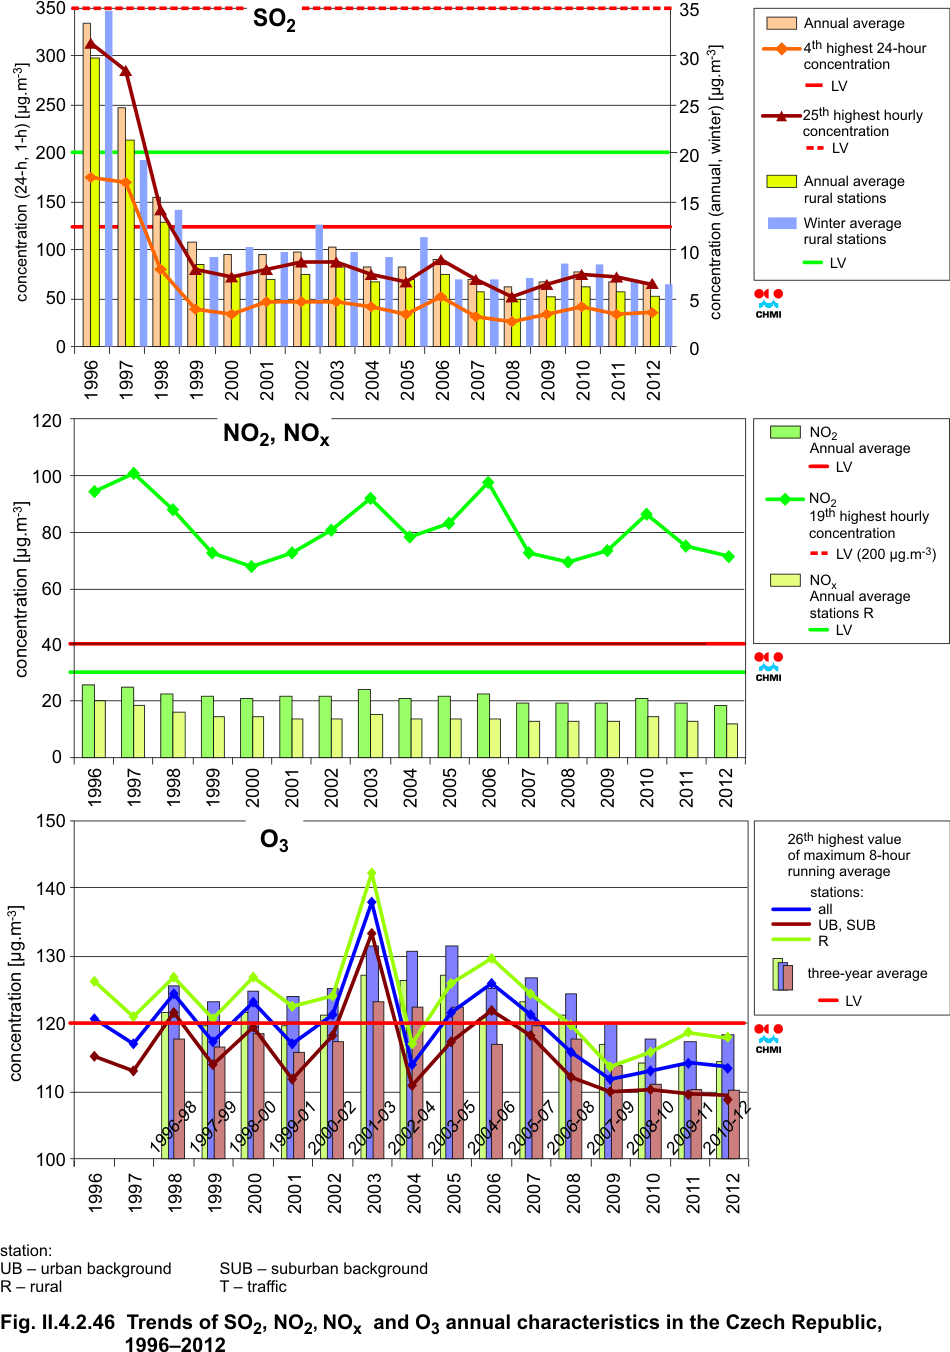
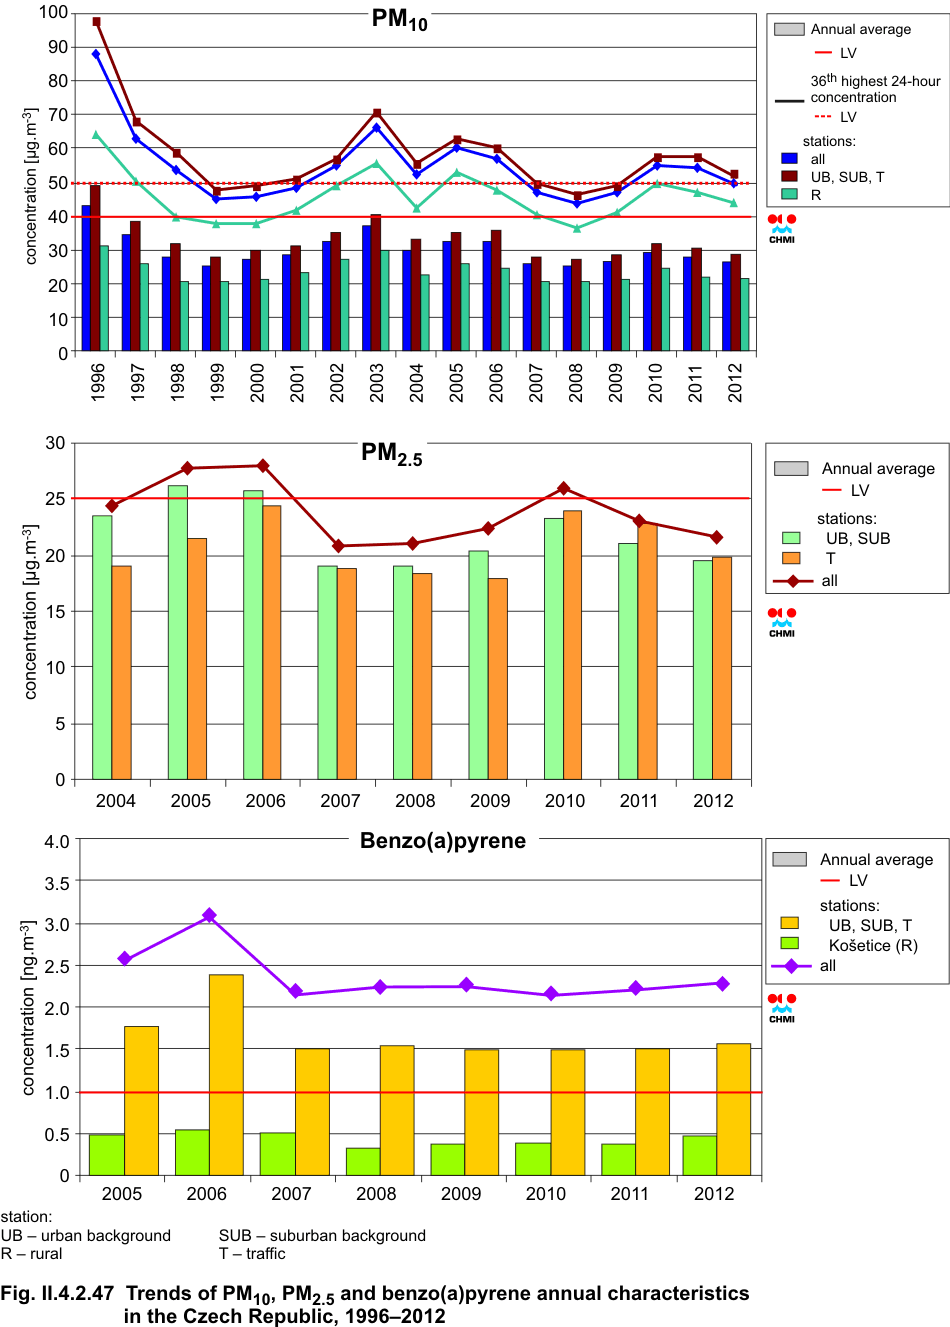
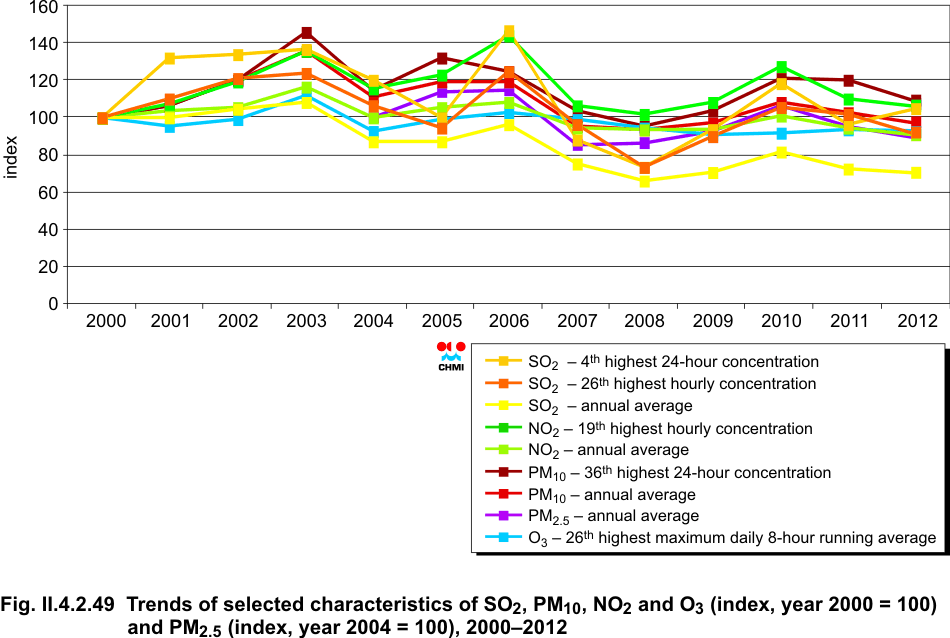
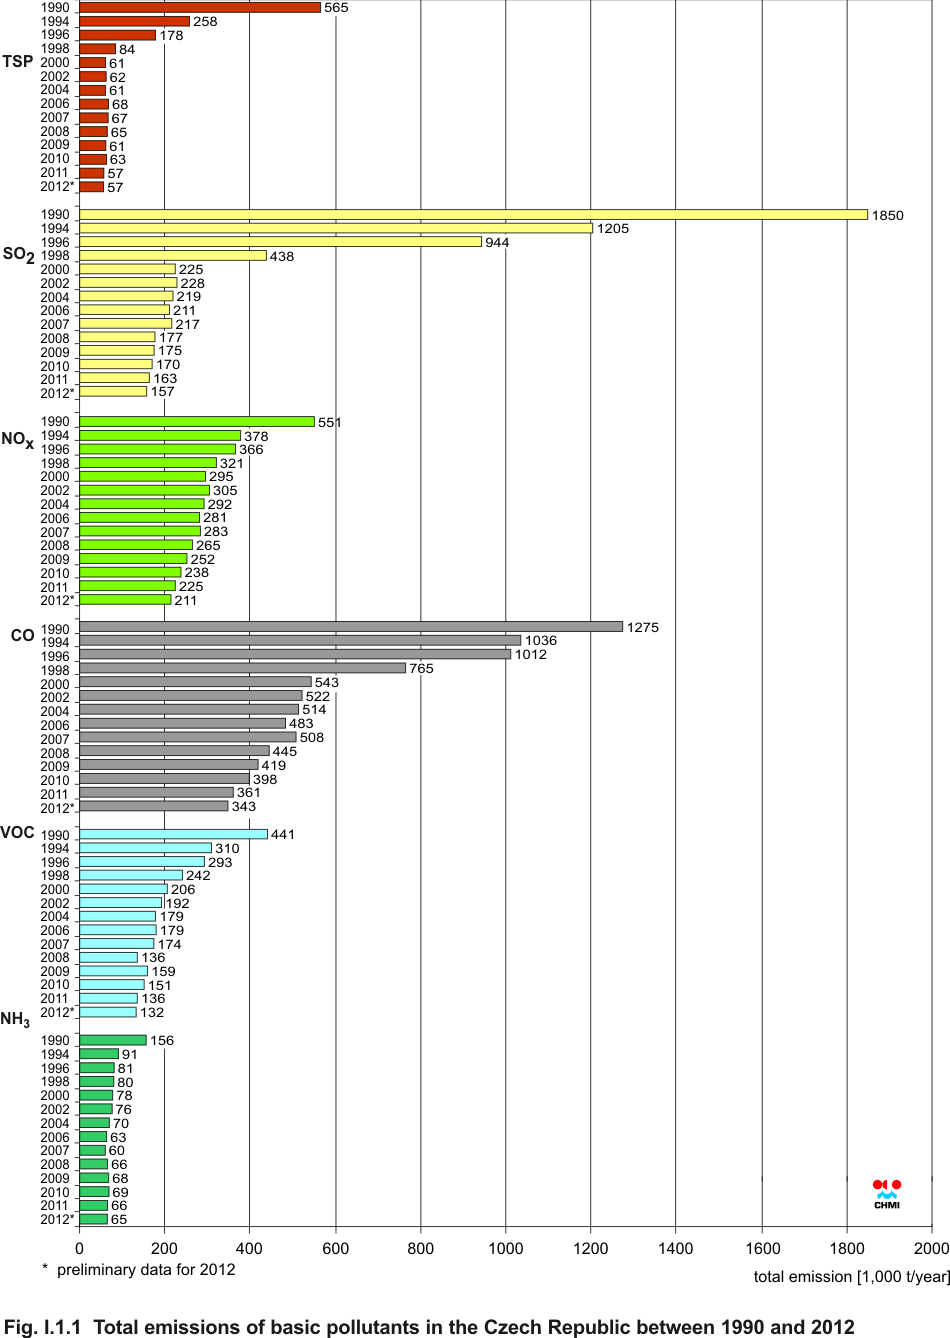
The trends of SO2, PM10, NO2, NOx and O3 annual air pollution characteristics in the Czech Republic for the period of 1996ŌĆō2012, and further of benzo(a)pyrene and PM2.5 for the period 2004ŌĆō2011 are shown in Figs. II.4.2.46 and II.4.2.47. Result concentrations of pollutants in the Czech Republic and in agglomerations, related to the respective years, represent average values from the stations which measured for the whole monitored period. In the 90Æs air pollution caused by SO2, PM10, NO2 and NOx had a decreasing trend in the whole Czech Republic, and mainly due to a marked decrease of pollutantÆs emissions. In 1996ŌĆō2000 there was apparent a marked decrease of SO2 concentrations (by ca 70ŌĆō80 % depending on the respective air pollution characteristic) and PM10 concentrations (by ca 50ŌĆō60 %) ŌĆō Fig. II.4.2.481. The development of the trends of concentrations of individual pollutants is influenced by the decrease of emissions, by the change of the composition of industrial production and transport means and the used fuels, On the other hand, there is a great influence of meteorological and dispersion conditions. Since 2001 the previous decreasing trend stopped and, on the contrary, in comparison with the year 2000, the ambient air pollutantÆs concentrations stagnated or increased (Fig. II.4.2.49). The decrease of emissions after the year 2000 was not as steep as in the 90Æs of the 20th century (Fig. I.1.1) and it can be expected that ambient air quality is presently influenced mainly by meteorological and dispersion conditions in the course of the year. In 2001ŌĆō2003 the concentrations of SO2, PM10, NO2 and NOx increased and in 2003 the reach their maximum levels with regard to the assessment of the development over the recent 10 years. High concentrations of pollutants in the year 2003 were caused both by unfavourable dispersion conditions in February and December, and by subnormal amount of precipitation. In 2004 this increasing trend of air pollution caused by PM10, NO2 and NOx finished and, on the contrary, certain decrease of these pollutantsÆ concentrations occurred, reaching almost the levels of the year 2001. In 2005 the PM10 and NO2 concentrations returned back to the increasing trend, in PM10 the increase was steeper, beyond the level of the year 2002, and also PM2.5 concentrations were increased. This increasing trend was confirmed in 2006 in NO2 and in annual PM10 concentrations (at urban stations); more significant increase was recorded in case of one-hour NO2 concentrations ŌĆō it almost reached the level of the year 1997. On the contrary, 24-hour PM10 concentrations recorded a slight decrease. Annual PM2.5 concentrations stagnated. Between 2003 and 2005 a slight decrease of SO2 concentrations was observed. The increase of some air pollution characteristics in 2005 and 2006 was given mainly by deteriorated dispersion conditions. In 2007 the fluctuating trend of the levels of the above pollutantsÆ concentrations stopped and there was recorded a marked decrease of air pollution caused by SO2 and PM10 (both in towns and in the country), PM2.5, NO2 and NOx in all monitored air pollution characteristics. The steepest decrease is evident, after the previous increase, in hourly NO2 concentrations. The decrease of pollutantsÆ concentrations in 2007 was given by more favourable meteorological conditions, especially in January and February. In 2008 the decreasing trend of ambient air pollution caused by SO2 and PM10 continued, the PM2.5 concentrations more or less stagnated. As concerns NO2, there was recorded a slight decrease in daily concentrations, in NOx there was a slight decrease in annual averages at rural stations. In 2009, on the contrary, there was a marked increase of air pollution caused by SO2, PM10, NO2 and NOx roughly to the level of the year 2007 in all these pollutants (except for PM2.5). The increase of the above pollutantsÆ concentrations in the ambient air was given by less favourable meteorological and dispersion conditions, mainly in January, February and December 2009 as compared with the year 2008. In 2010 there continued the growth of concentrations in all substances and in all air pollution characteristics. The 36th highest 24-hour PM10 concentrations in the average for the urban and all stations reached the above-the-limit levels, similarly as the annual average PM2.5 concentration (for all stations). Higher concentrations in comparison with the year 2009 were recorded also in SO2 and NO2, nevertheless as regards the average for the whole Czech Republic their levels remain well below the respective limit value. The increase of pollutantÆs concentrations in 2010 was given by repeated occurrence of unfavourable meteorological and dispersion conditions in the winter period at the beginning of the year (January and February) and at the end of the year (OctoberŌĆōDecember). In 2011 the levels of almost all air pollution characteristics decreased, with one exception, and namely the 36th highest PM10 concentration which slightly increased at urban stations in the year-by-year comparison. The more detailed analysis shows clearly that the growth at urban stations was caused by the increase of concentrations at urban traffic stations, and namely by approx. 8 % (4 ╬╝g.m-3) in comparison with the year 2011. The average concentration at rural stations decreased below the level of the daily limit value, the concentrations in other types of localities remain above the LV. The average annual concentration of PM10 decreased both at urban and rural stations. Similarly, the average annual PM2.5 concentrations decreased in all types of localities and they dropped below the limit value. The concentrations of other pollutants (SO2, NO2, NOx) decreased in all air pollution characteristics and in all types of localities. The greatest year-by-year decrease was recorded in the 4th highest 24-hour concentration of SO2 and the 19th highest 1-hour concentration of NO2. In 2012 the decrease of most air pollution characteristics continued with the exception of SO2 concentrations. SO2 concentrations recorded the increase of the 4th highest 24-hour concentration, and namely by almost 9 %. Nevertheless the value of the 4th 24-hour SO2 concentration still remains well below the limit value. It can be stated that other air pollution characteristics and pollutants show stagnation or a decreasing trend. Slight decrease (2ŌĆō3 %) was recorded in the 19th highest 1-hour concentration and in the annual concentration of NO2. The average annual PM10 concentration, the 36th highest PM10 concentration and the average annual PM2.5 concentration decreased at all types of stations; the decrease is more apparent at traffic stations. The 36th highest PM10 concentration in the average for the whole Czech Republic remains just below the daily limit value. The concentrations of other pollutants (PM2.5, SO2, NO2, NOx) remain below the respective limit values. Nevertheless, the limit values continue to be exceeded, mainly in the densely populated areas. They are probably exceeded also in the sites without air quality monitoring (small settlements). The fluctuation of the trends of individual pollutants is caused on the one hand by the decline of emissions, the change of the structure of industrial production and of the used fuels, on the other hand there is a significant influence of meteorological and dispersion conditions. Unlike other pollutants benzo(a)pyrene has reached in the average for the whole Czech Republic the above-the-limit concentrations in the long term (more than twofold values).The set limit value for benzo(a)pyrene concentrations is 1 ng.m-3. The trend of benzo(a)pyrene concentrations can be assessed starting from 2005. The highest concentrations of benzo(a)pyrene were measured in 2006 (more than threefold exceedance of the level of the limit value) due to the unfavourable meteorological and dispersion conditions. The second highest concentration was recorded in 2009. Since 2007 benzo(a)pyrene concentrations have fluctuated; the year-by-year comparison shows that in 2012 the average annual concentration again slightly increased, and namely by almost 4 %. This is the third highest value of benzo(a)pyrene concentration for the assessed period 2005ŌĆō2012. The ground-level ozone is the pollutant of a different character than the above assessed pollutants. Ozone is the so called secondary pollutant which reaches its highest concentrations in the warm part of the year. As concerns the period 1996ŌĆō2006, it is not possible to clearly conclude the trend of the concentrations, as air pollution characteristics show marked fluctuations. In 2003 there is apparent the increasing trend in concentrations due to long-time very high temperatures and high levels of solar radiation. In 2004 O3 concentrations slightly decreased below the level from the years 1997ŌĆō2002, in 2005, on the contrary, they increased slightly above the level from 1997ŌĆō2002. On the contrary, since 2006 the pollutantsÆ concentrations were decreasing continuously up to 2009. In 2006 the concentrations slightly increased. In 2007 the average from the 26th highest maximum 8-hour running averages slightly decreased. On the contrary, there was a slight increase of the 76th values of maximum 8-hour running averages for the previous 3 years, resulting mainly from the fact that the AprilŌĆōSeptember period of the year 2007 was warmer (in the average for the whole Czech Republic by 1.2 ░C) than the year 2004 which was included in the previous three-year period but not taken into account for the assessment of the 2005ŌĆō2007 period. In the period 2006ŌĆō2008 the 76th highest value of maximum 8-hour running averages decreased, probably due to the decrease of the precursorsÆ concentrations (both NOx and VOC). This decrease is visible in the graph of the trends in all types of localities; also apparent is the decrease of concentrations in the year 2008 alone. The decline of ozone concentrations continued also in the period 2007ŌĆō2009, when there was a marked decrease of the number of exceedances of the limit value 120 μg.m-3 in most localities, and, as it is apparent from the graph, the 26th highest value of the maximum 8-hour running average decreased for the year 2009 alone, as well as the average for 3 years. The graphs of trends also show apparently higher concentrations in rural localities as compared with the concentrations from urban and suburban localities, where ozone is removed mainly by emissions from traffic. In 2010 the 26th highest value of maximum 8-hour running average slightly increased, the values of 3-year averages of concentrations decreased again. In 2011 the situation repeated ŌĆō the 26th highest value of the maximum 8-hour running average for all types of stations increased again; it was caused by the growth of concentrations at rural stations. However, there continues the decreasing trend of the 26th highest value of the maximum 8-hour running average of ozone concentrations at traffic stations and ozone concentrations in the average for three years. In 2012 there was measured a slight increase of the 76th highest value of the maximum 8-hour average of ground-level ozone; the 26th highest value of the maximum 8-hour running average in the year-to-year comparison recorded a slight decrease at rural stations.
Fig. II.4.2.46 Trends of SO2, NO2, NOx and O3 annual characteristics in the Czech Republic, 1996ŌĆō2012
Fig. II.4.2.47 Trends of PM10 , PM2.5 and benzo(a)pyrene annual characteristics in the Czech Republic, 1996ŌĆō2012
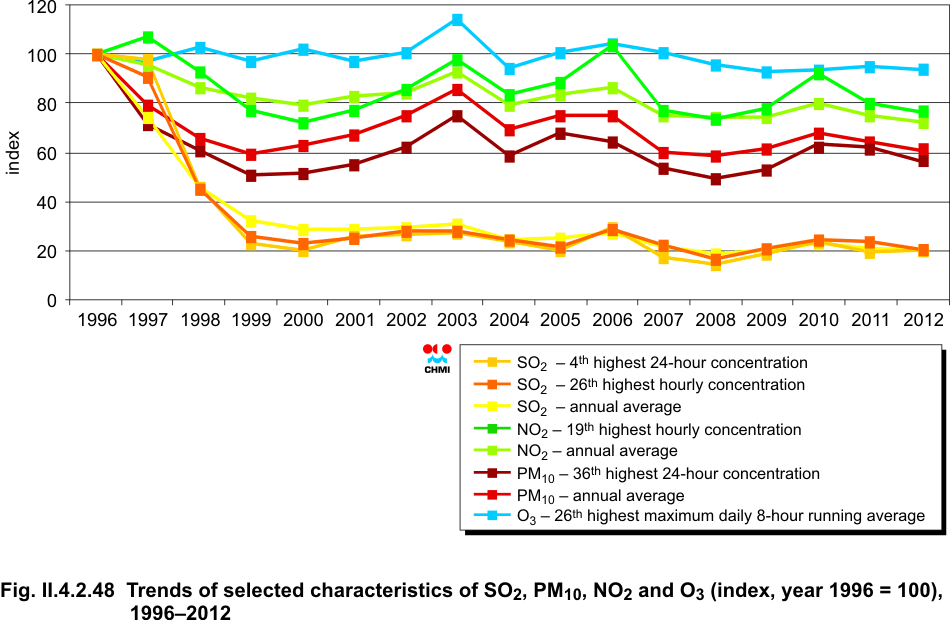
Fig. II.4.2.48 Trends of selected characteristics of SO2, PM10, NO2 and O3 (index, year 1996 = 100), 1996ŌĆō2012
Fig. II.4.2.49 Trends of selected characteristics of SO2, PM10, NO2 and O3 (index, year 2000 = 100) and PM2.5 (index, year 2004=100), 2000ŌĆō2012
Fig. II.4.2.50 Annual course of average monthly concentrations of PM10, NO2, benzo(a)pyrene and max. 8-hour running average of O3 in the month (averages and individual stations representative for the given type of station), 2012 1The trend of selected air pollution characteristics is expressed in the indexed form, i.e. the level of air pollution caused by the respective pollutant in 1996ŌĆō2010 is related to the level (concentration) of the pollutant in 1996 (or in 2000).
|