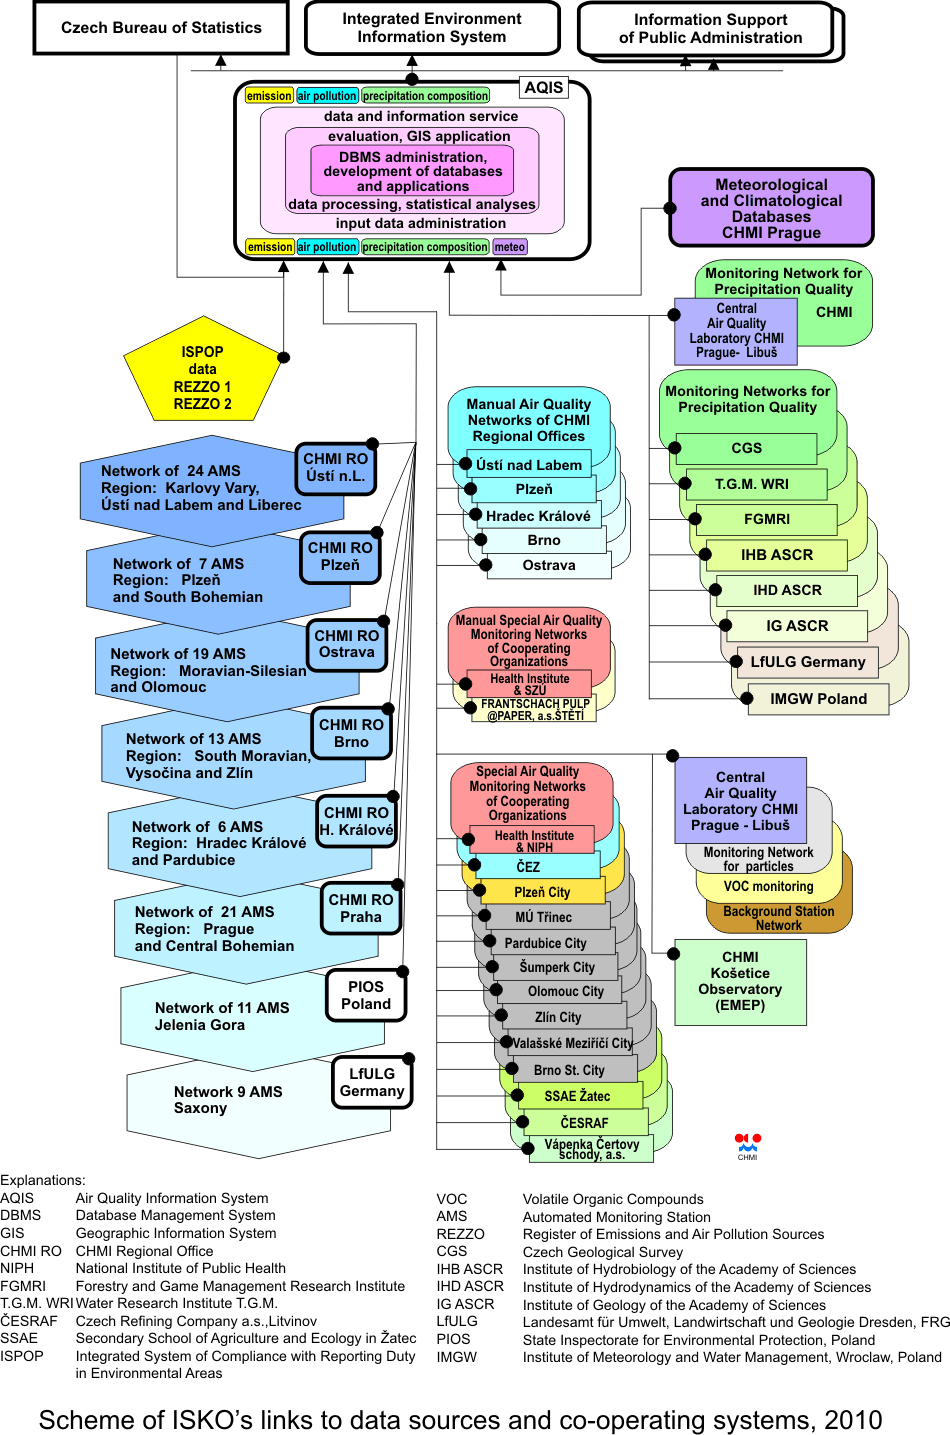
| Fig. ŌĆō1 |
Scheme of ISKOÆs links to data sources and co-operating systems 2010
|
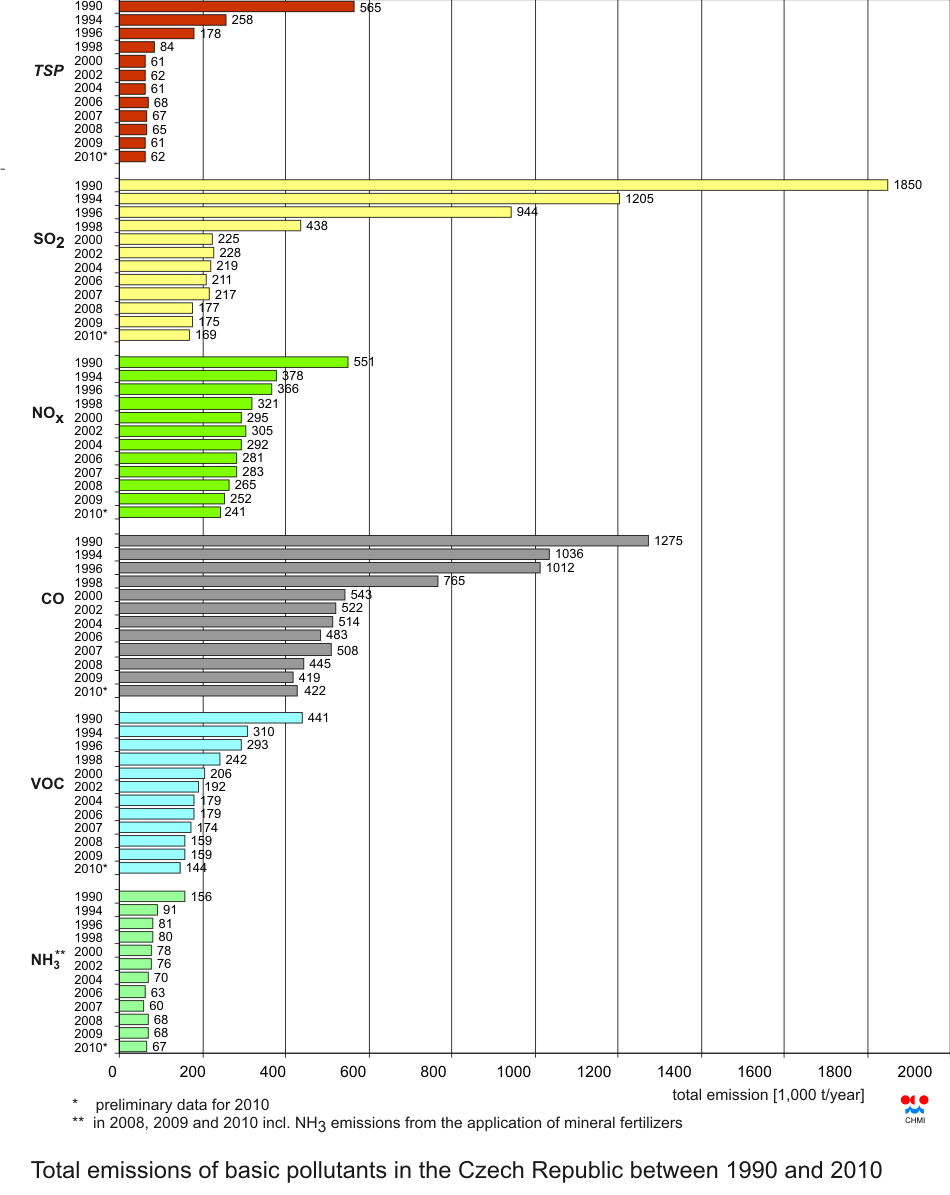
| Fig. I.1.1 |
Total emissions of basic pollutants in the Czech Republic between
1990 and 2010 |
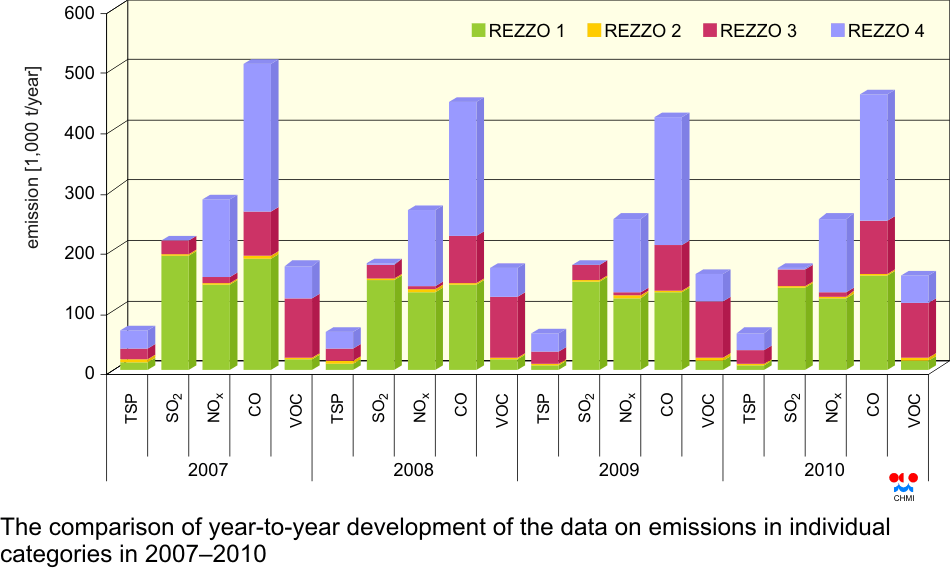
| Fig. I.1.2 |
The comparison of year-to-year development of the data on emissions
in individual categories in 2007ŌĆō2010 |
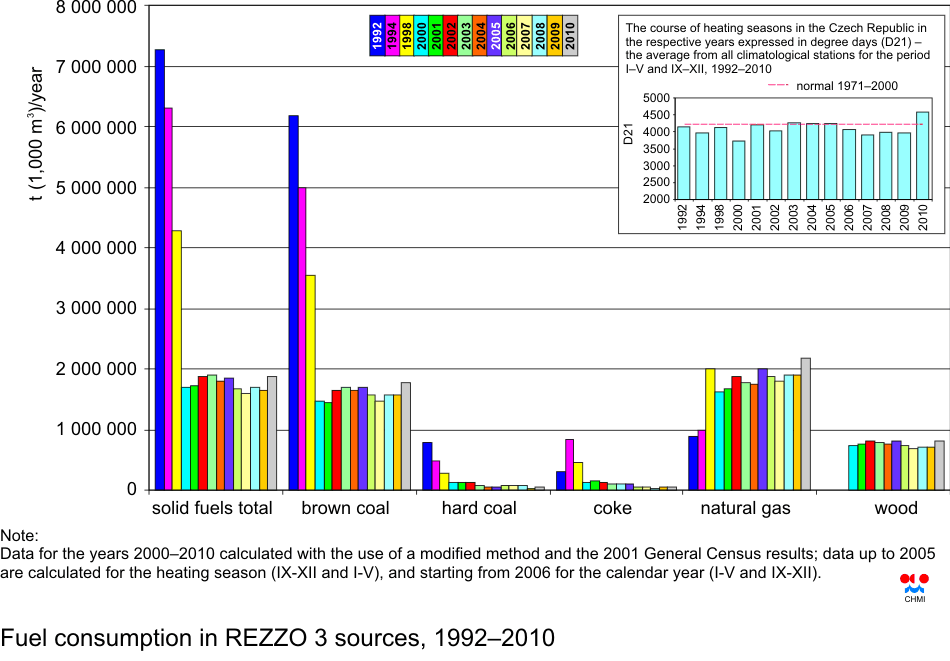
| Fig. I.1.3 |
Fuel consumption in REZZO 3 sources, 1992ŌĆō2010 |
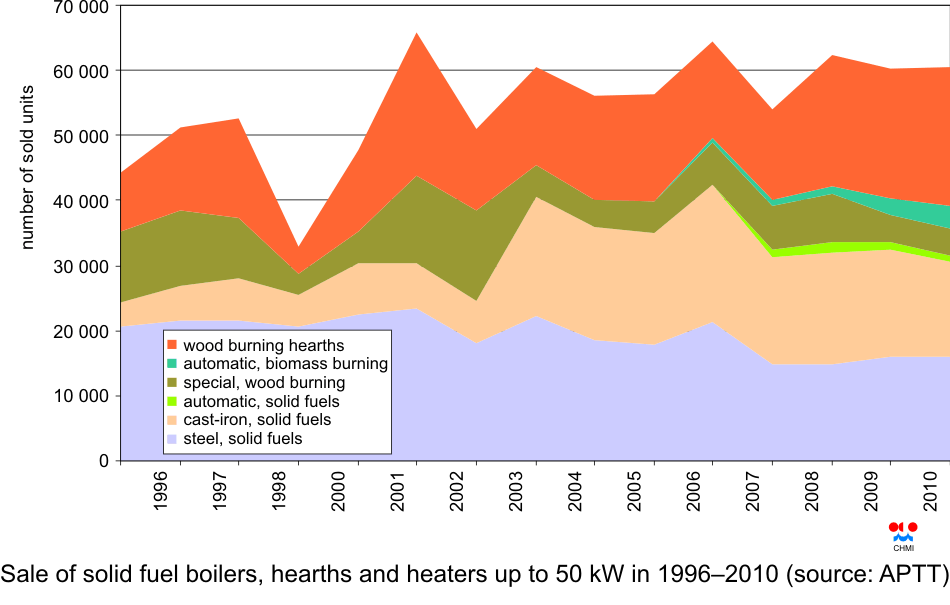
| Fig. I.1.4 |
Sale of solid fuel boilers, hearths and heaters up to 50 kW in
1996ŌĆō2010 (source: APTT) |
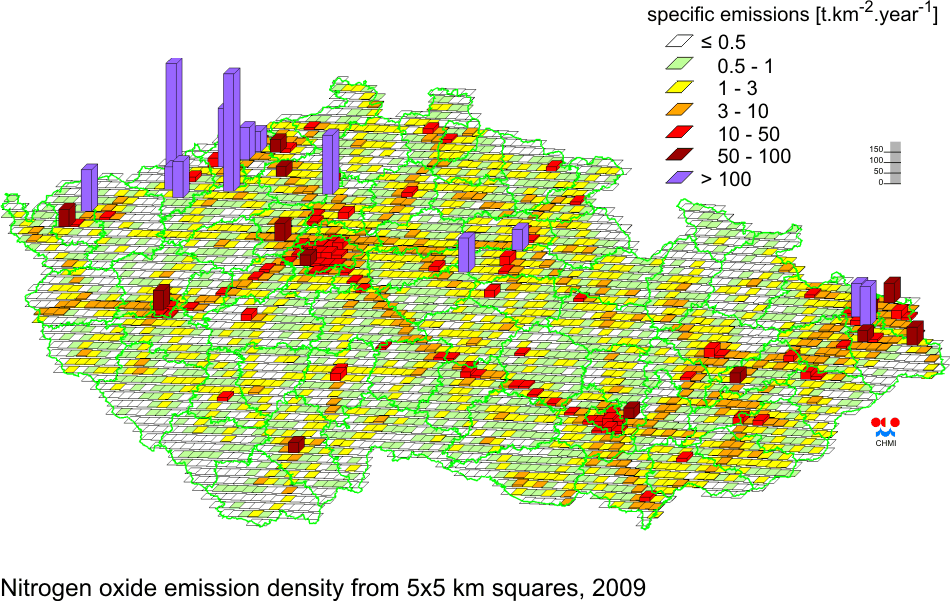
| Fig. I.1.5 |
Nitrogen oxides emission density from 5x5 km squares, 2009 |
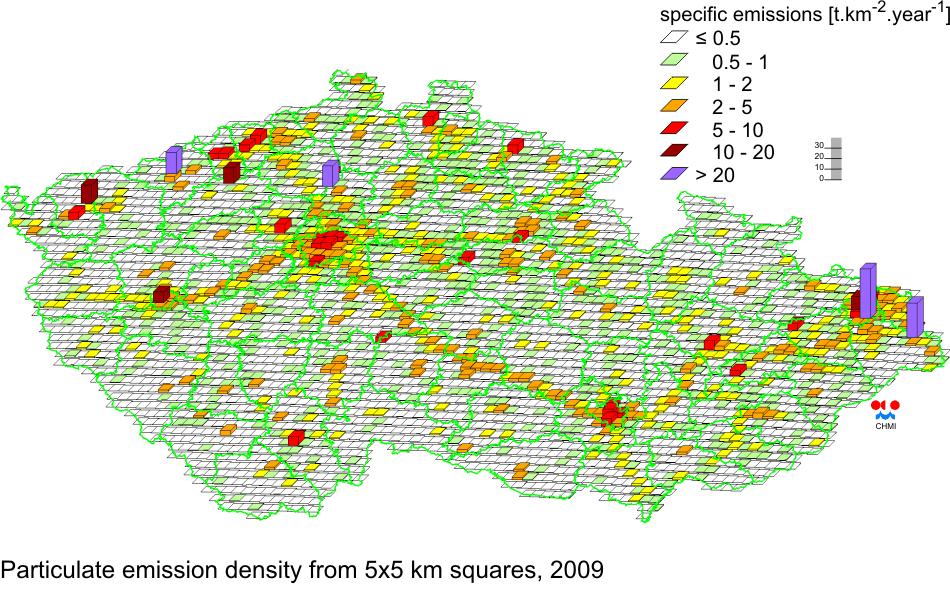
| Fig. I.1.6 |
Emission density of total suspended particles from 5x5 km squares,
2009 |
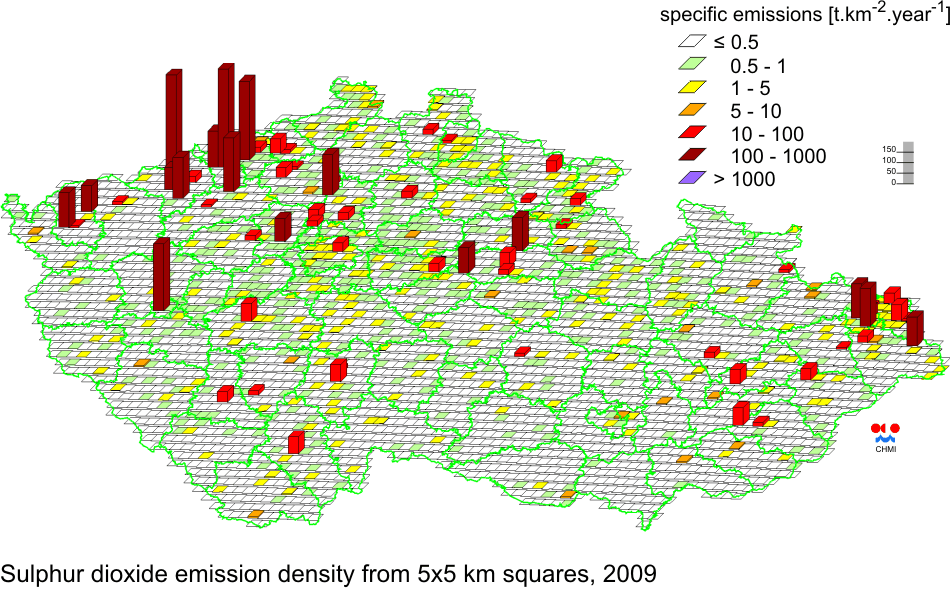
| Fig. I.1.7 |
Sulphur dioxide emission density from 5x5 km squares, 2009 |
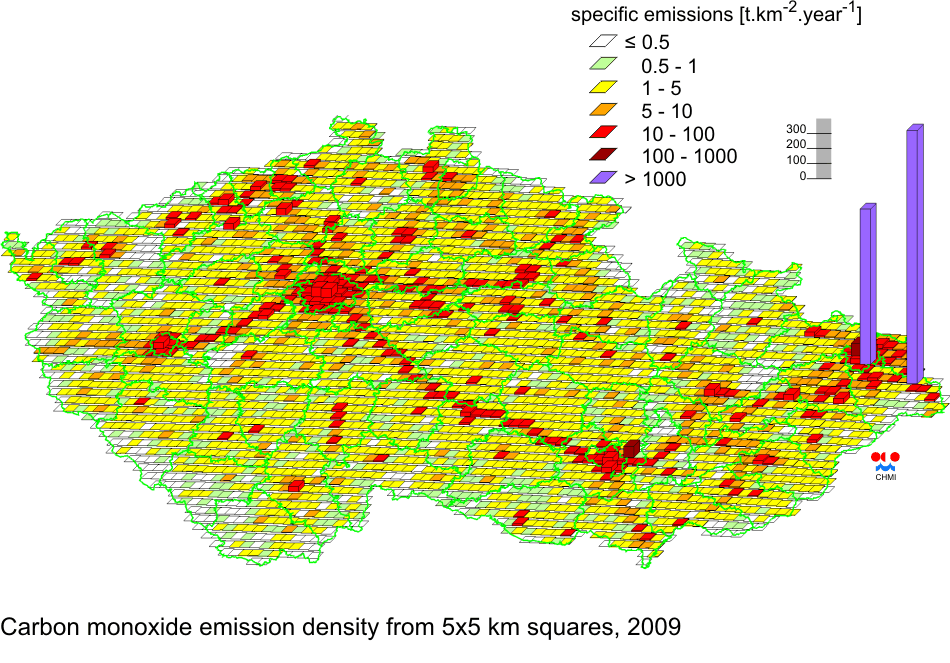
| Fig. I.1.8 |
Carbon moNOxide emission density from 5x5 km squares, 2009 |
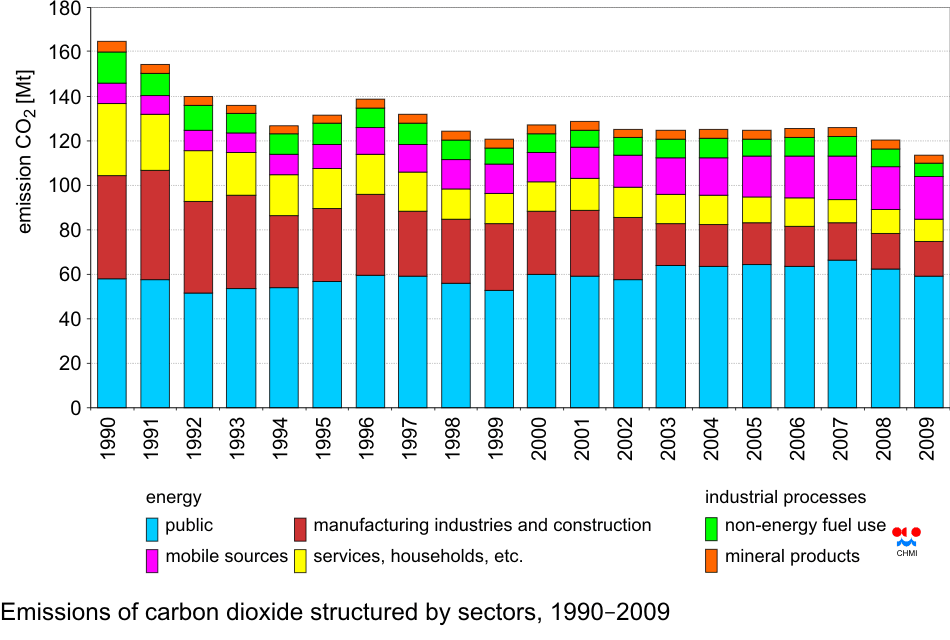
| Fig. I.2.1 |
Emissions of carbon dioxide structured by sectors, 1990ŌĆō2009 |
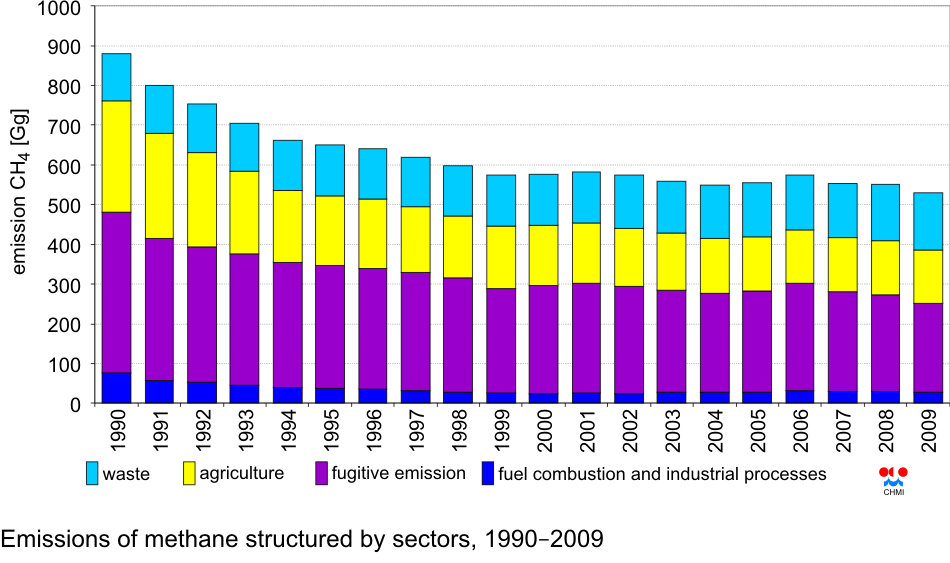
| Fig. I.2.2 |
Emissions of methane structured by sectors, 1990ŌĆō2009 |
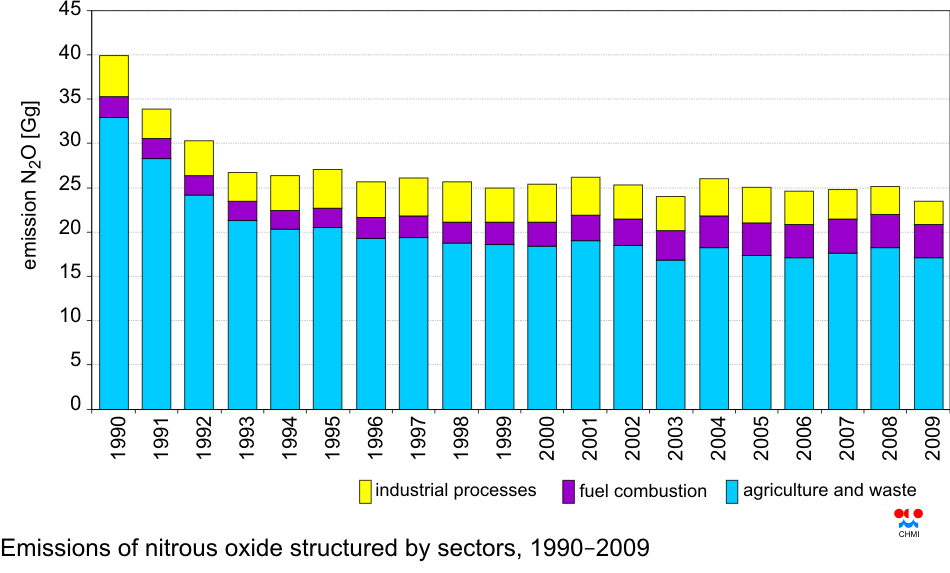
| Fig. I.2.3 |
Emissions of nitrous oxide structured by sectors, 1990ŌĆō2009 |
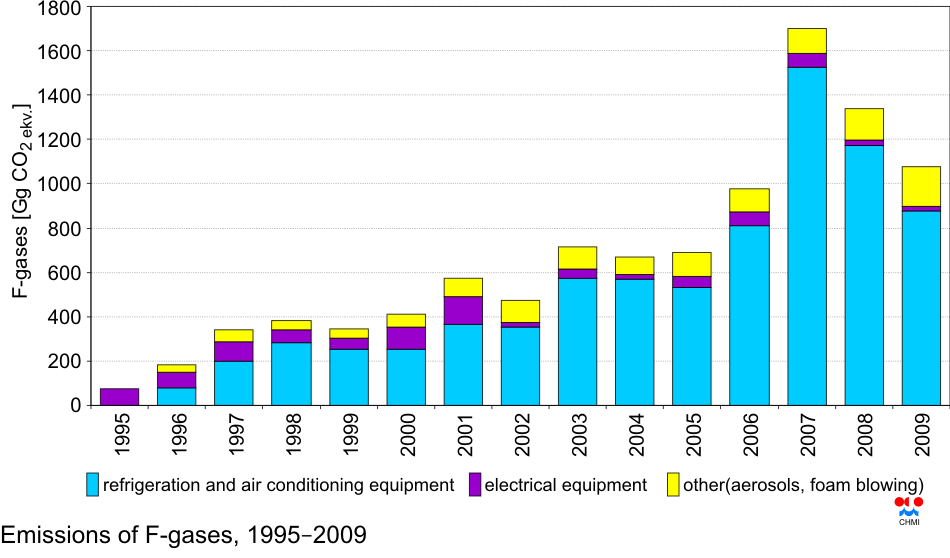
| Fig. I.2.4 |
Emissions of F-gases, 1995ŌĆō2009 |
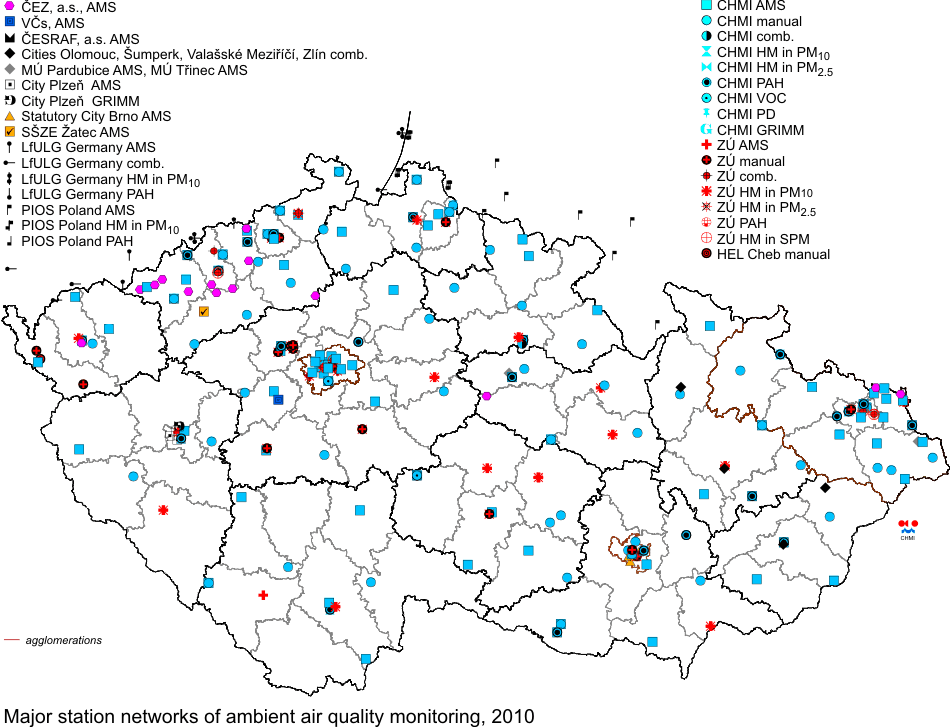
| Fig. II.1.1 |
Major station networks of ambient air quality monitoring, 2010 |
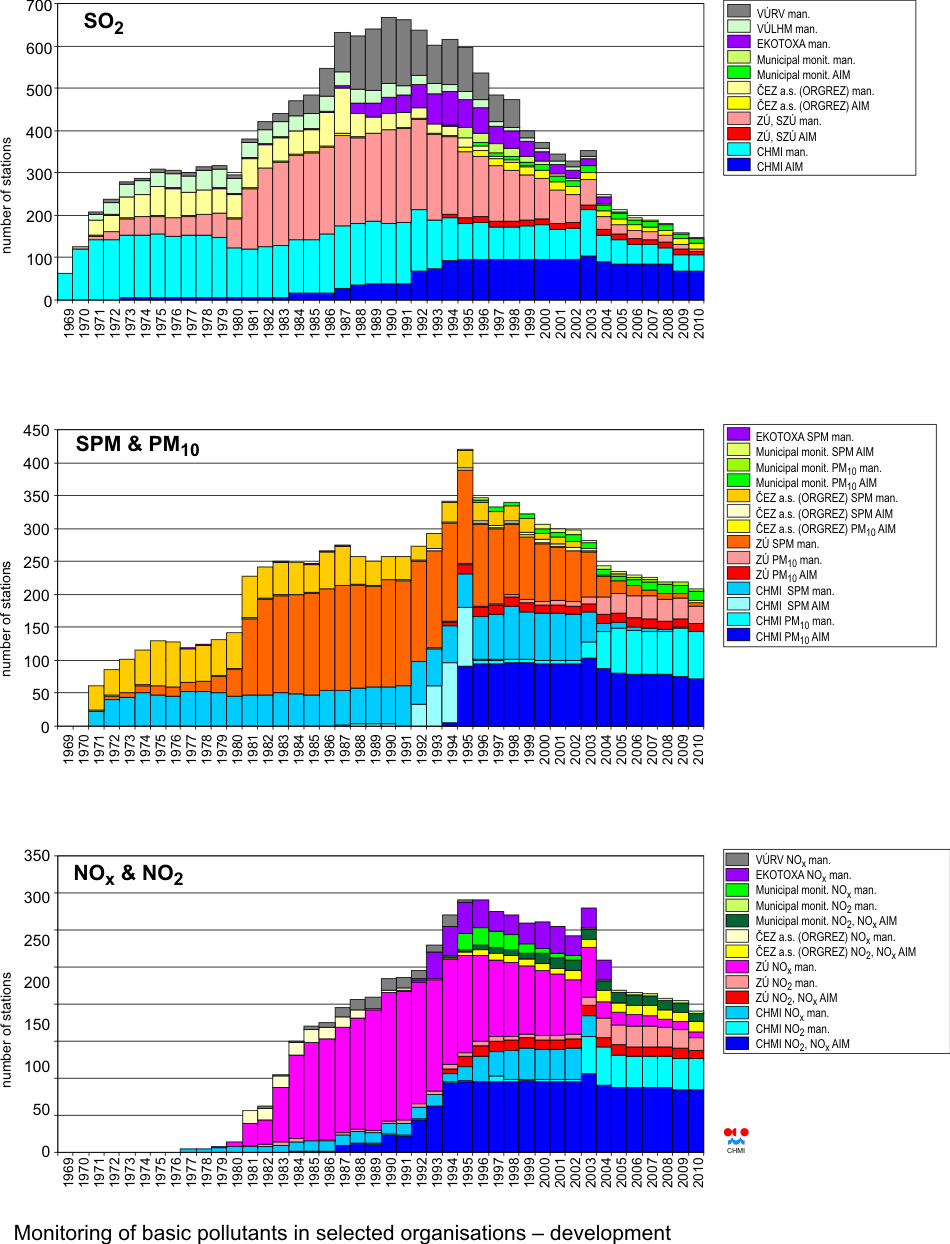
| Fig. II.1.2 |
Monitoring of basic pollutants in selected organisations ŌĆō
development |
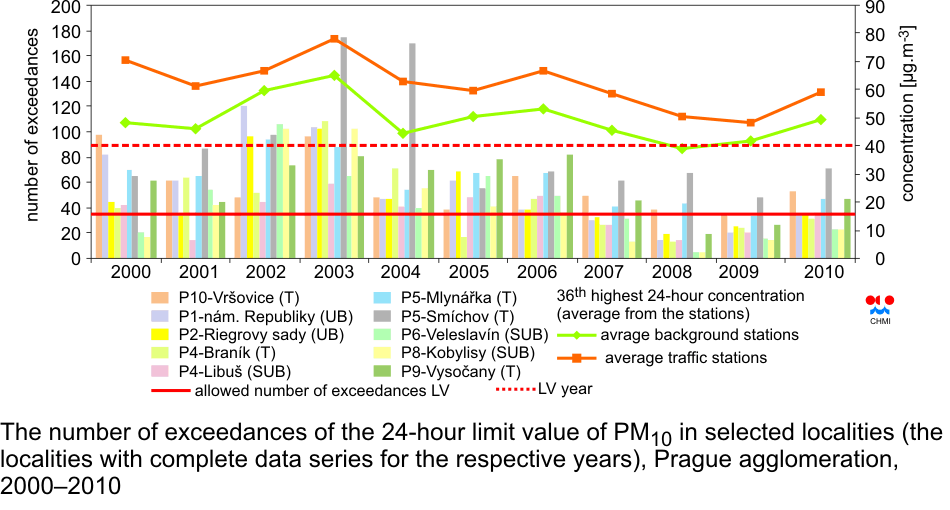
| Fig. II.4.1.1 |
The number of exceedances of the 24-hour limit value of PM10 in
selected localities (the localities with complete data series for the
respective years), Prague agglomeration, 2000ŌĆō2010 |
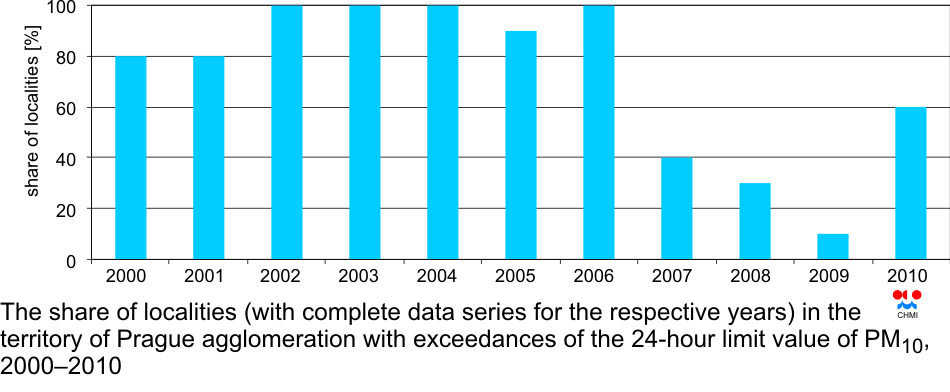
| Fig. II.4.1.2 |
The share of localities (with complete data series for the
respective years) in the territory of Prague agglomeration with
exceedances of the 24-hour limit value of PM10, 2000ŌĆō2010 |
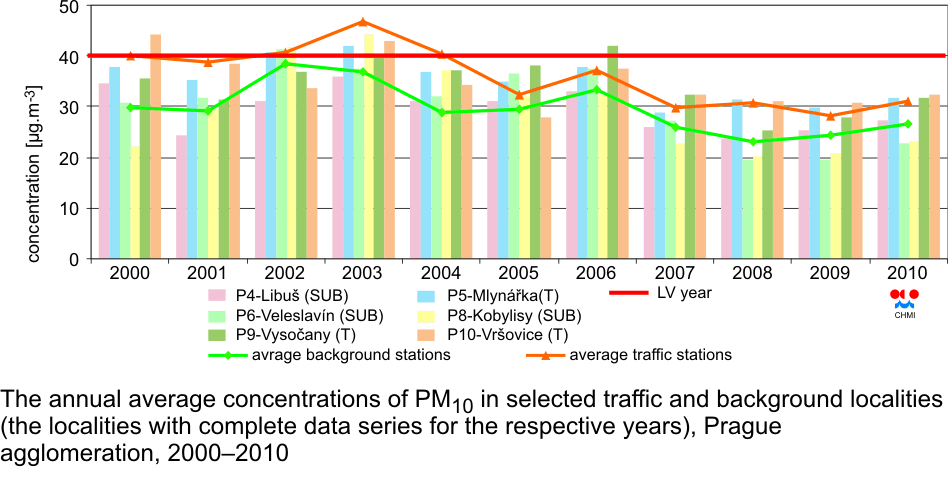
| Fig. II.4.1.3 |
The annual average concentrations of PM10 in selected traffic and
background localities (the localities with complete data series for the
respective years), Prague agglomeration, 2000ŌĆō2010 |
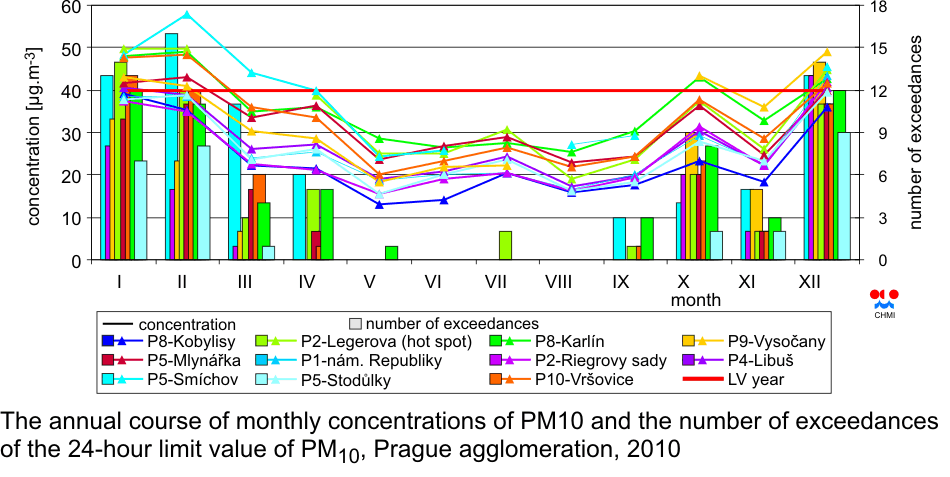
| Fig. II.4.1.4 |
The annual course of monthly concentrations of PM10 and the number
of exceedances of the 24-hour limit value of PM10, Prague agglomeration,
2010 |
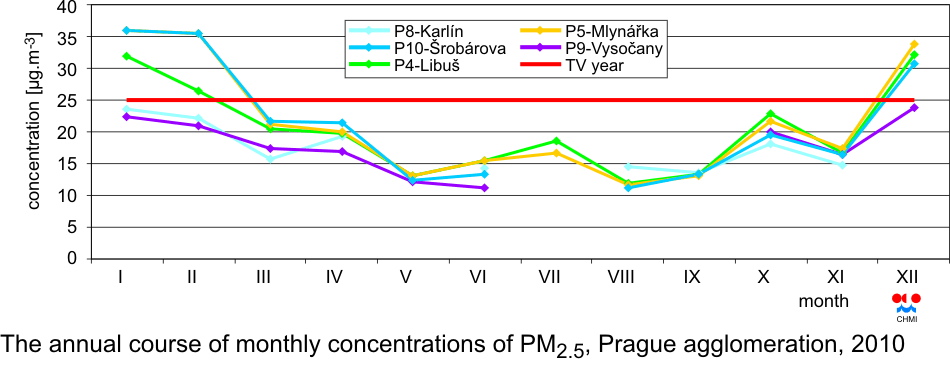
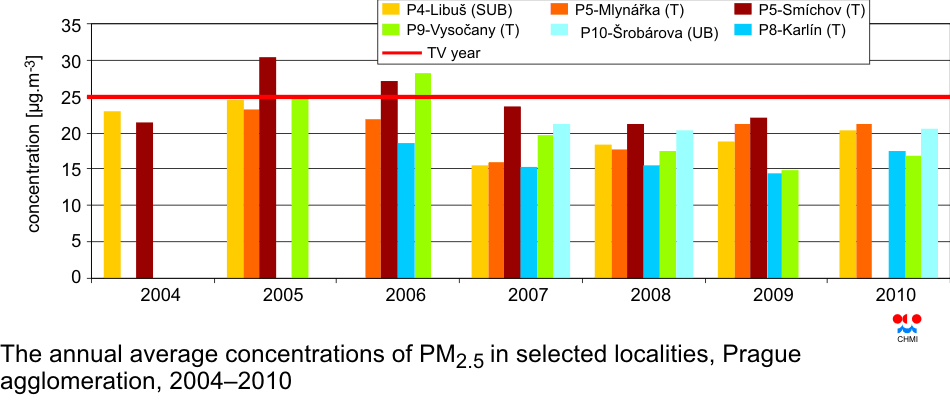
| Fig. II.4.1.5 |
The annual course of monthly concentrations of PM2.5, Prague
agglomeration, 2010 |
| Fig. II.4.1.6 |
The annual average concentrations of PM2.5 in selected localities,
Prague agglomeration, 2004ŌĆō2010 |
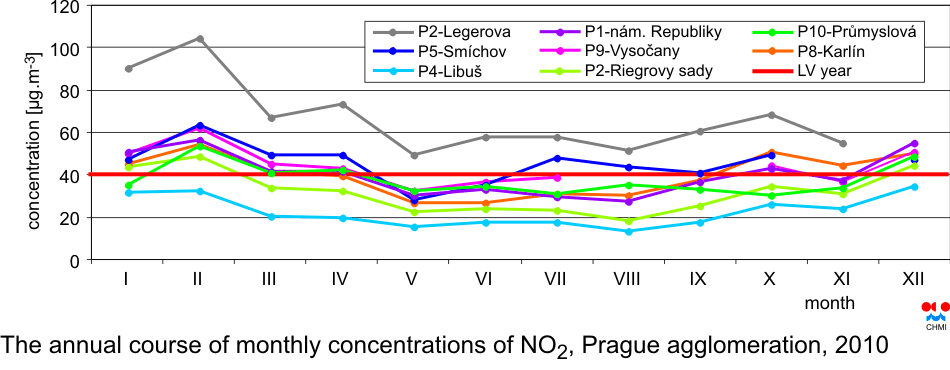
| Fig. II.4.1.7 |
The annual course of monthly concentrations of NO2, Prague
agglomeration, 2010 |
| Fig. II.4.1.8 |
The annual average concentrations of benzo(a)pyrene, Prague
agglomeration, 2000ŌĆō2010 |
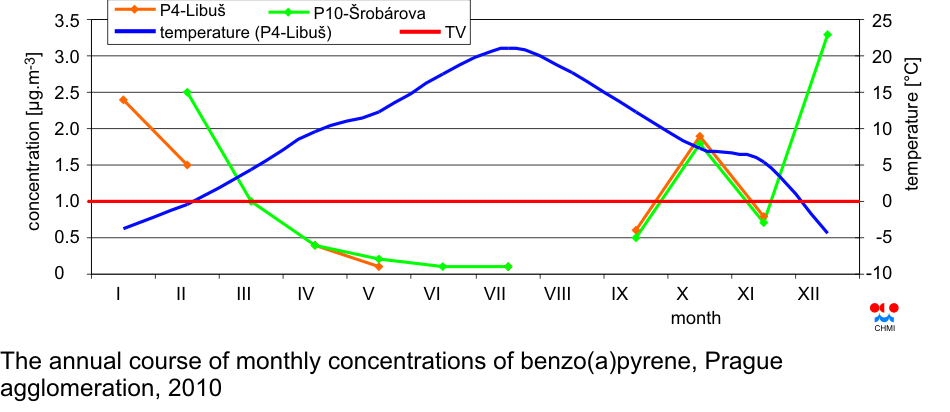
| Fig. II.4.1.9 |
The annual course of monthly concentrations of benzo(a)pyrene,
Prague agglomeration, 2010 |
| Fig. II.4.1.10 |
The annual course of monthly concentrations of ozone, Prague
agglomeration, 2010 |
| Fig. II.4.1.11 |
Field of the annual concentration of NO2, Prague agglomeration, 2010 |
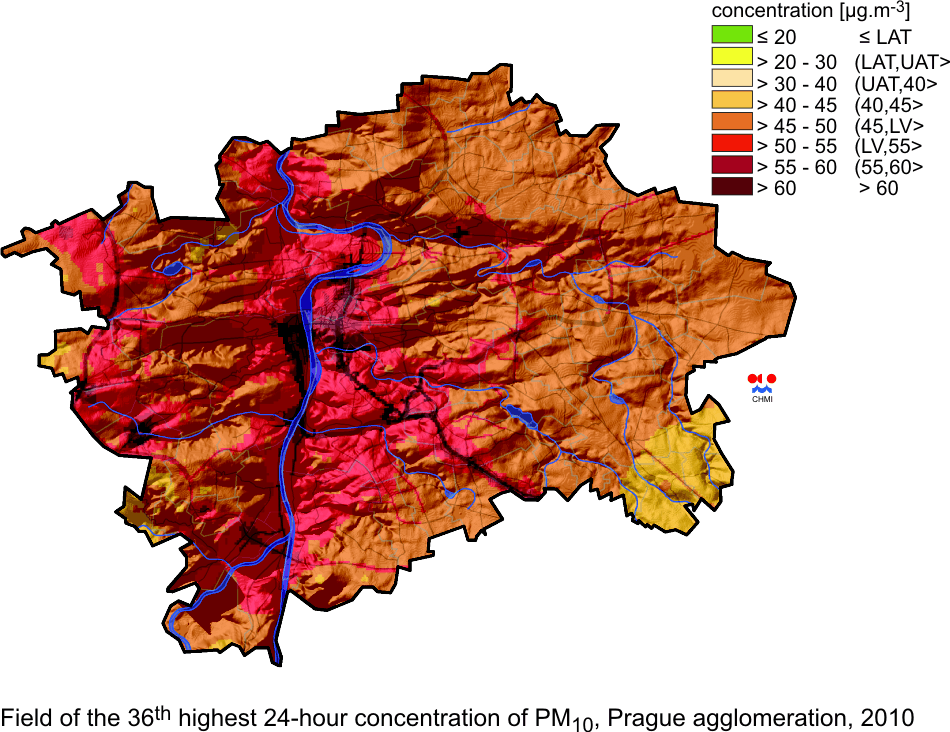
| Fig. II.4.1.12 |
Field of the 36th highest 24-hour concentration of PM10, Prague
agglomeration, 2010 |
| Fig. II.4.1.13 |
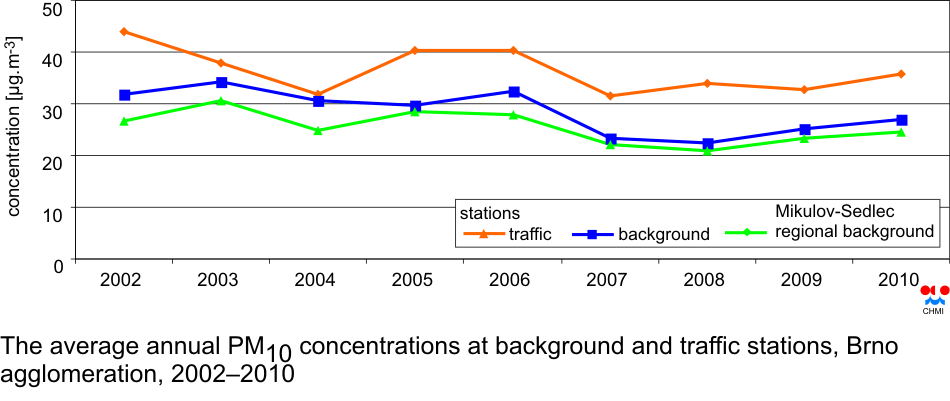
The average annual PM10 concentrations at background and traffic
stations, Brno agglomeration, 2002ŌĆō2010 |
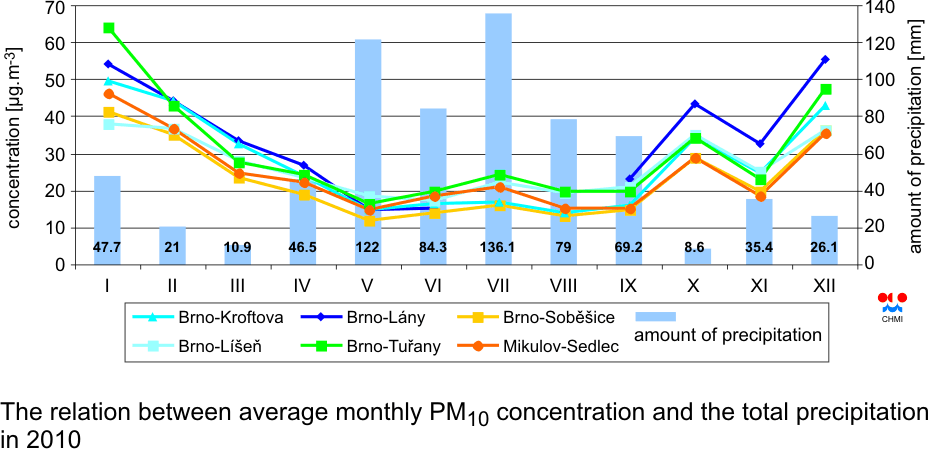
| Fig. II.4.1.14 |
The relation between average monthly PM10 concentration and the
total precipitation in 2010 |
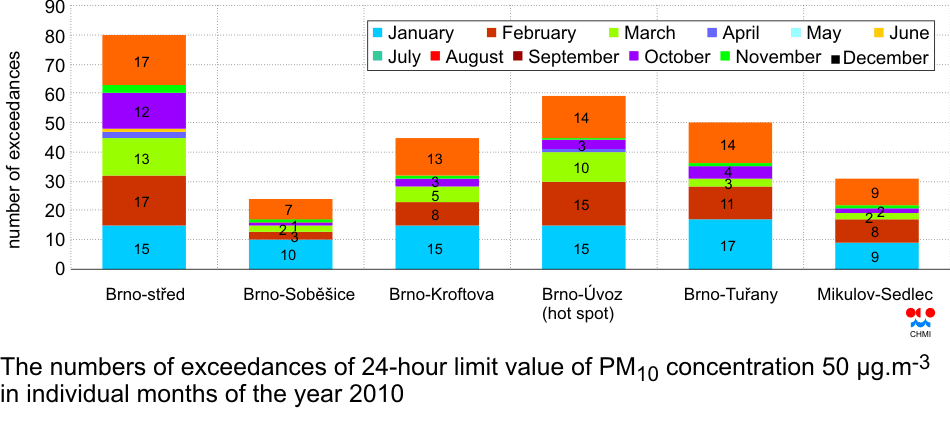
| Fig. II.4.1.15 |
The numbers of exceedances of 24-hour limit value of PM10
concentration 50 ╬╝g.m-3 in individual months of the year 2010 |
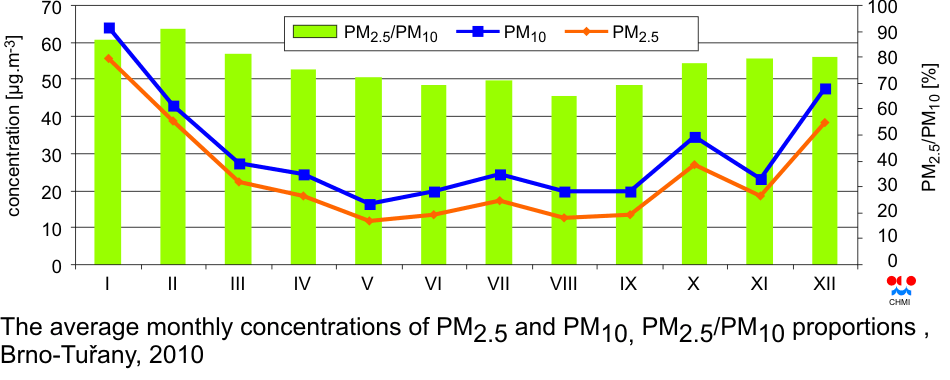
| Fig. II.4.1.16 |
The average monthly concentrations of PM2.5 and PM10, PM2.5/PM10
proportions, Brno-Tuřany, 2010 |
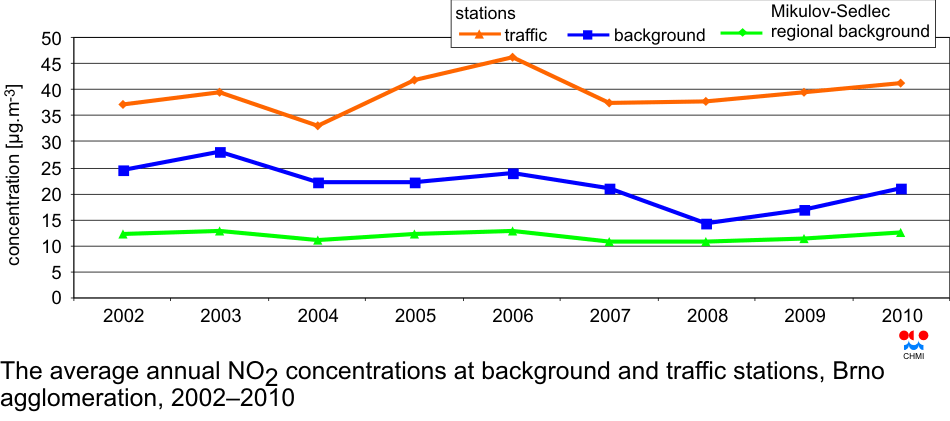
| Fig. II.4.1.17 |
The average annual NO2 concentrations at background and traffic
stations, Brno agglomeration, 2002ŌĆō2010 |
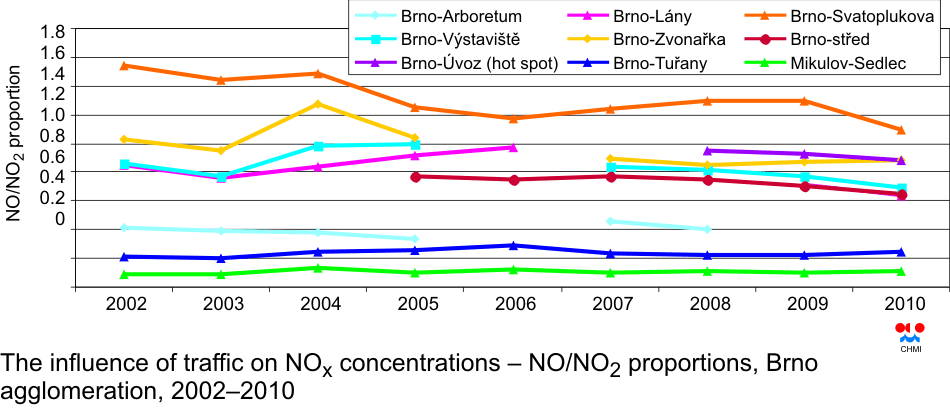
| Fig. II.4.1.18 |
The influence of traffic on NOx concentrations ŌĆō NO/NO2 proportions,
Brno agglomeration, 2002ŌĆō2010 |
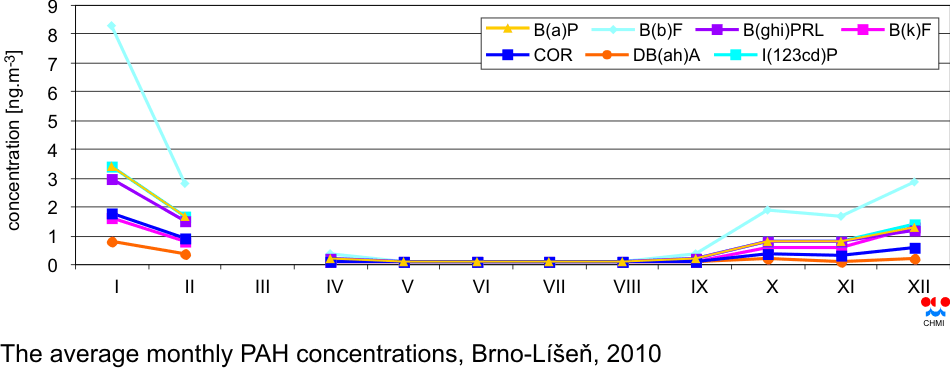
| Fig. II.4.1.19 |
The average monthly PAH concentrations, Brno-L├Ł┼Īe┼ł, 2010 |
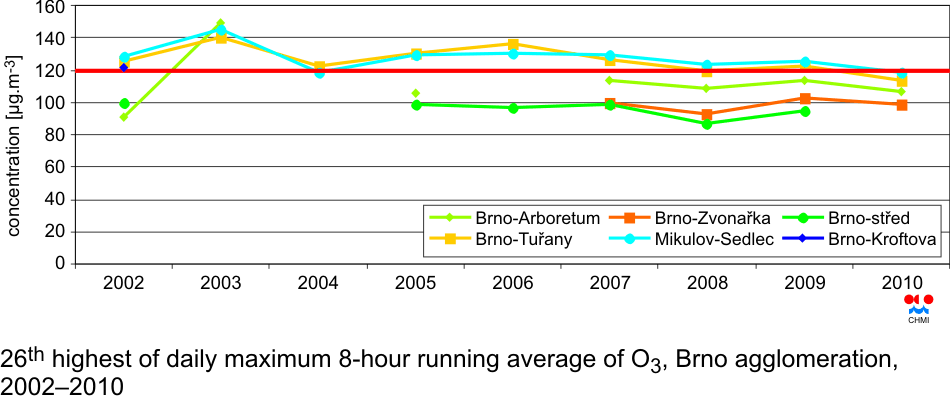
| Fig. II.4.1.20 |
26th highest of maximum daily 8-hour running average of O3, Brno
agglomeration, 2002ŌĆō2010 |
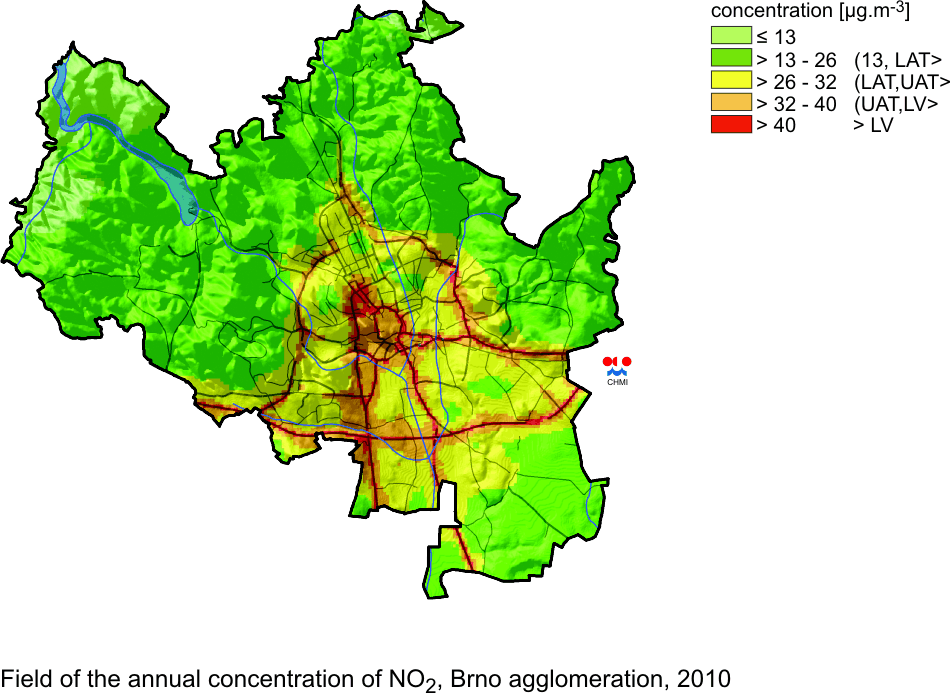
| Fig. II.4.1.21 |
Field of the annual concentration of NO2, Brno agglomeration, 2010 |
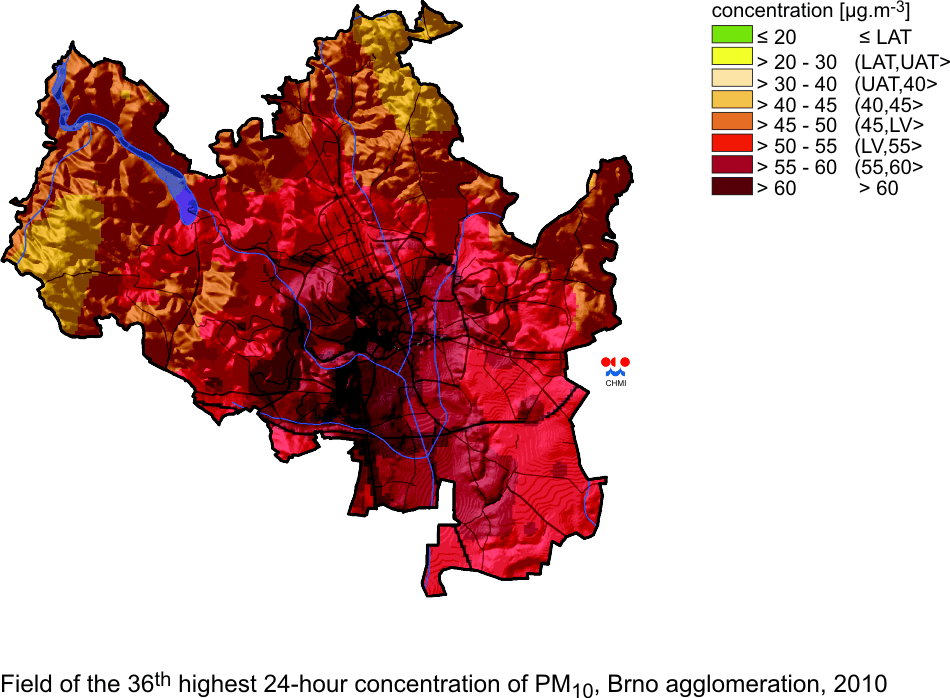
| Fig. II.4.1.22 |
Field of the 36th highest 24-hour concentration of PM10, Brno
agglomeration, 2010 |
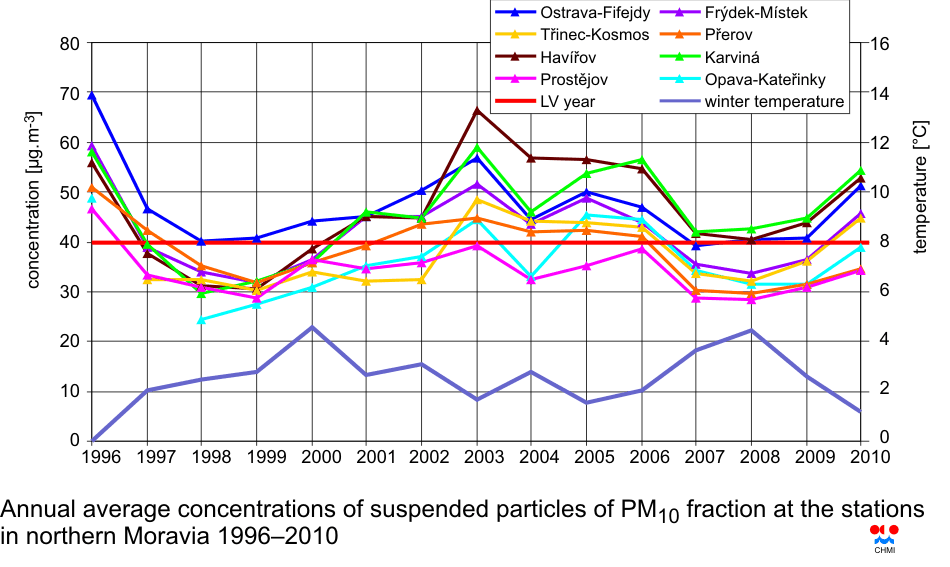
| Fig. II.4.1.23 |
Annual average concentrations of suspended particles of PM10
fraction at the stations in northern Moravia 1996ŌĆō2010 |
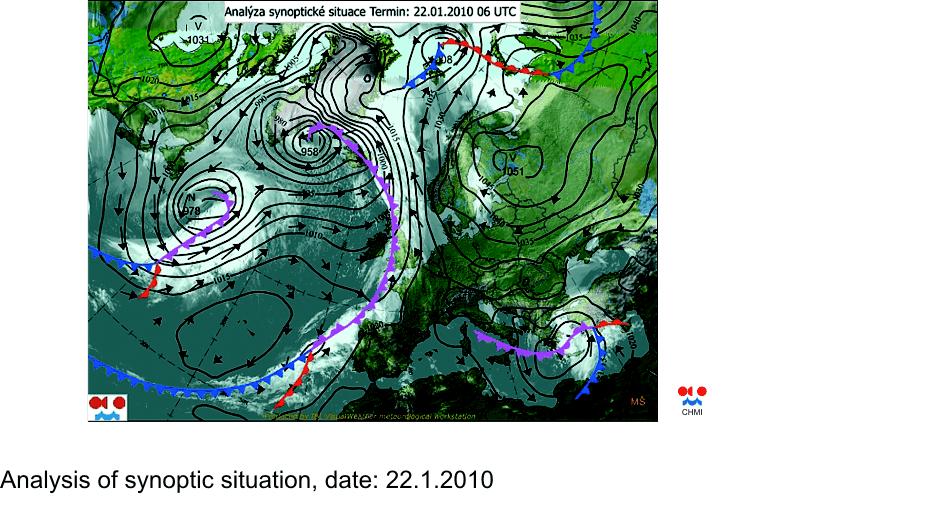
| Fig. II.4.1.24 |
Synoptic situation on 22.1.2010 |
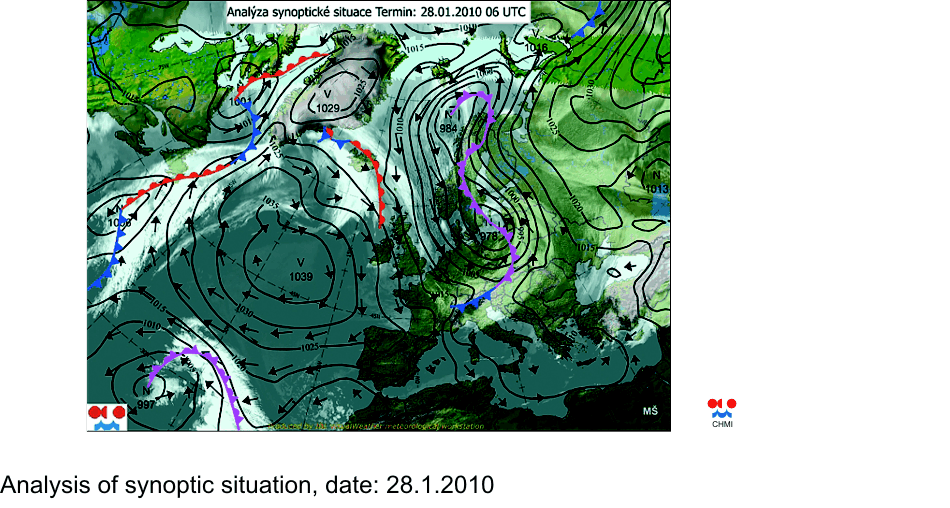
| Fig. II.4.1.25 |
Synoptic situation on 28.1.2010 |
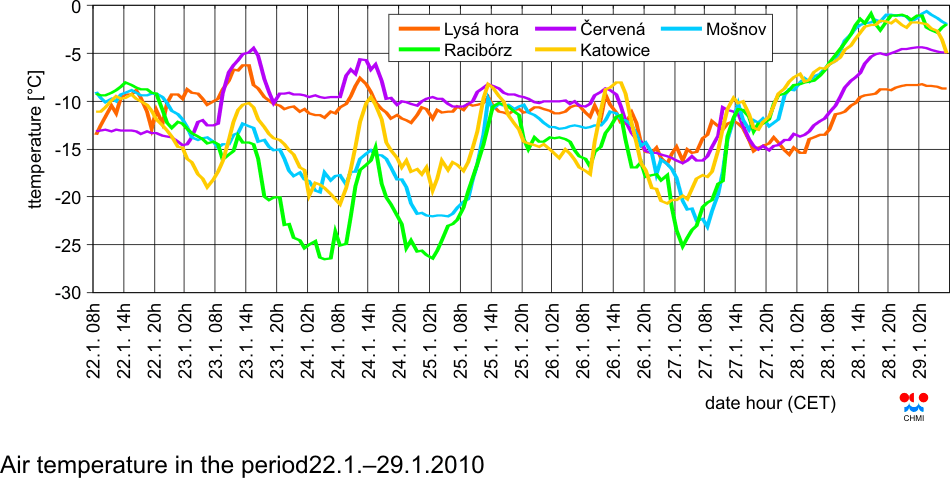
| Fig. II.4.1.26 |
Air temperature in the period 22.1.ŌĆō29.1.2010 |
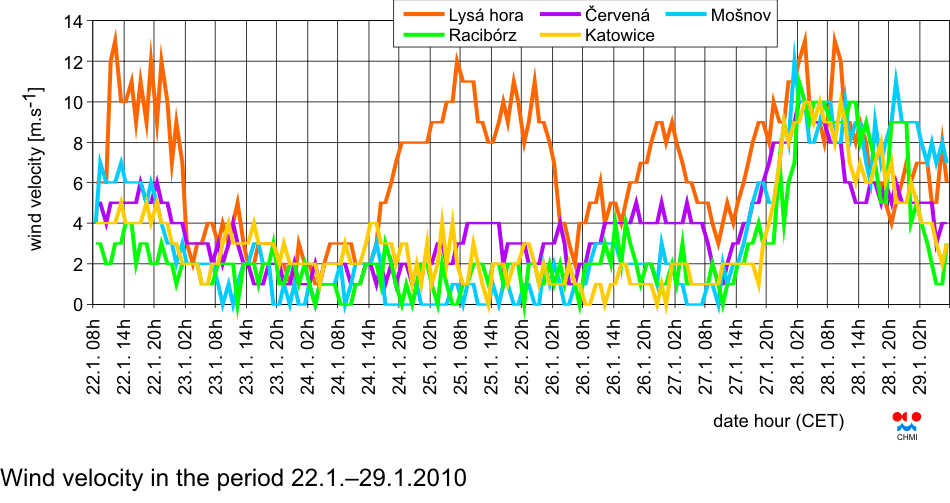
| Fig. II.4.1.27 |
Wind velocity in the period 22.1.ŌĆō29.1.2010 |
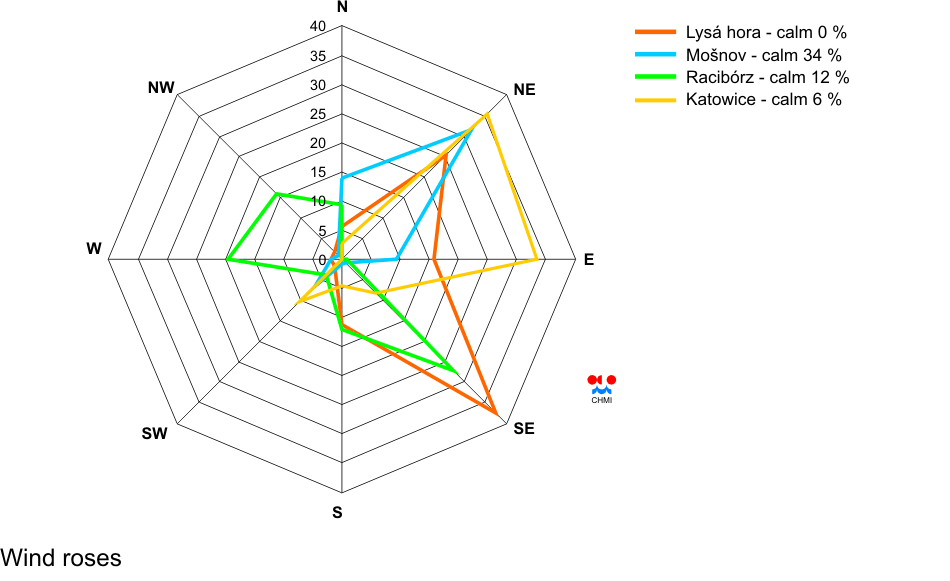
| Fig. II.4.1.28 |
Wind roses |
| Fig. II.4.1.29 |
Maps of 24-hour concentrations of PM10 based on real-time
non-verified data, 19.1.ŌĆō28.1.2010 (source: portal.chmi.cz) |
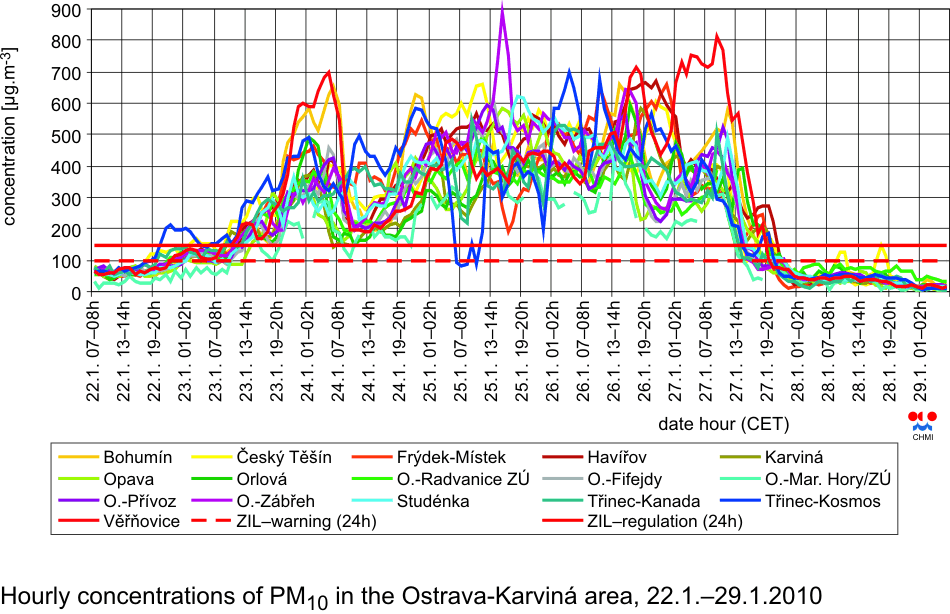
| Fig. II.4.1.30 |
Hourly concentrations of PM10 in the Ostrava-Karvin├Ī area,
22.1.ŌĆō29.1.2010 |
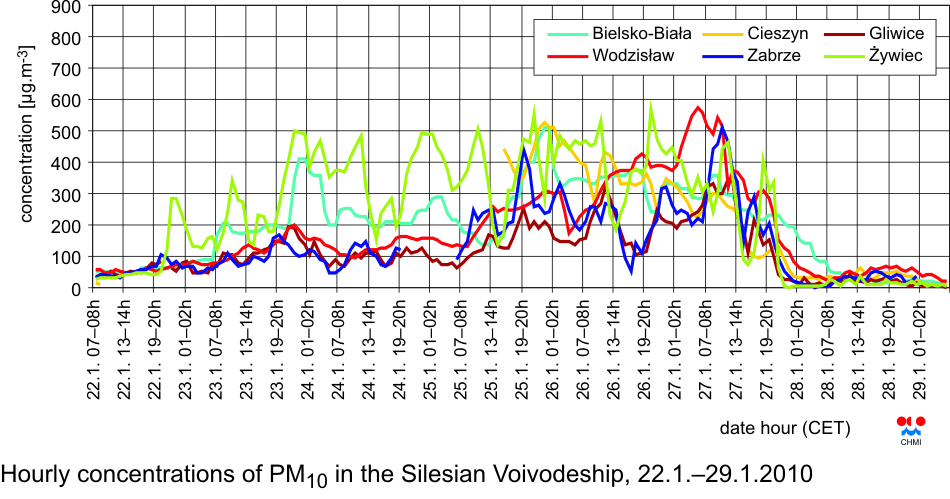
| Fig. II.4.1.31 |
Hourly concentrations of PM10 in the Silesian Voivodeship,
22.1.ŌĆō29.1.2010 |
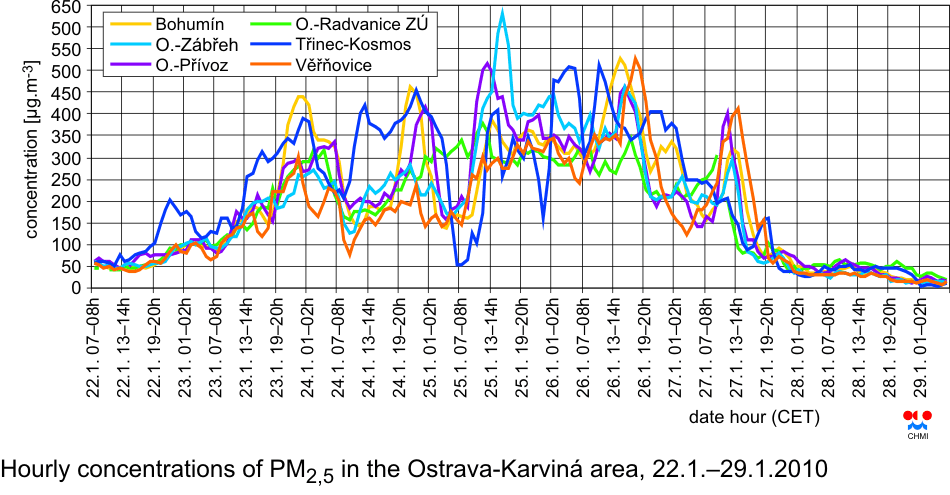
| Fig. II.4.1.32 |
Hourly concentrations of PM2.5 in the Ostrava-Karvin├Ī area,
22.1.ŌĆō29.1.2010 |
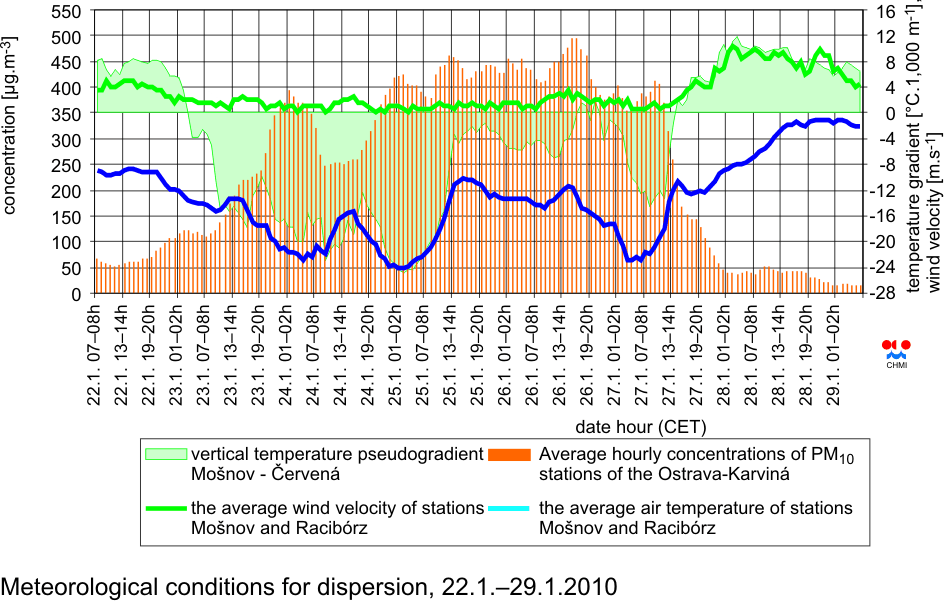
| Fig. II.4.1.33 |
Meteorological conditions for dispersion, 22.1.ŌĆō29.1.2010 |
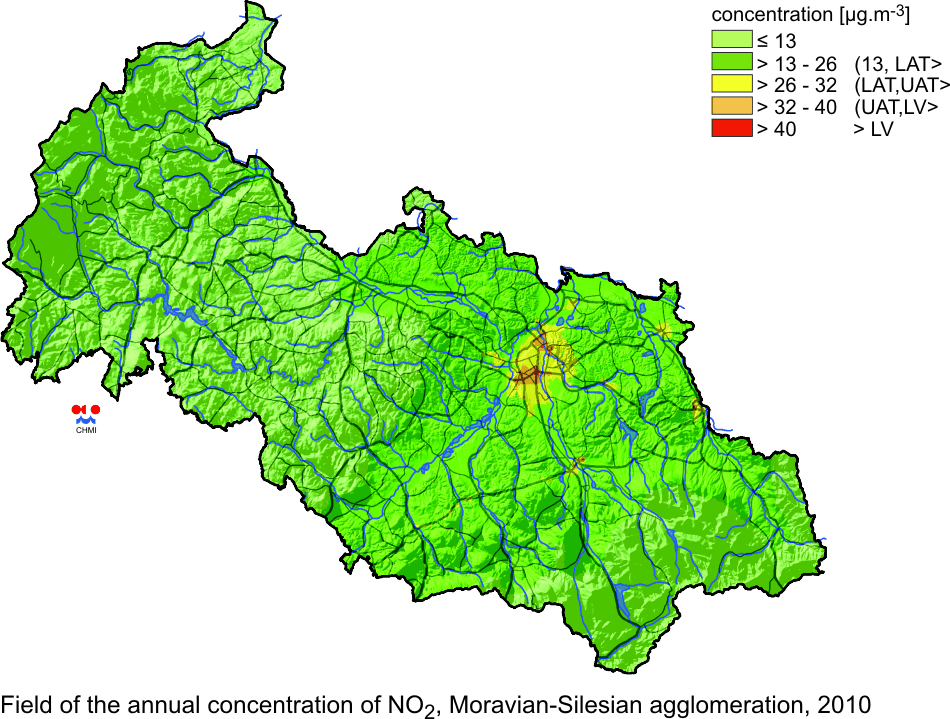
| Fig. II.4.1.34 |
Field of the annual concentration of NO2, Moravian-Silesian
agglomeration, 2010 |
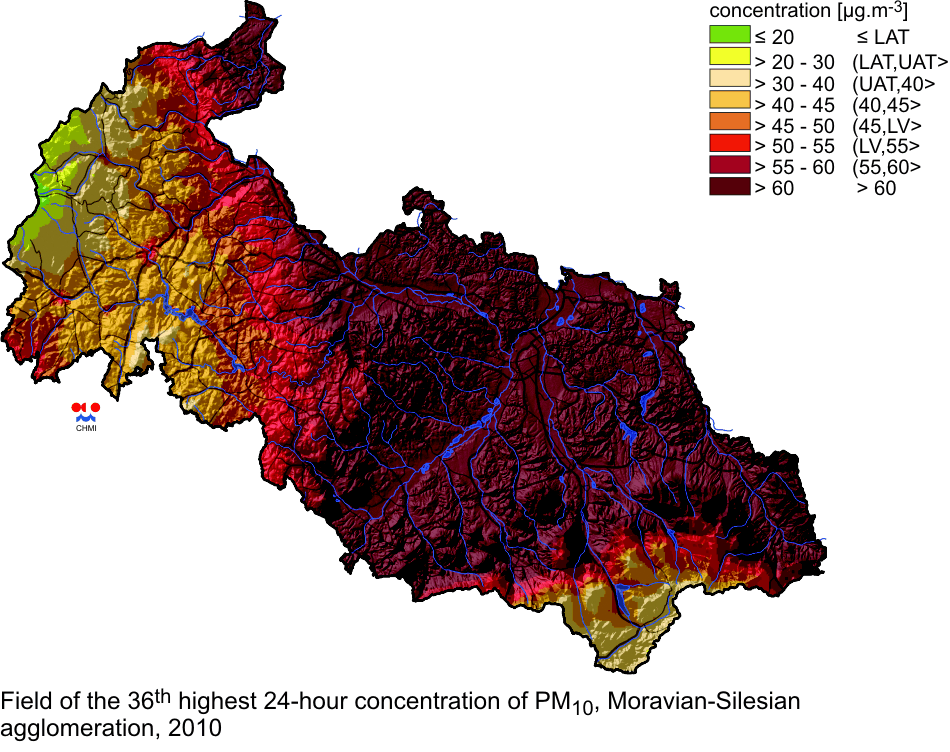
| Fig. II.4.1.35 |
Field of the 36th highest 24-hour concentration of PM10,
Moravian-Silesian agglomeration, 2010 |
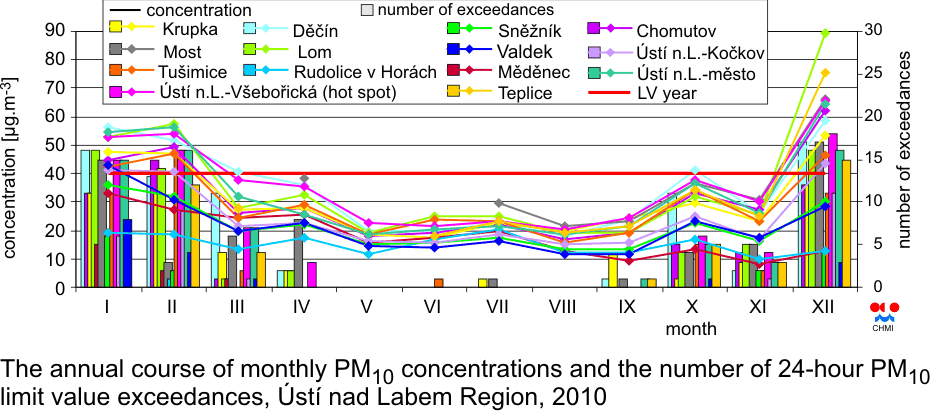
| Fig. II.4.1.36 |
The annual course of monthly PM10 concentrations and the number of
24-hour PM10 limit value exceedances, ├Üst├Ł nad Labem Region, 2010 |
| Fig. II.4.1.37 |
36th highest 24-hour PM10 concentrations, ├Üst├Ł nad Labem Region,
2010 |
| Fig. II.4.1.38 |
The annual course of monthly PM2.5 concentrations, ├Üst├Ł nad Labem
Region, 2010 |
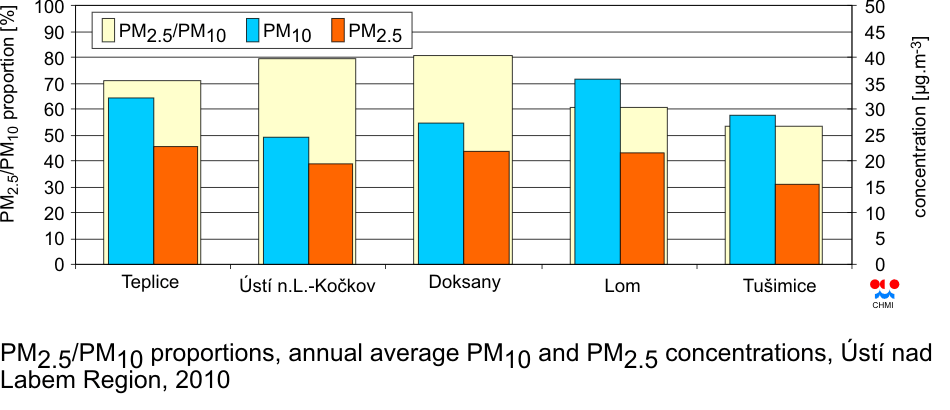
| Fig. II.4.1.39 |
The annual average concentrations of PM2.5 and PM10, PM2.5/PM10
ratio, ├Üst├Ł nad Labem Region 2010 |
| Fig. II.4.1.40 |
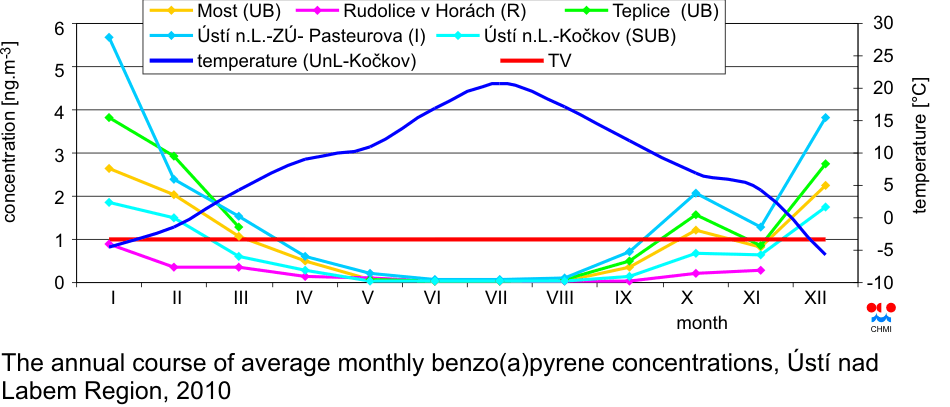
The annual course of average monthly benzo(a)pyrene concentrations,
├Üst├Ł nad Labem Region, 2010 |
| Fig. II.4.1.41 |
The annual course of average monthly PM10 and benzo(a)pyrene
concentrations, ├Üst├Ł nad Labem Region, 2010 |
| Fig. II.4.1.42 |
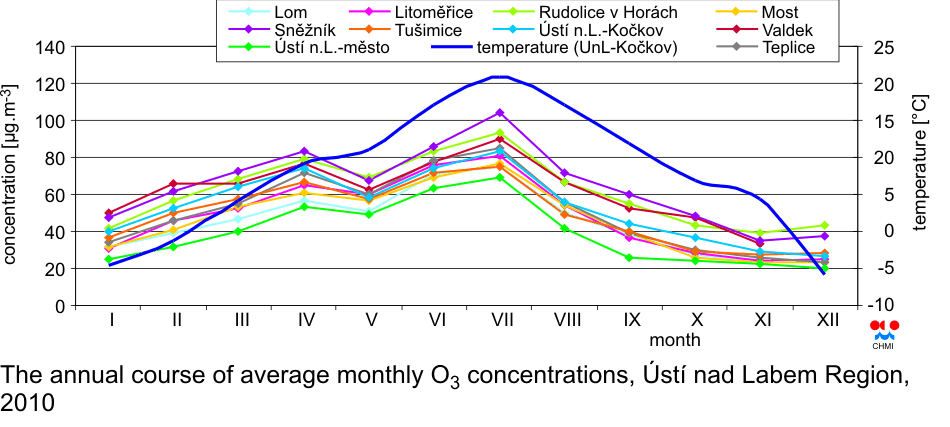
The annual course of average monthly O3 concentrations, ├Üst├Ł nad
Labem Region, 2010 |
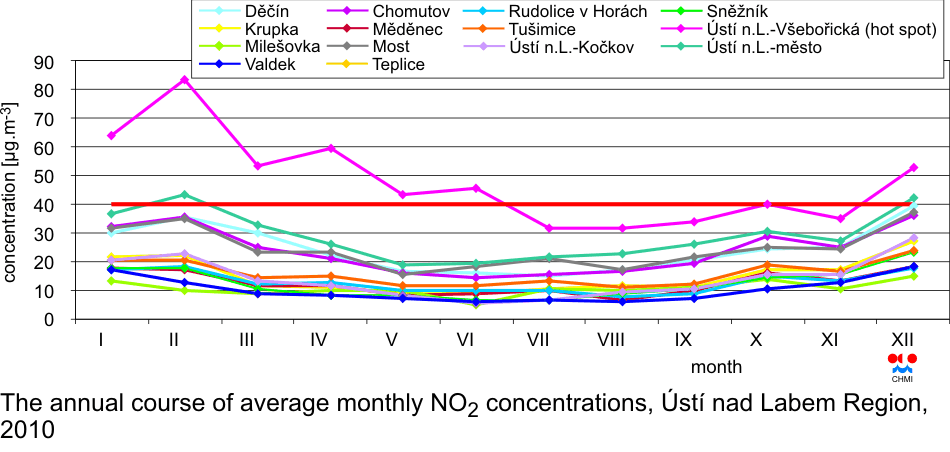
| Fig. II.4.1.43 |
The annual course of average monthly NO2 concentrations, ├Üst├Ł nad
Labem Region, 2010 |
| Fig. II.4.1.44 |
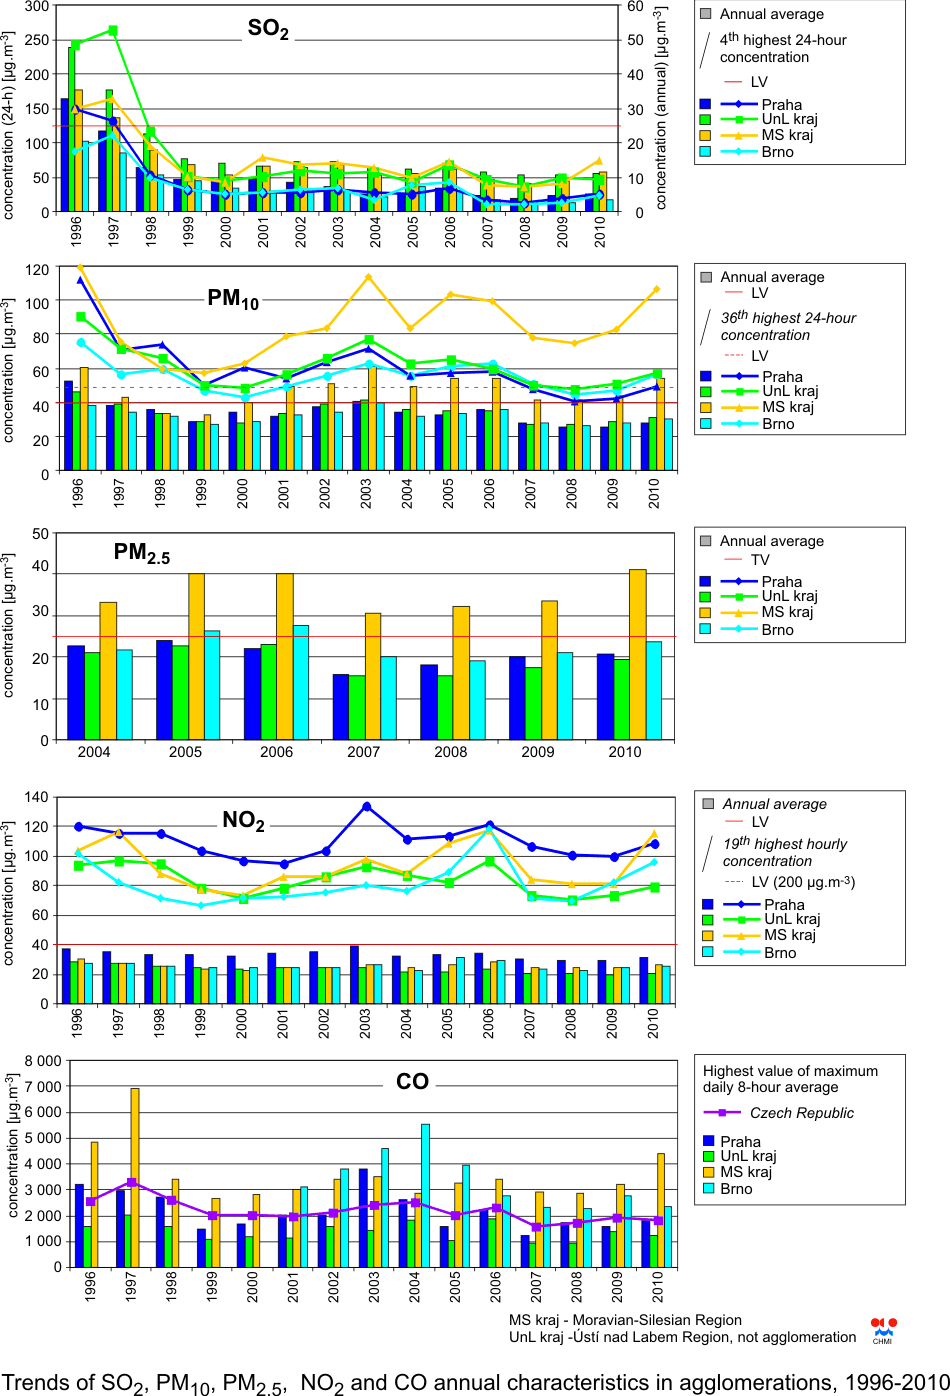
Trends of SO2, PM10, PM2.5, NO2 and CO annual characteristics in
agglomerations, 1996ŌĆō2010 |
| Fig. II.4.2.1 |
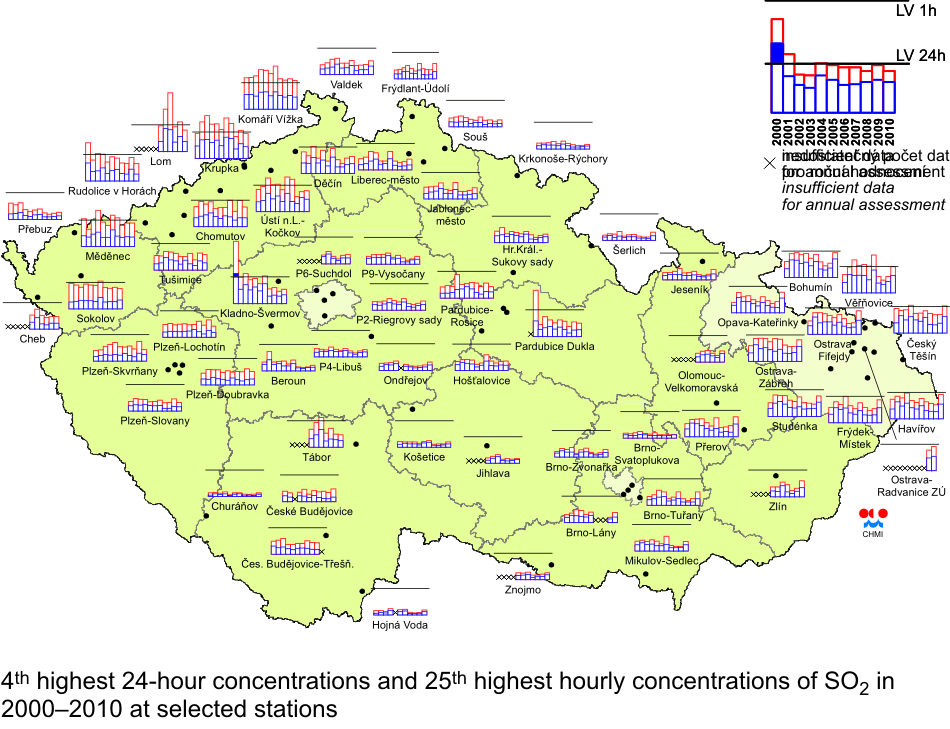
4th highest 24-hour concentrations and 25th highest hourly
concentrations of SO2 in 2000ŌĆō2010 at selected stations |
| Fig. II.4.2.2 |
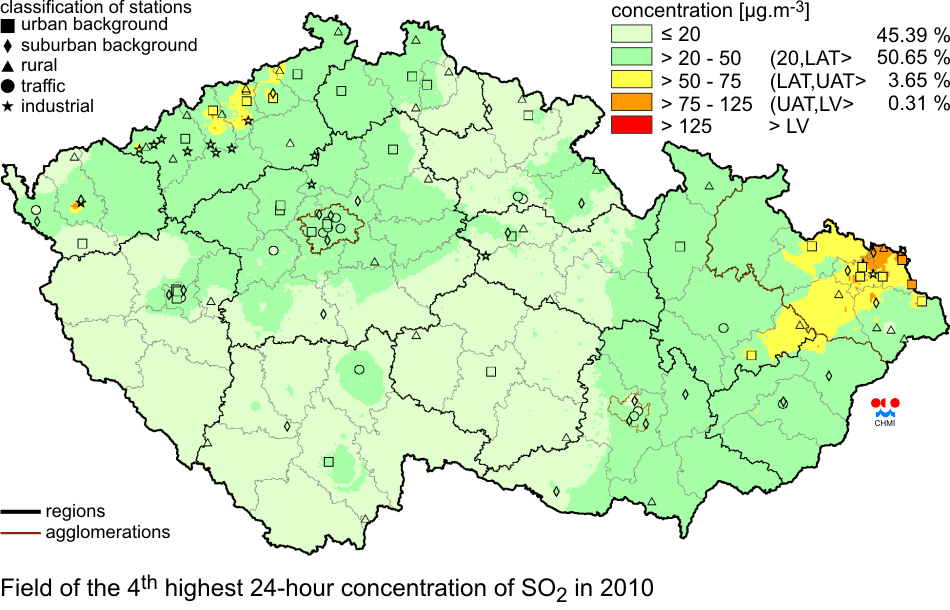
Field of the 4th highest 24-hour concentration of SO2 in 2010 |
| Fig. II.4.2.3 |
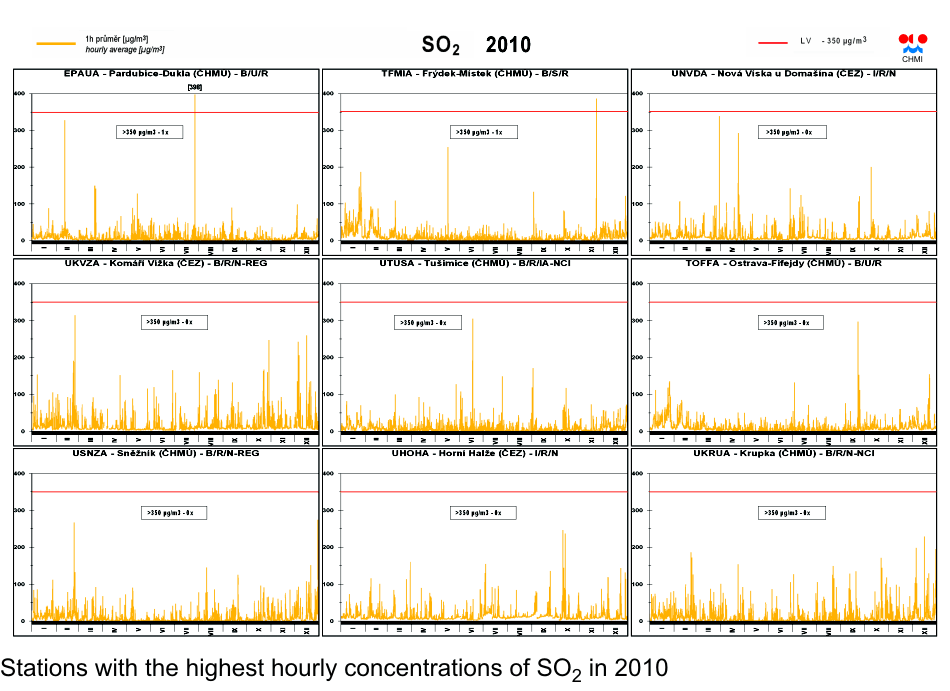
Stations with the highest hourly concentrations of SO2 in 2010 |
| Fig. II.4.2.4 |
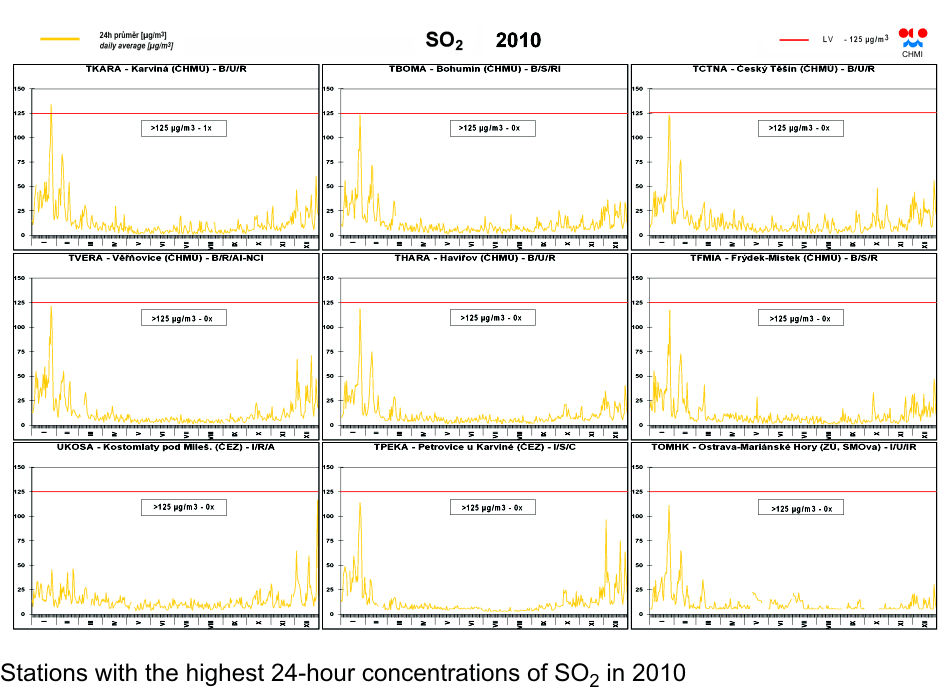
Stations with the highest 24-hour concentrations of SO2 in 2010 |
| Fig. II.4.2.5 |
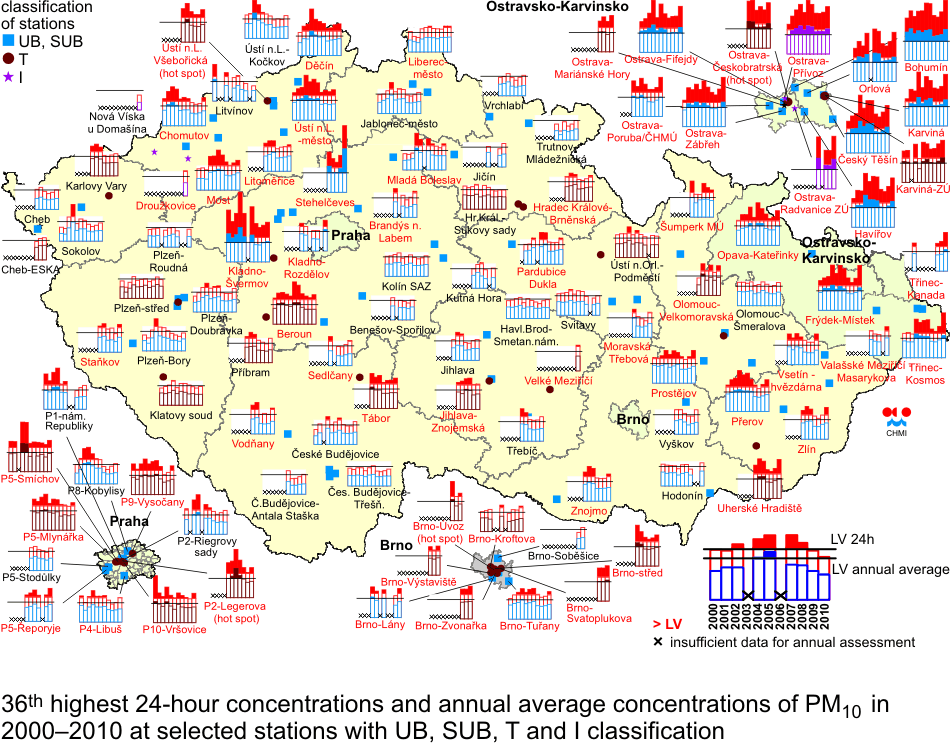
36th highest 24-hour concentrations and annual average
concentrations of PM10 in 2000ŌĆō2010 at selected stations with UB, SUB, I
and T classification |
| Fig. II.4.2.6 |
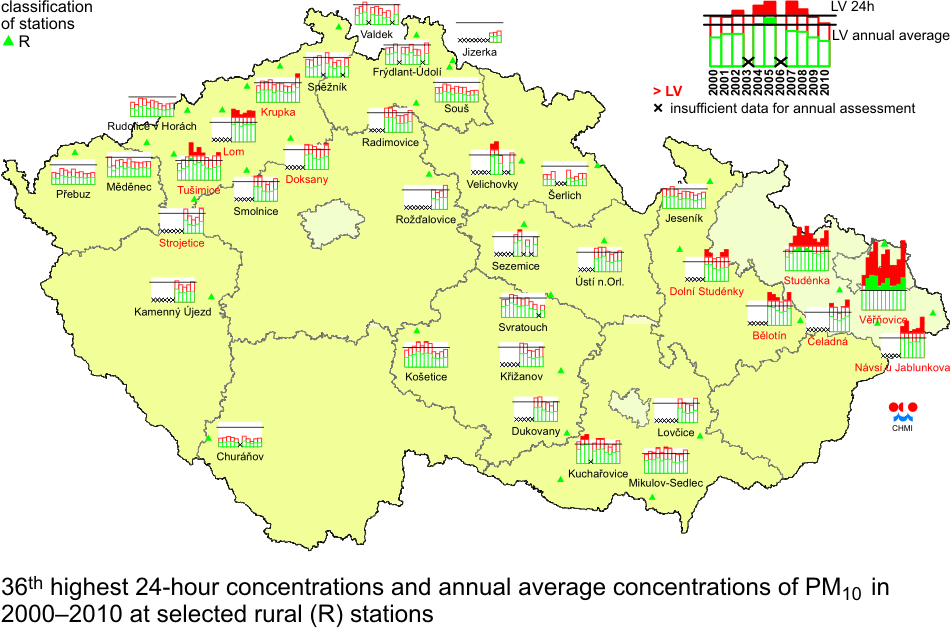
36th highest 24-hour concentrations and annual average
concentrations of PM10 in 2000ŌĆō2010 at selected rural (R) stations |
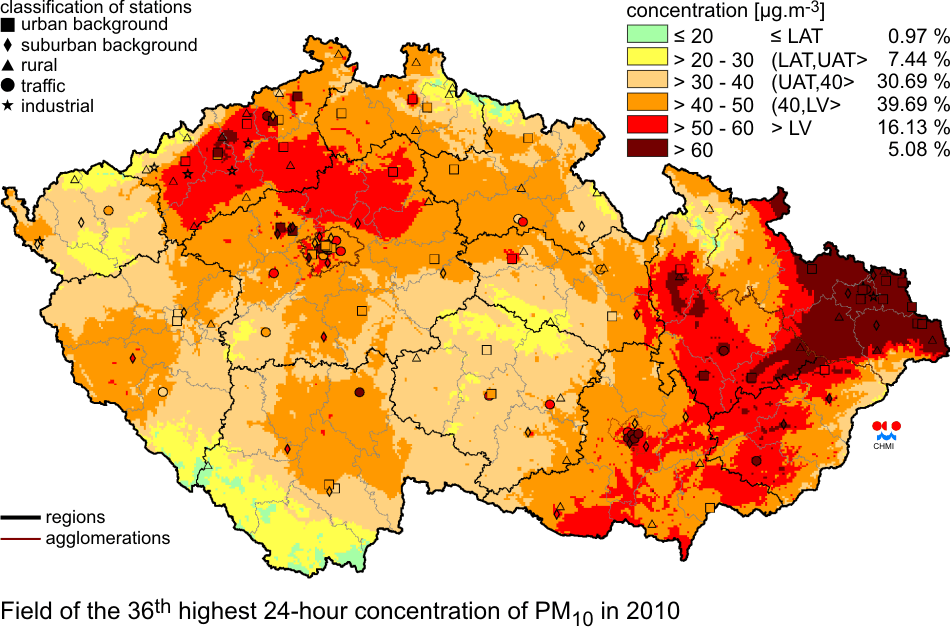
| Fig. II.4.2.7 |
Field of the 36th highest 24-hour concentration of PM10 in 2010 |
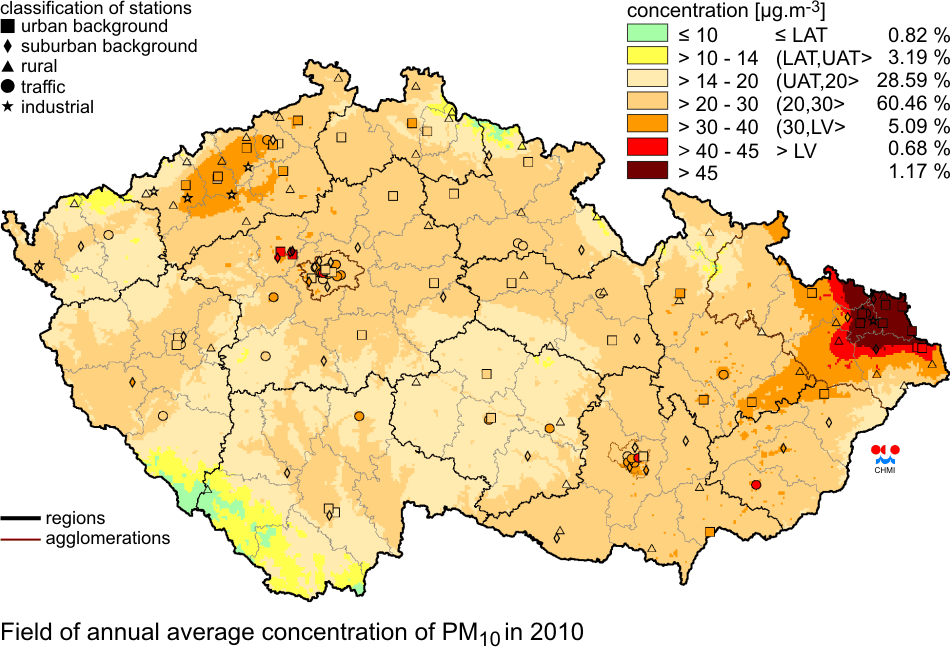
| Fig. II.4.2.8 |
Field of annual average concentration of PM10 in 2010 |
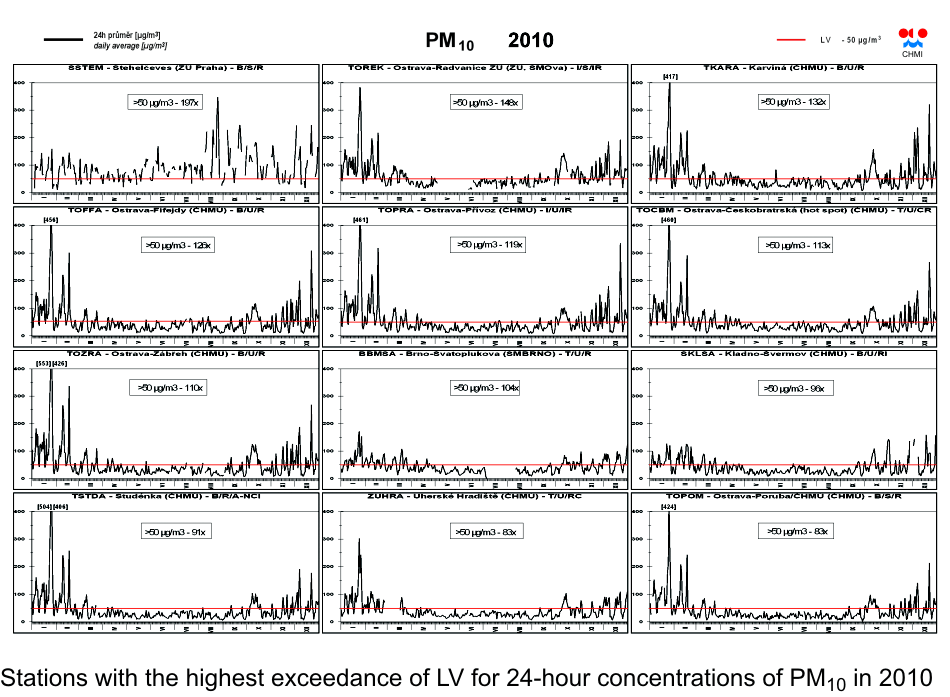
| Fig. II.4.2.9 |
Stations with the highest exceedance of LV for 24-hour
concentrations of PM10 in 2010 |
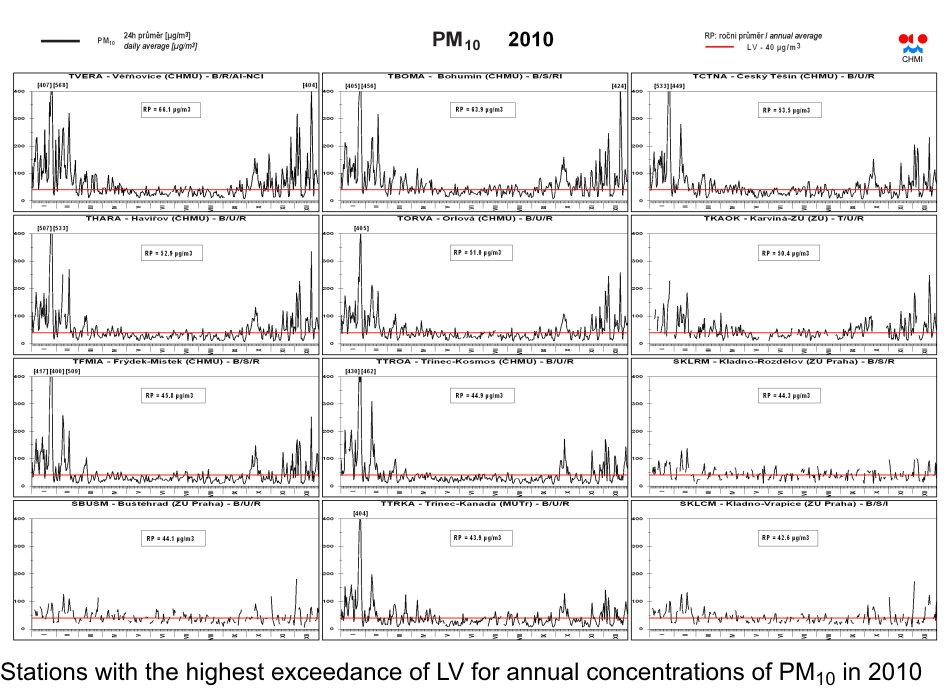
| Fig. II.4.2.10 |
Stations with the highest exceedance of LV for annual concentrations
of PM10 in 2010 |
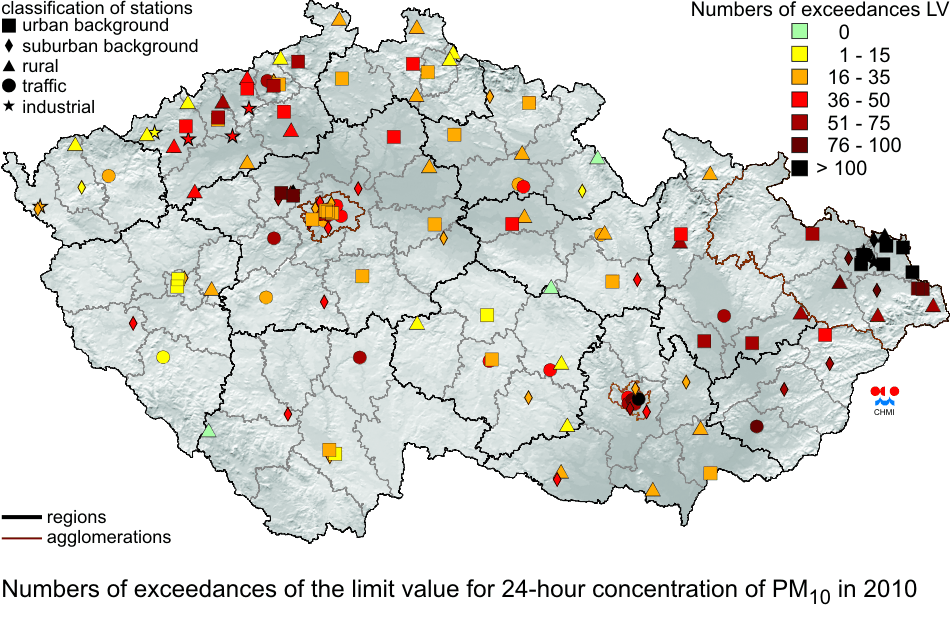
| Fig. II.4.2.11 |
Numbers of exceedances of the limit value for 24-hour concentration
of PM10 in 2010 |
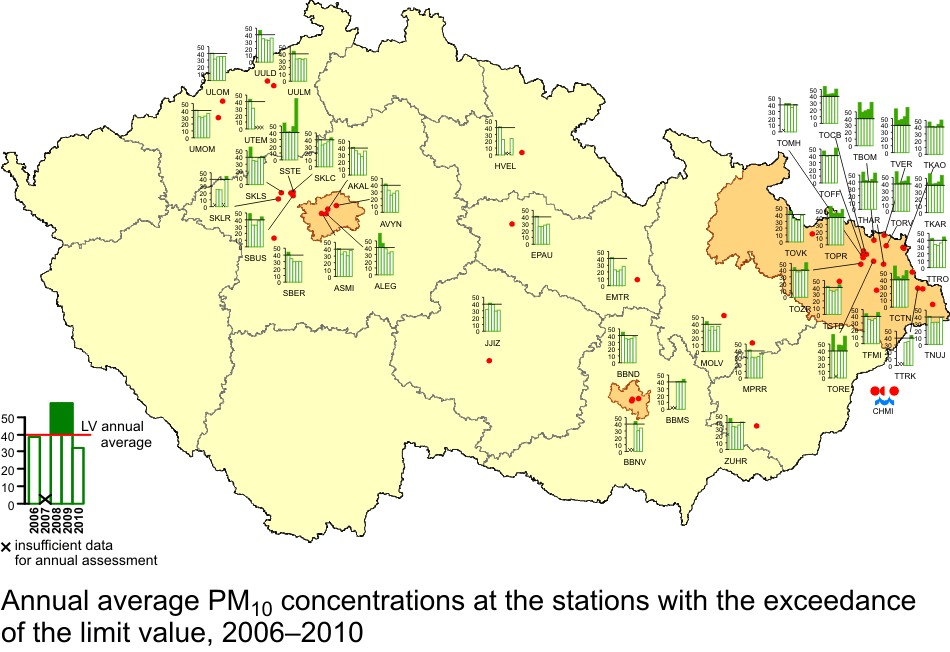
| Fig. II.4.2.12 |
Annual average PM10 concentrations at the stations with the
exceedance of the limit value, 2006ŌĆō2010 |
| Fig. II.4.2.13 |
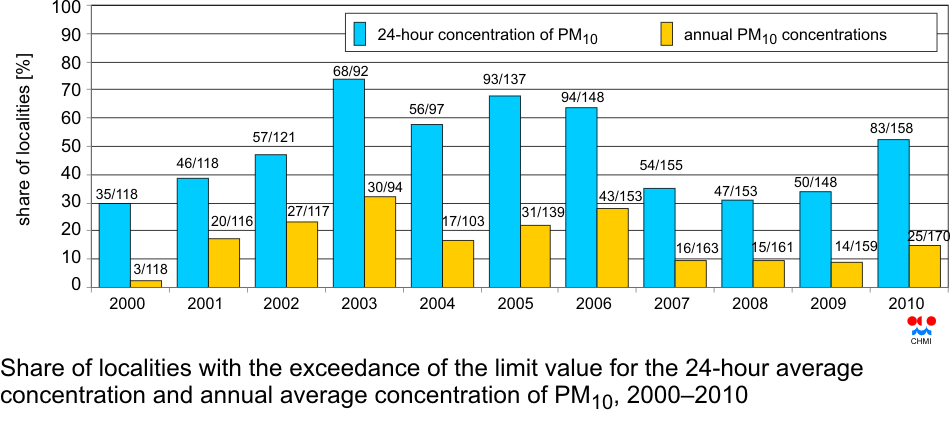
Share of localities with the exceedance of the limit value for the
24-hour average concentration and annual average concentration of PM10,
2000ŌĆō2010 |
| Fig. II.4.2.14 |
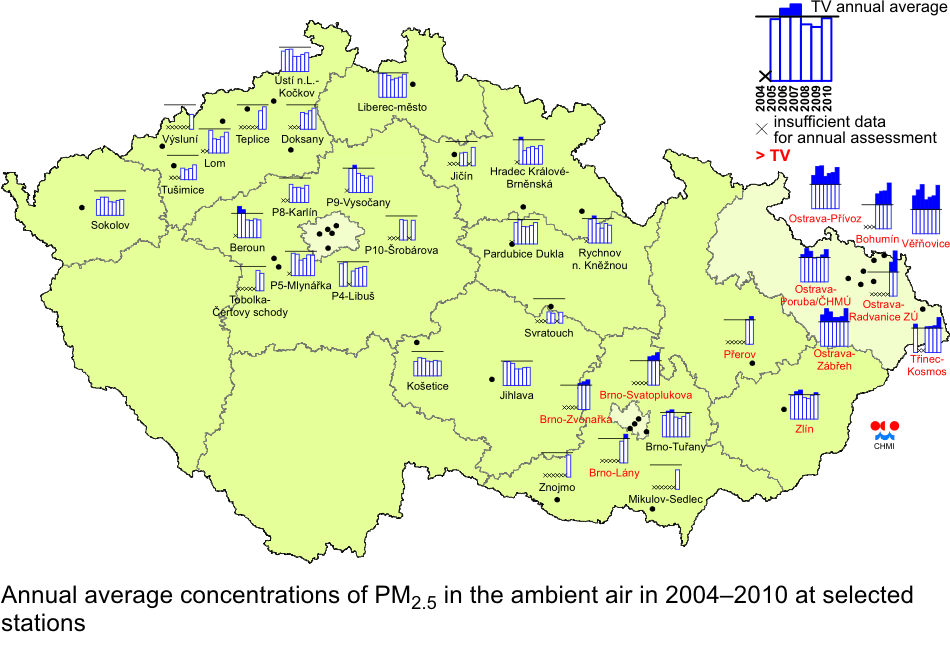
Annual average concentrations of PM2.5 in the ambient air in
2004ŌĆō2010 at selected stations |
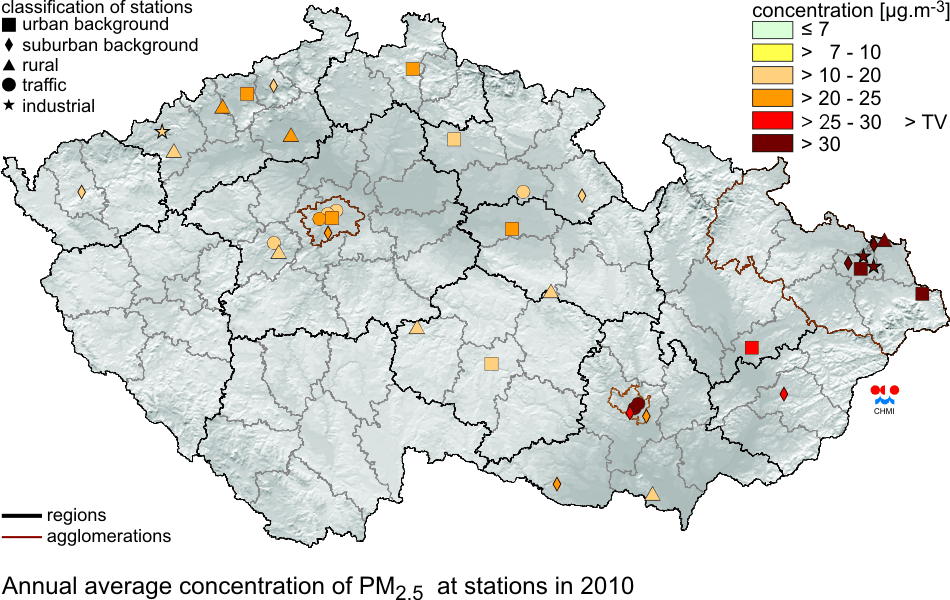
| Fig. II.4.2.15 |
Annual average concentration of PM2.5 at stations in 2010 |
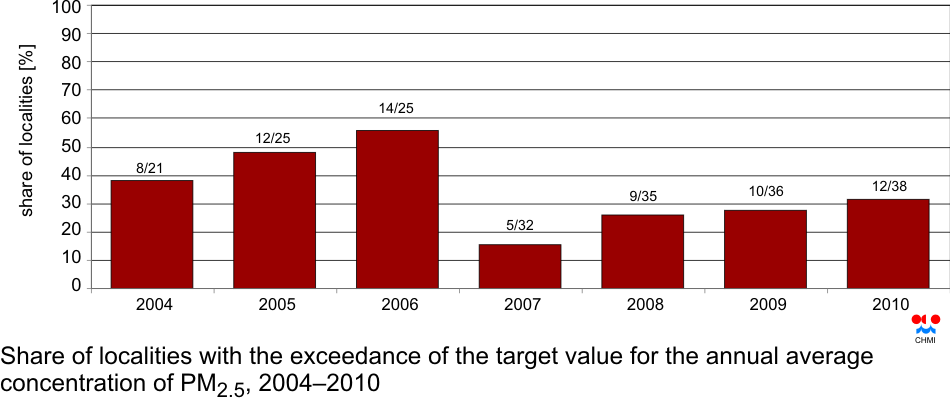
| Fig. II.4.2.16 |
Share of localities with the exceedance of the target value for the
annual average concentration of PM2.5, 2004ŌĆō2010 |
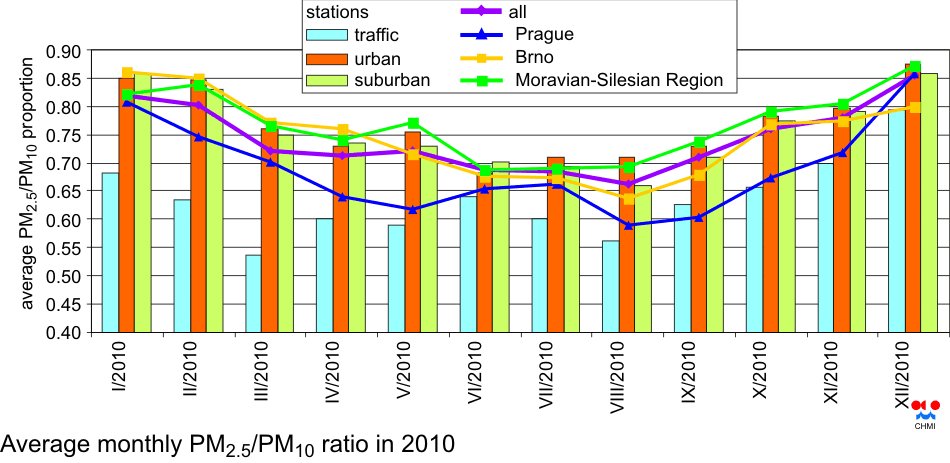
| Fig. II.4.2.17 |
Average monthly PM2.5/PM10 ratio in 2010 |
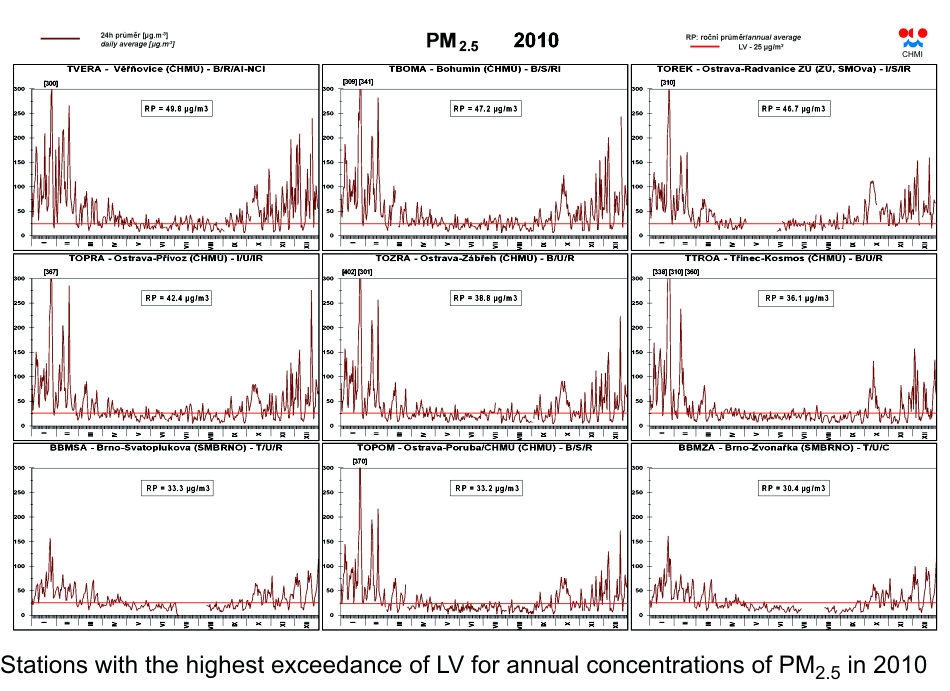
| Fig. II.4.2.18 |
Stations with the highest exceedance of LV for annual concentrations
of PM2.5 in 2010 |
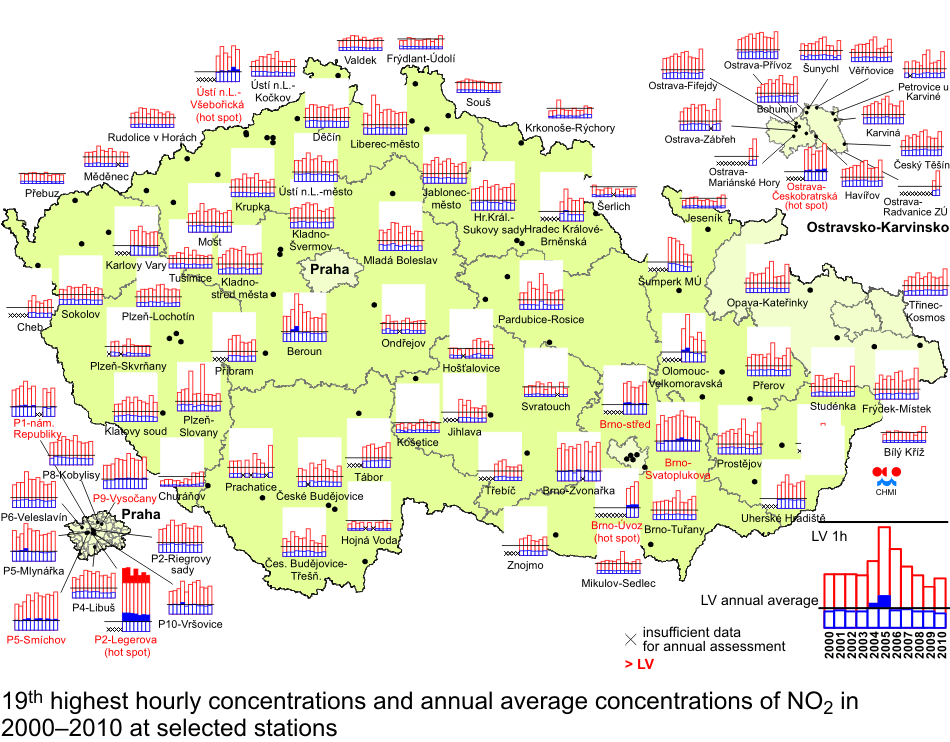
| Fig. II.4.2.19 |
19th highest hourly concentrations and annual average concentrations
of NO2 in 2000ŌĆō2010 at selected stations |
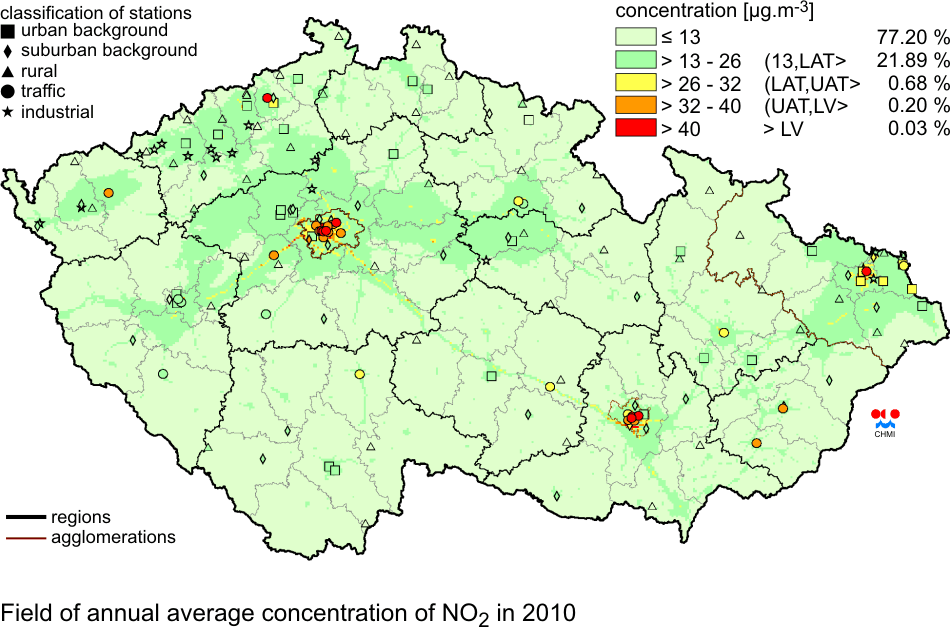
| Fig. II.4.2.20 |
Field of annual average concentration of NO2 in 2010 |
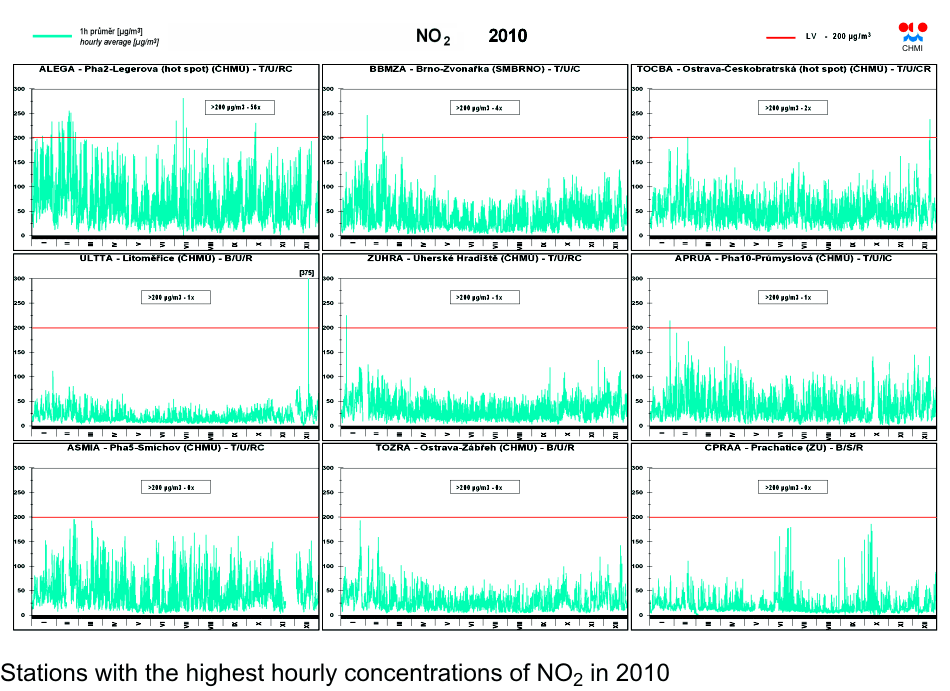
| Fig. II.4.2.21 |
Stations with the highest hourly concentrations of NO2 in 2010 |
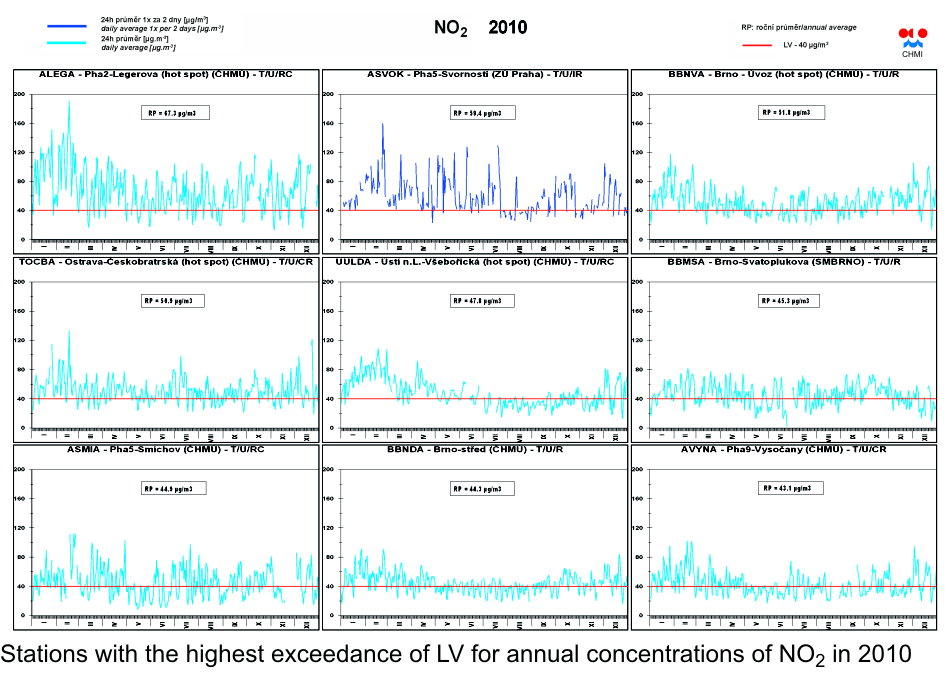
| Fig. II.4.2.22 |
Stations with the highest exceedance of LV for annual concentrations
of NO2 in 2010 |
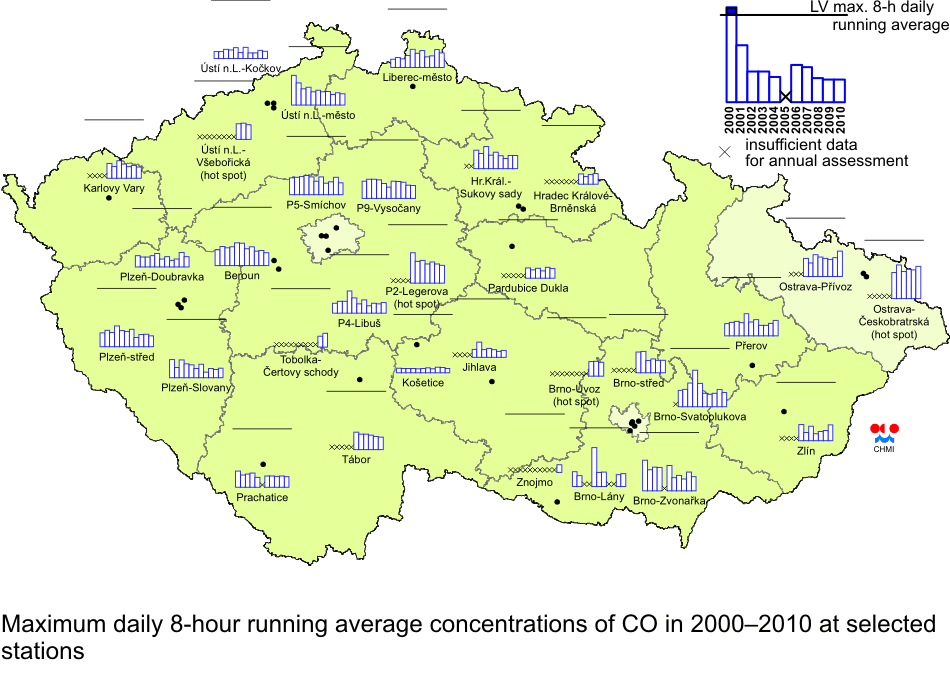
| Fig. II.4.2.23 |
Maximum daily 8-hour running average concentrations of CO in
2000ŌĆō2010 at selected stations |
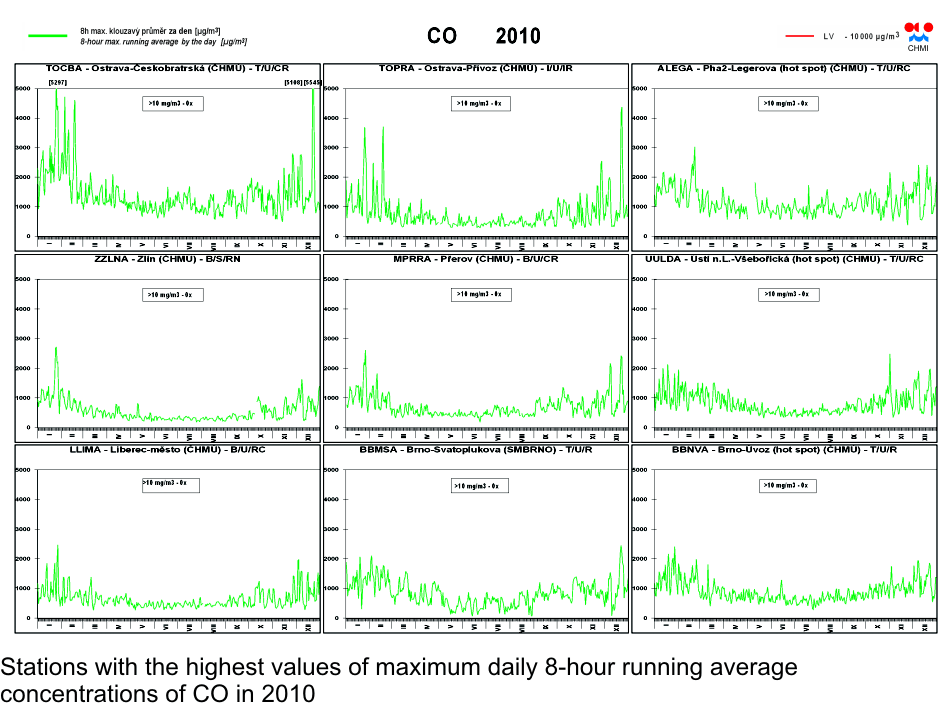
| Fig. II.4.2.24 |
Stations with the highest values of maximum daily 8-hour running
average concentrations of CO in 2010 |
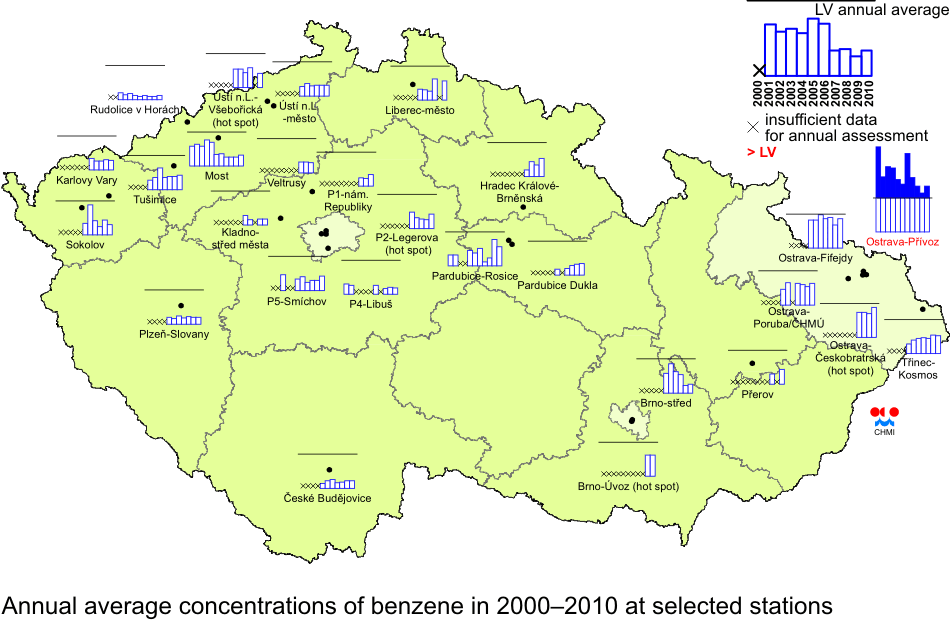
| Fig. II.4.2.25 |
Annual average concentrations of benzene in 2000ŌĆō2010 at selected
stations |
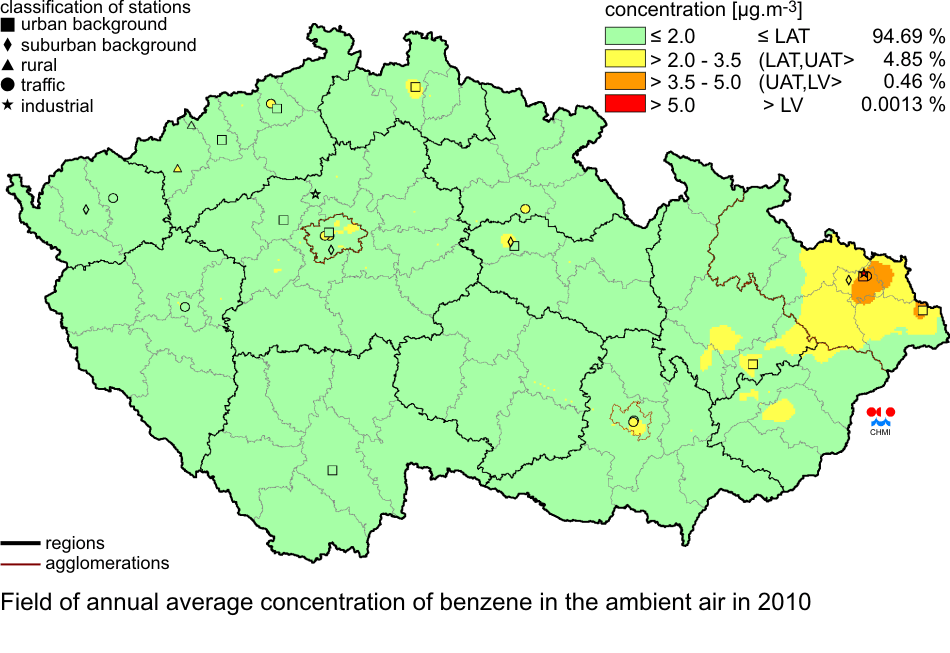
| Fig. II.4.2.26 |
Field of annual average concentration of benzene in the ambient air
in 2010 |
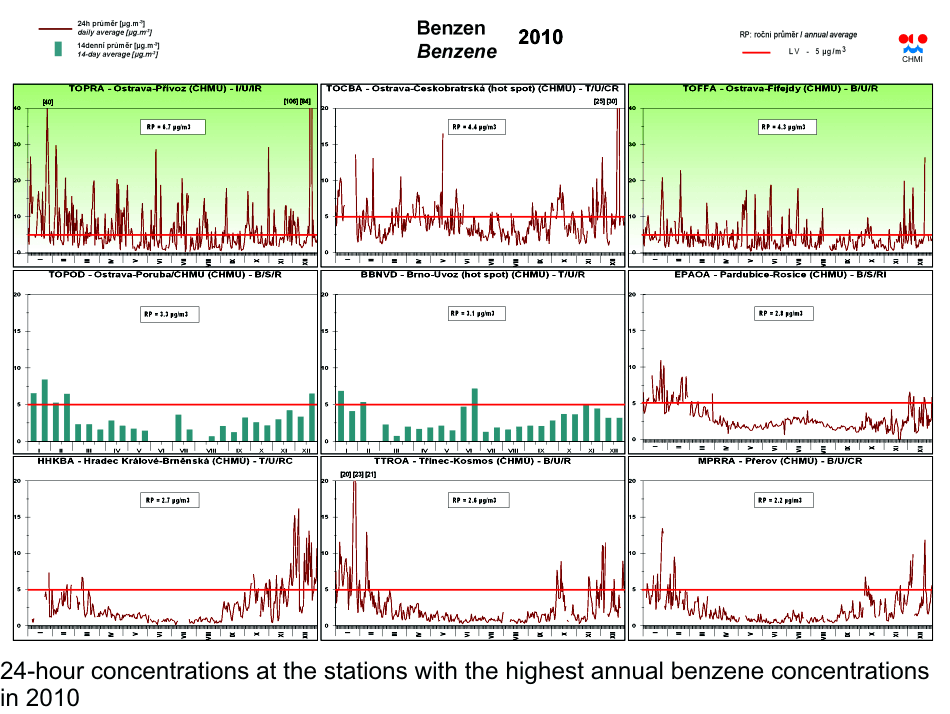
| Fig. II.4.2.27 |
24-hour concentrations at the stations with the highest annual
benzene concentrations in 2010 |
| Fig. II.4.2.28 |
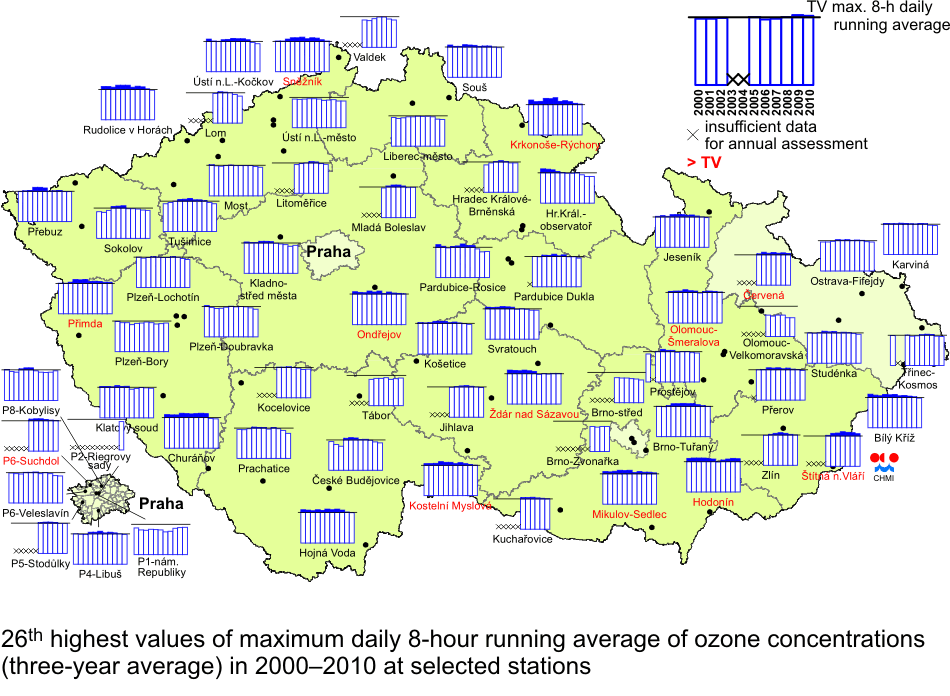
26th highest values of maximum daily 8-hour running average of
ground-level ozone concentrations (three-year average) in 2000ŌĆō2010 at
selected stations |
| Fig. II.4.2.29 |
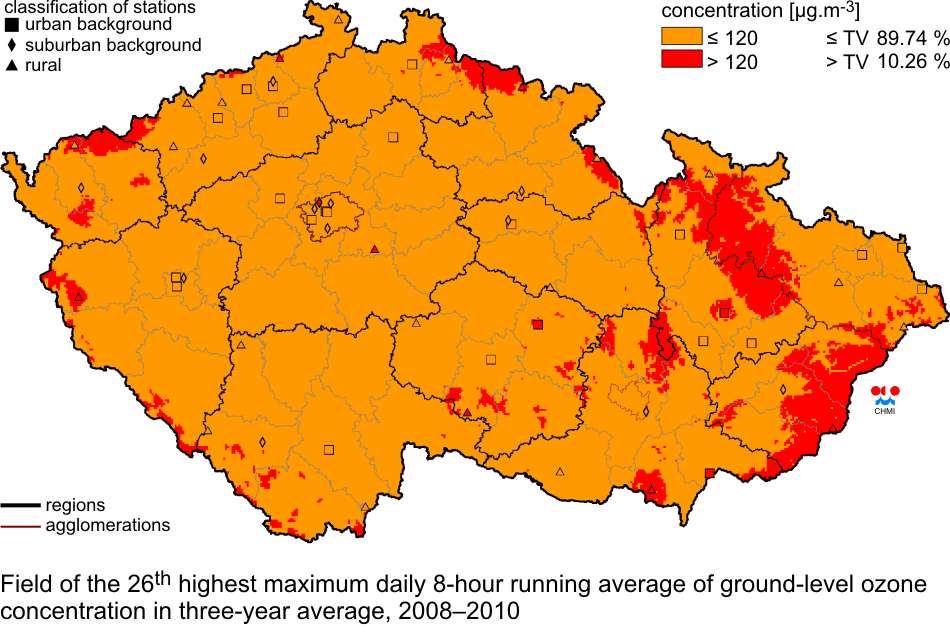
Field of the 26th highest maximum daily 8-hour running average of
ground-level ozone concentrations in three-year average, 2008ŌĆō2010 |
| Fig. II.4.2.30 |
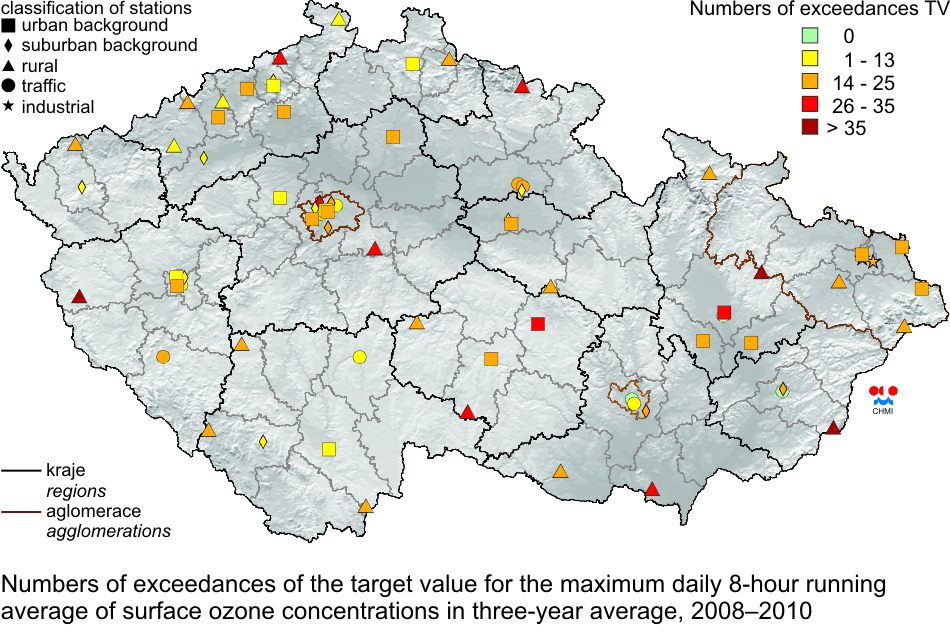
Numbers of exceedances of the target value for the maximum daily
8-hour running average of ground-level ozone concentrations in
three-year average, 2008ŌĆō2010 |
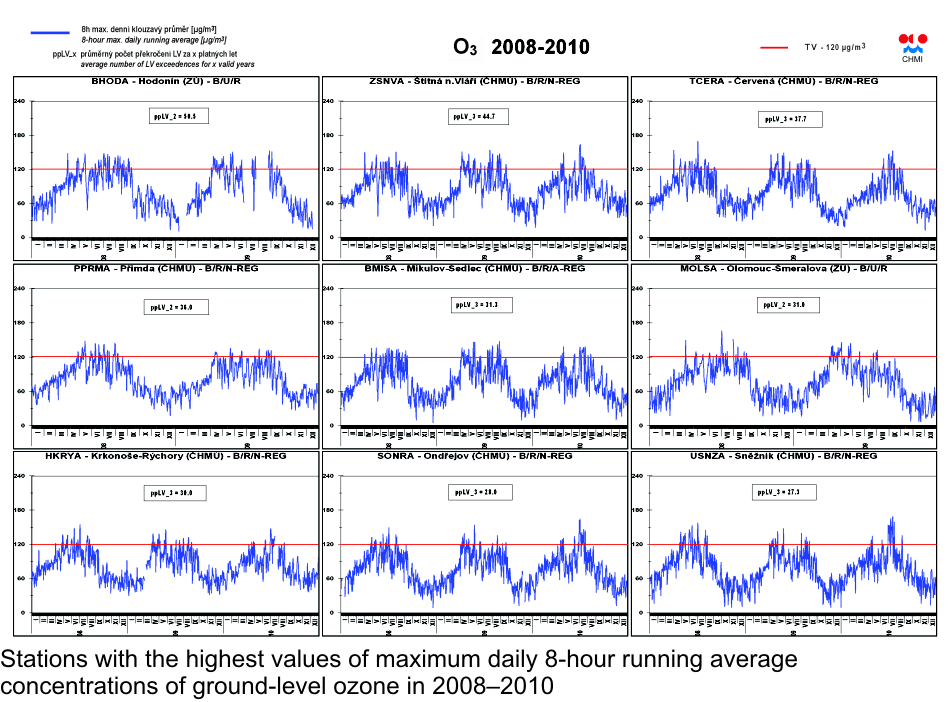
| Fig. II.4.2.31 |
Stations with the highest values of maximum daily 8-hour running
average concentrations of ground-level ozone in 2008ŌĆō2010 |
| Fig. II.4.2.32 |
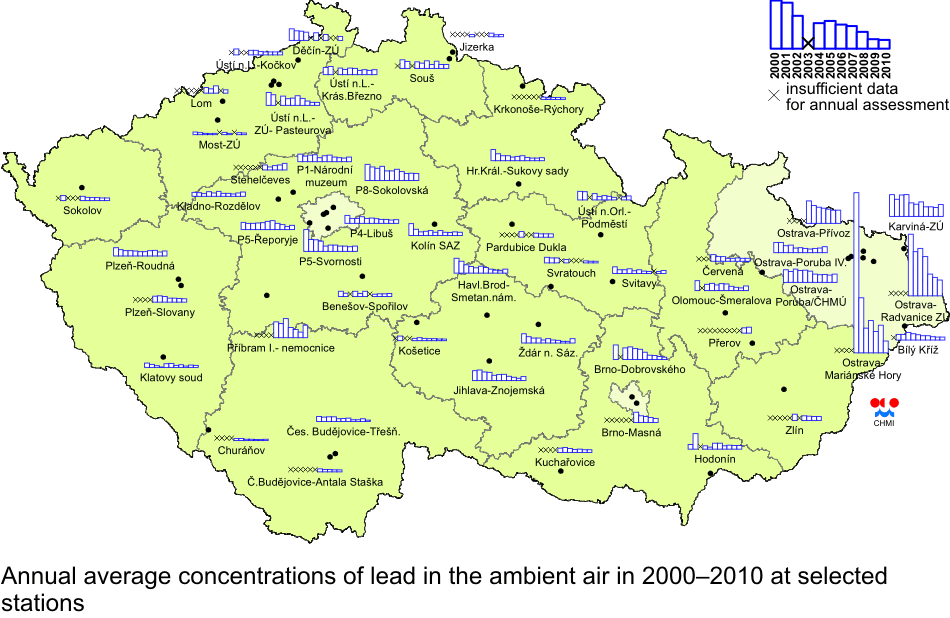
Annual average concentrations of lead in the ambient air in
2000ŌĆō2010 at selected stations |
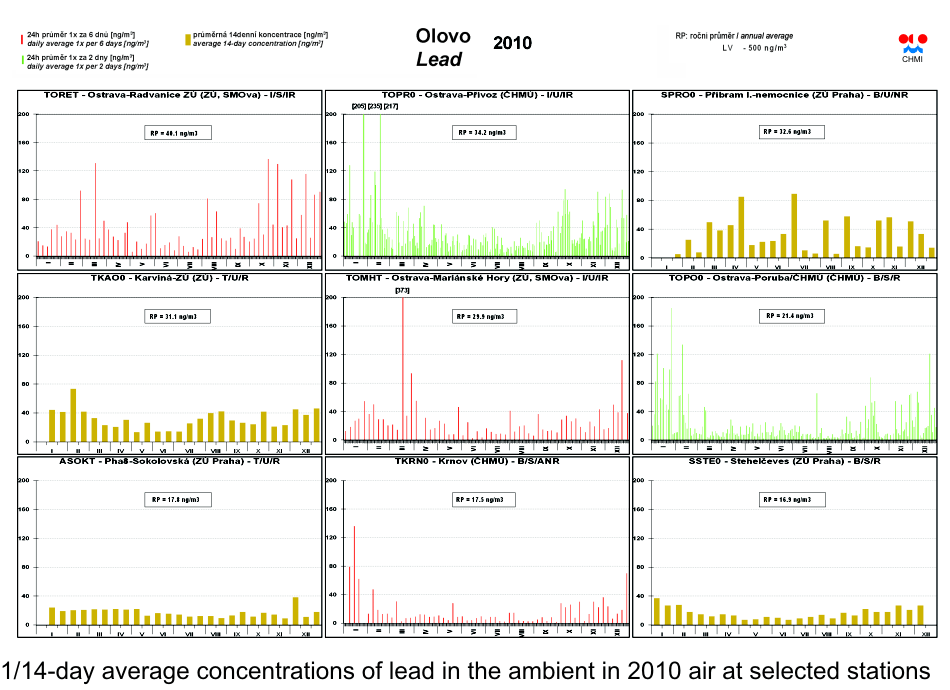
| Fig. II.4.2.33 |
1/14-day average concentrations of lead in the ambient air in 2010
at selected stations |
| Fig. II.4.2.34 |
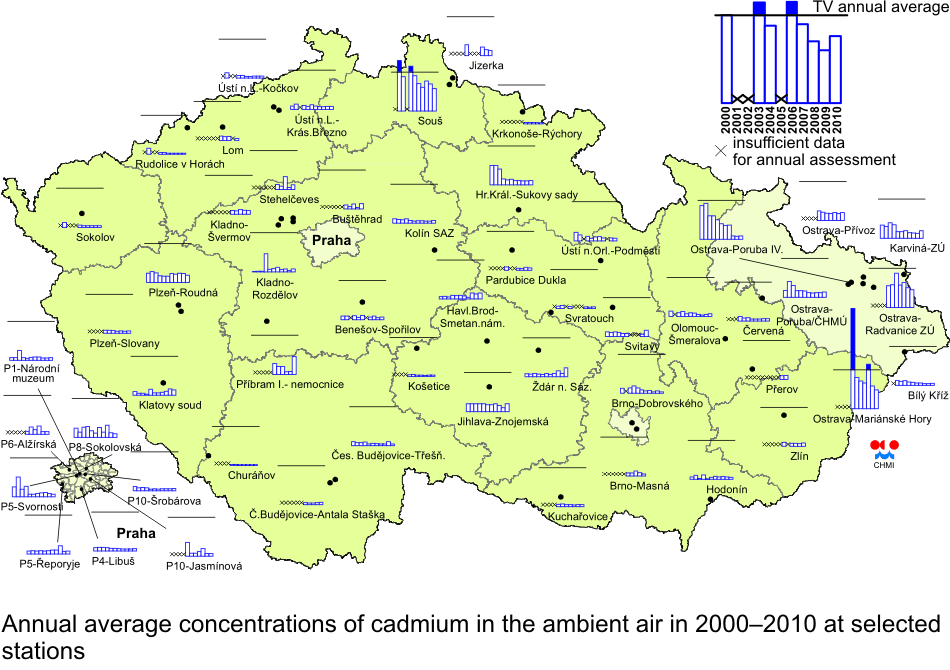
Annual average concentrations of cadmium in the ambient air in
2000ŌĆō2010 at selected stations |
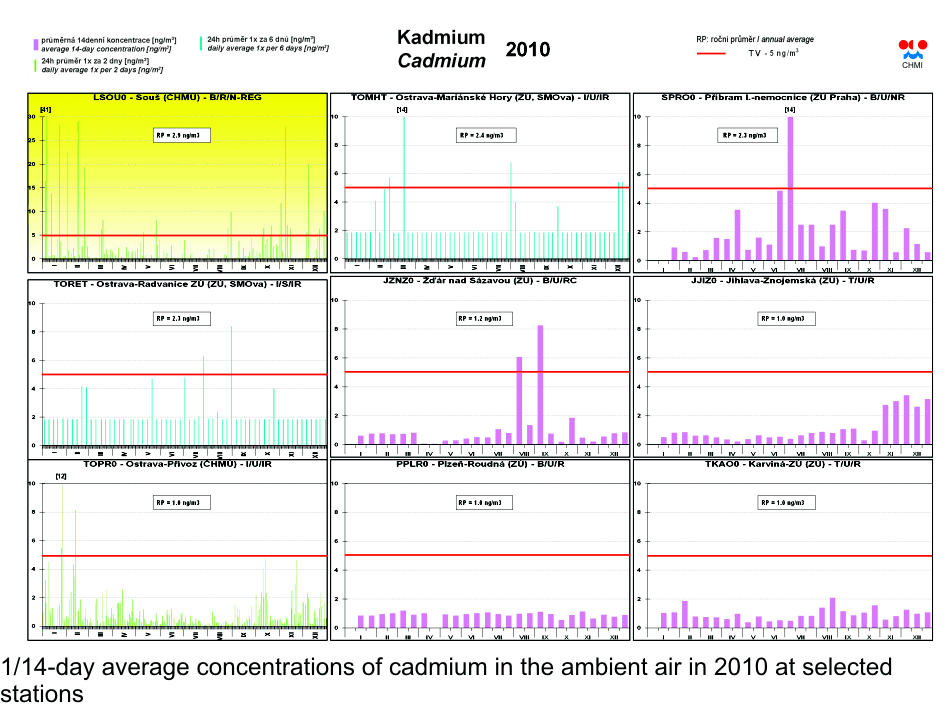
| Fig. II.4.2.35 |
1/14-day average concentrations of cadmium in the ambient air in
2010 at selected stations |
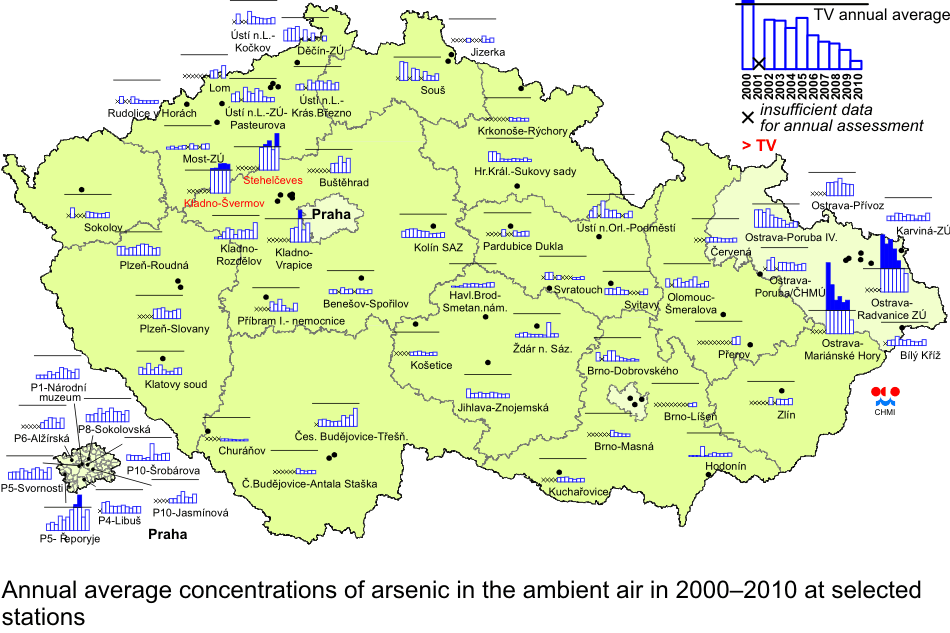
| Fig. II.4.2.36 |
Annual average concentrations of arsenic in the ambient air in
2000ŌĆō2010 at selected stations |
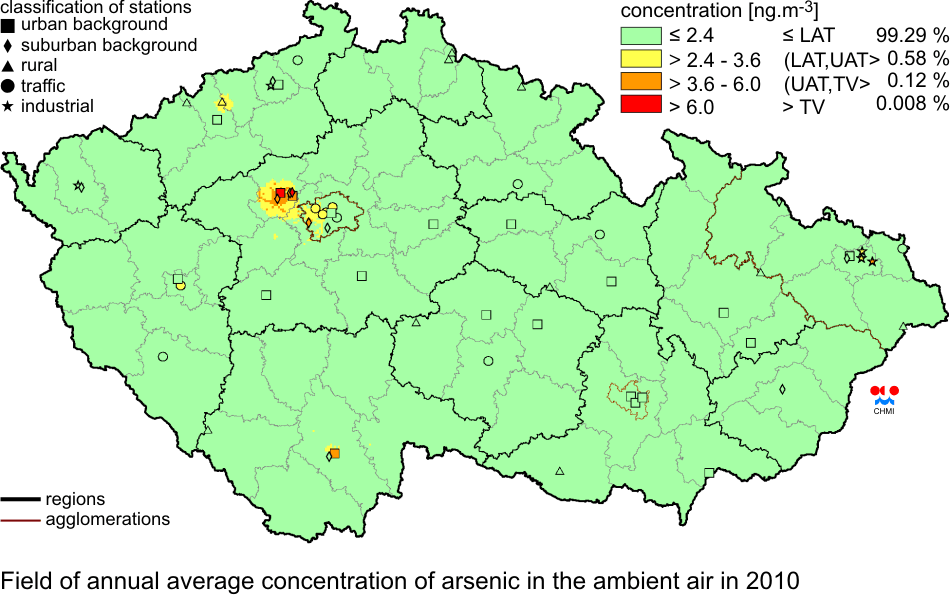
| Fig. II.4.2.37 |
Field of annual average concentration of arsenic in the ambient air
in 2010 |
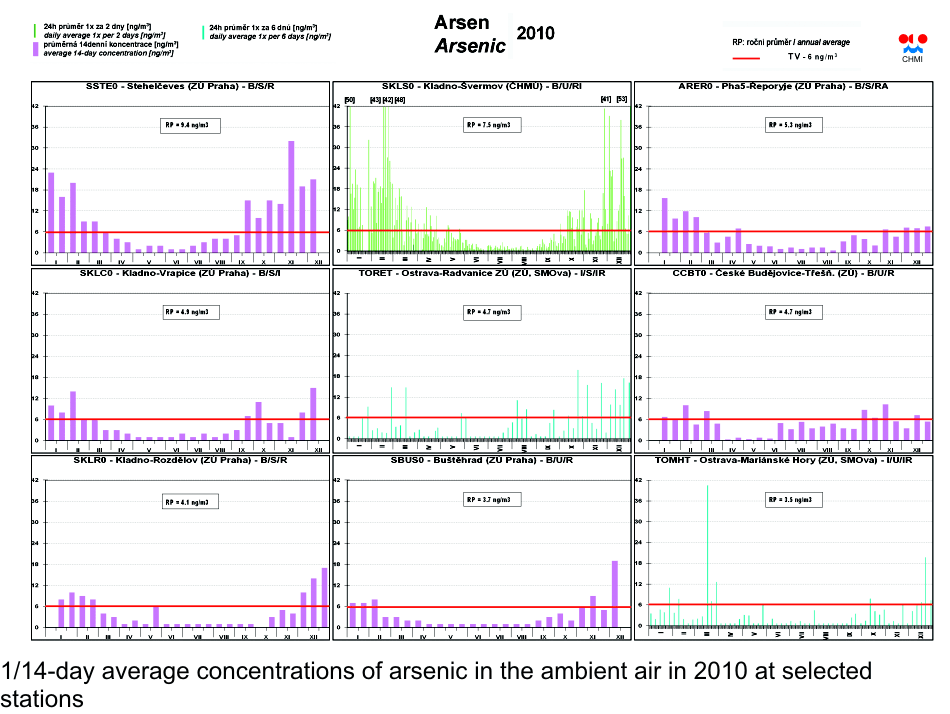
| Fig. II.4.2.38 |
1/14-day average concentrations of arsenic in the ambient air in
2010 at selected stations |
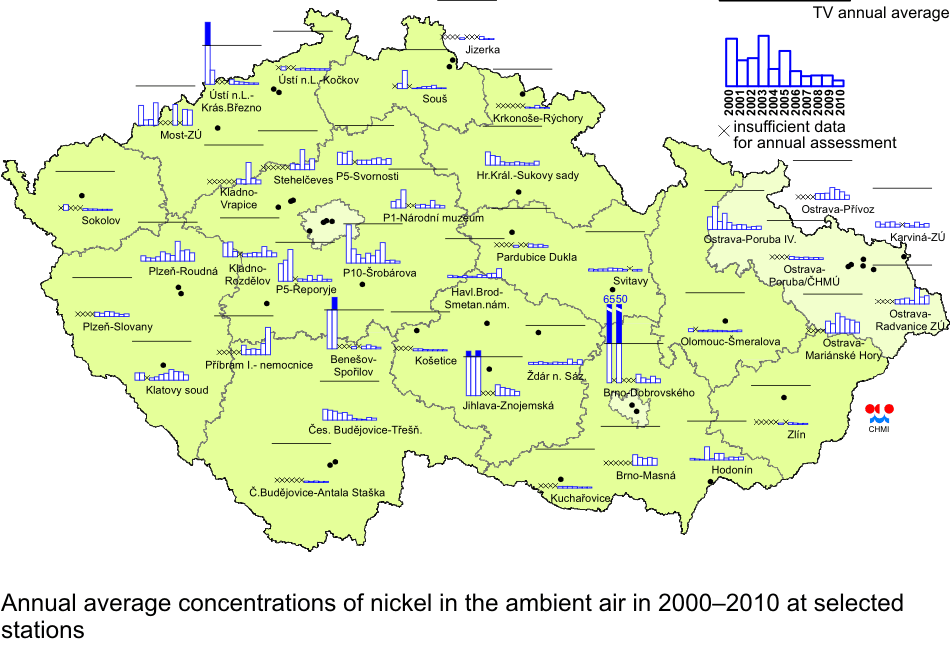
| Fig. II.4.2.39 |
Annual average concentrations of nickel in the ambient air in
2000ŌĆō2010 at selected stations |
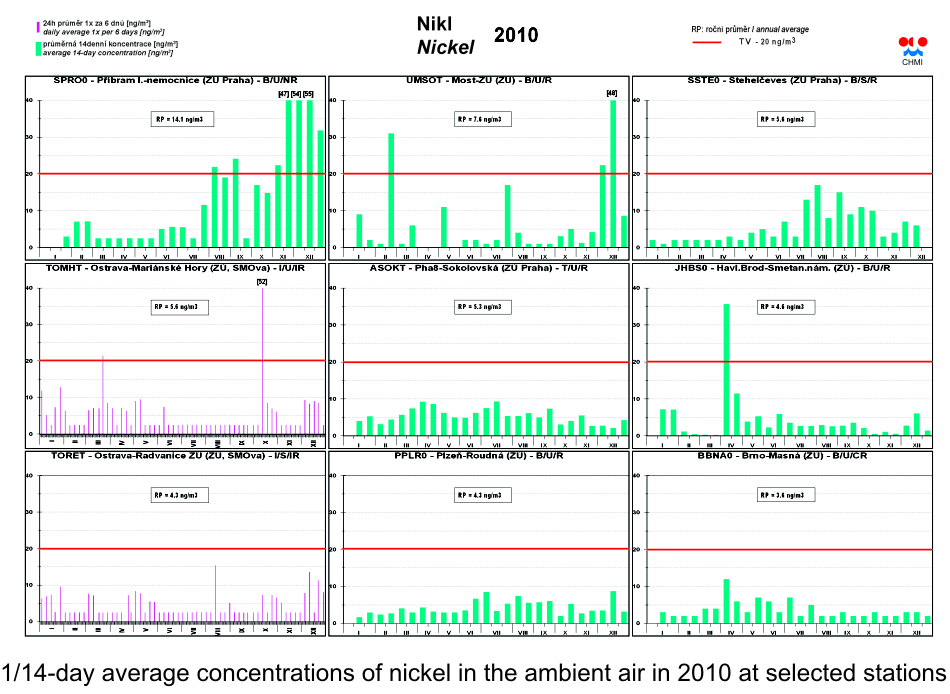
| Fig. II.4.2.40 |
1/14-day average concentrations of nickel in the ambient air in 2010
at selected stations |
| Fig. II.4.2.41 |
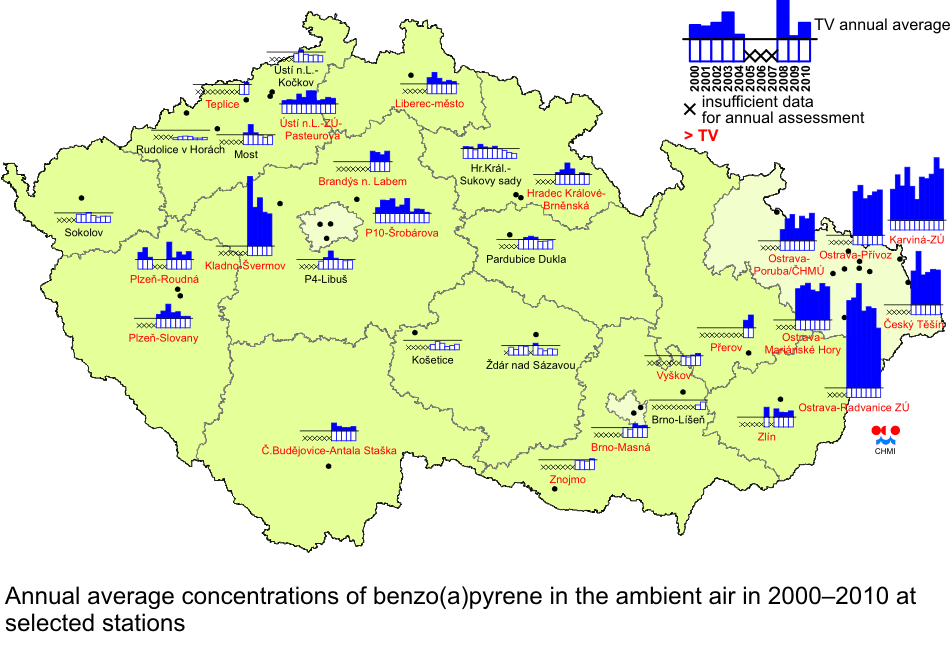
Annual average concentrations of benzo(a)pyrene in the ambient air
in 2000ŌĆō2010 at selected stations |
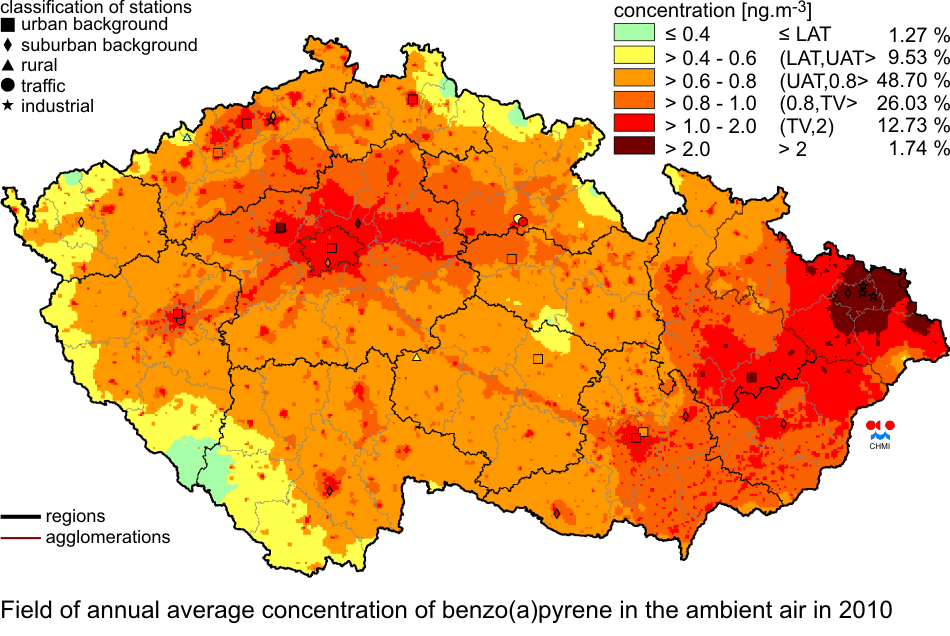
| Fig. II.4.2.42 |
Field of annual average concentration of benzo(a)pyrene in the
ambient air in 2010 |
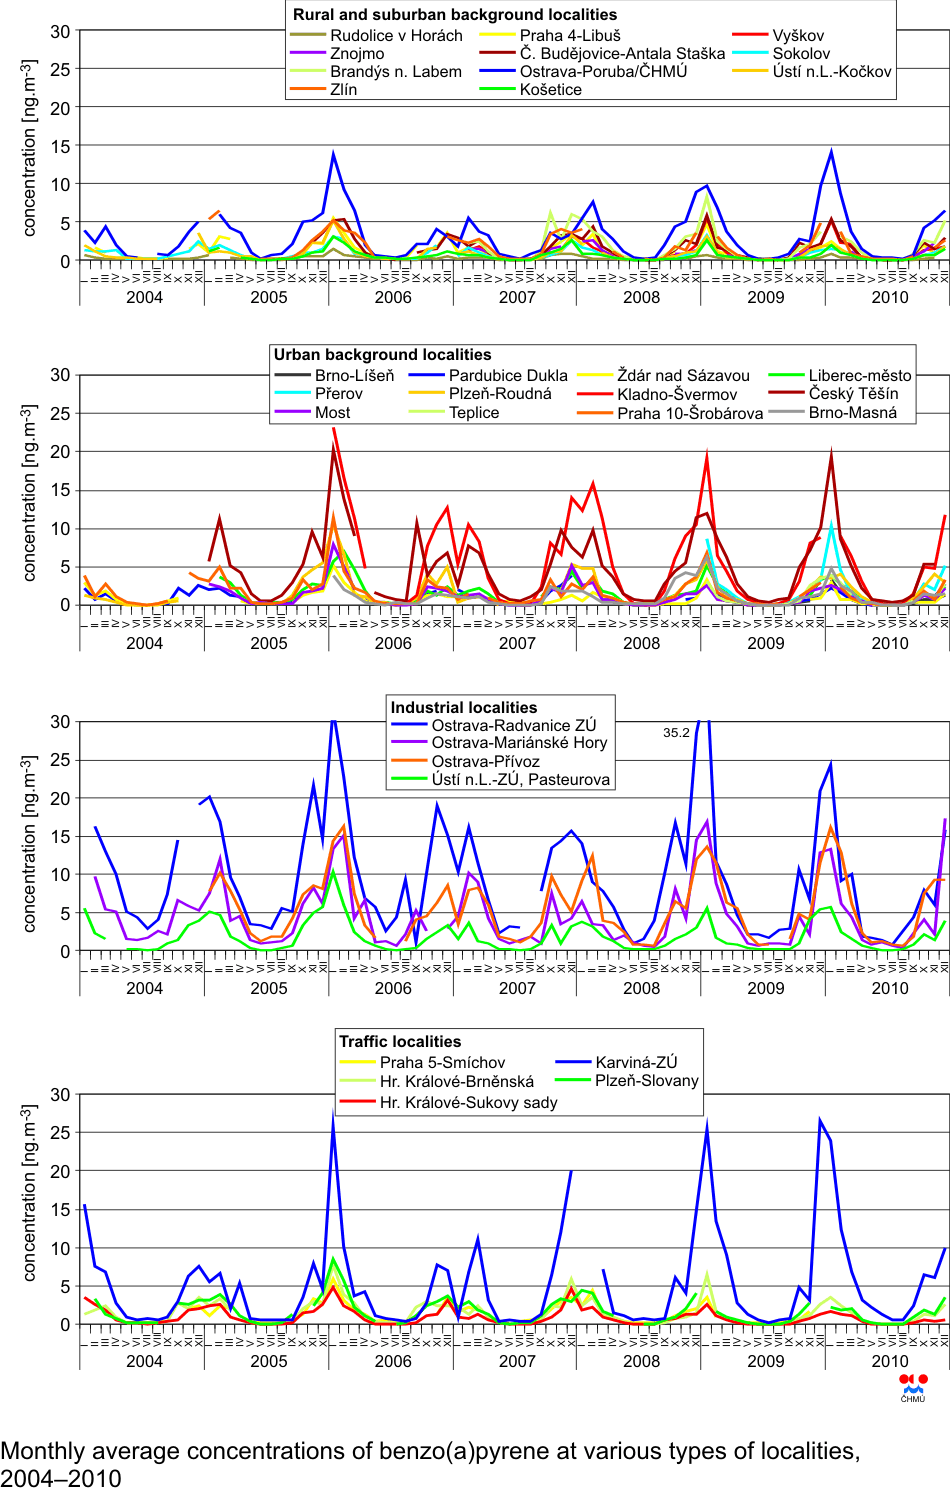
| Fig. II.4.2.43 |
Monthly average concentrations of benzo(a)pyrene in various types of
localities, 2004ŌĆō2010 |
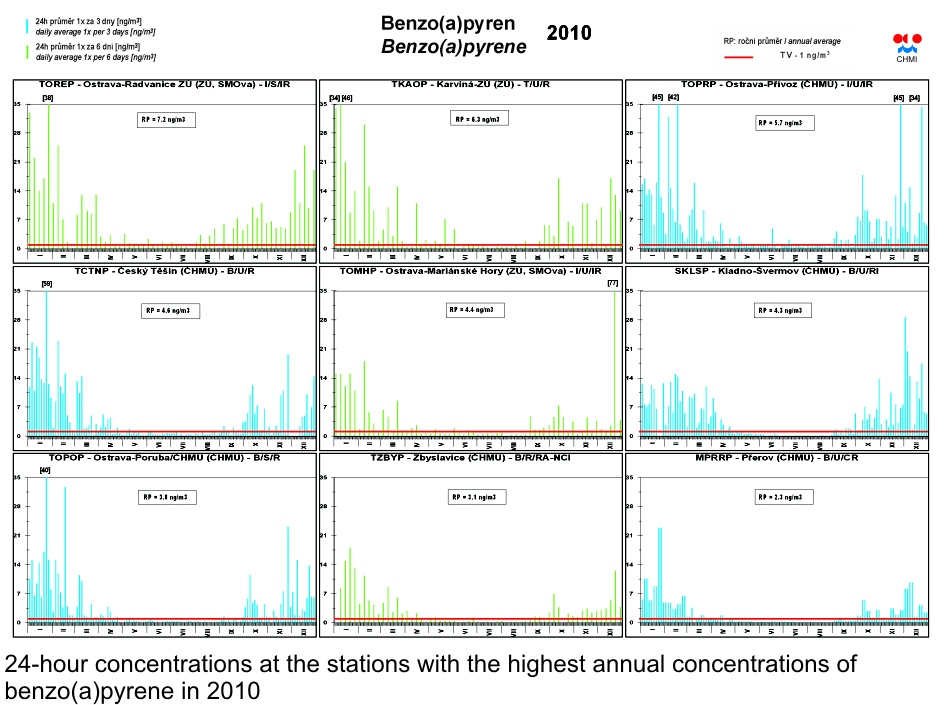
| Fig. II.4.2.44 |
24-hour concentrations at the stations with the highest annual
concentrations of benzo(a)pyrene in 2010 |
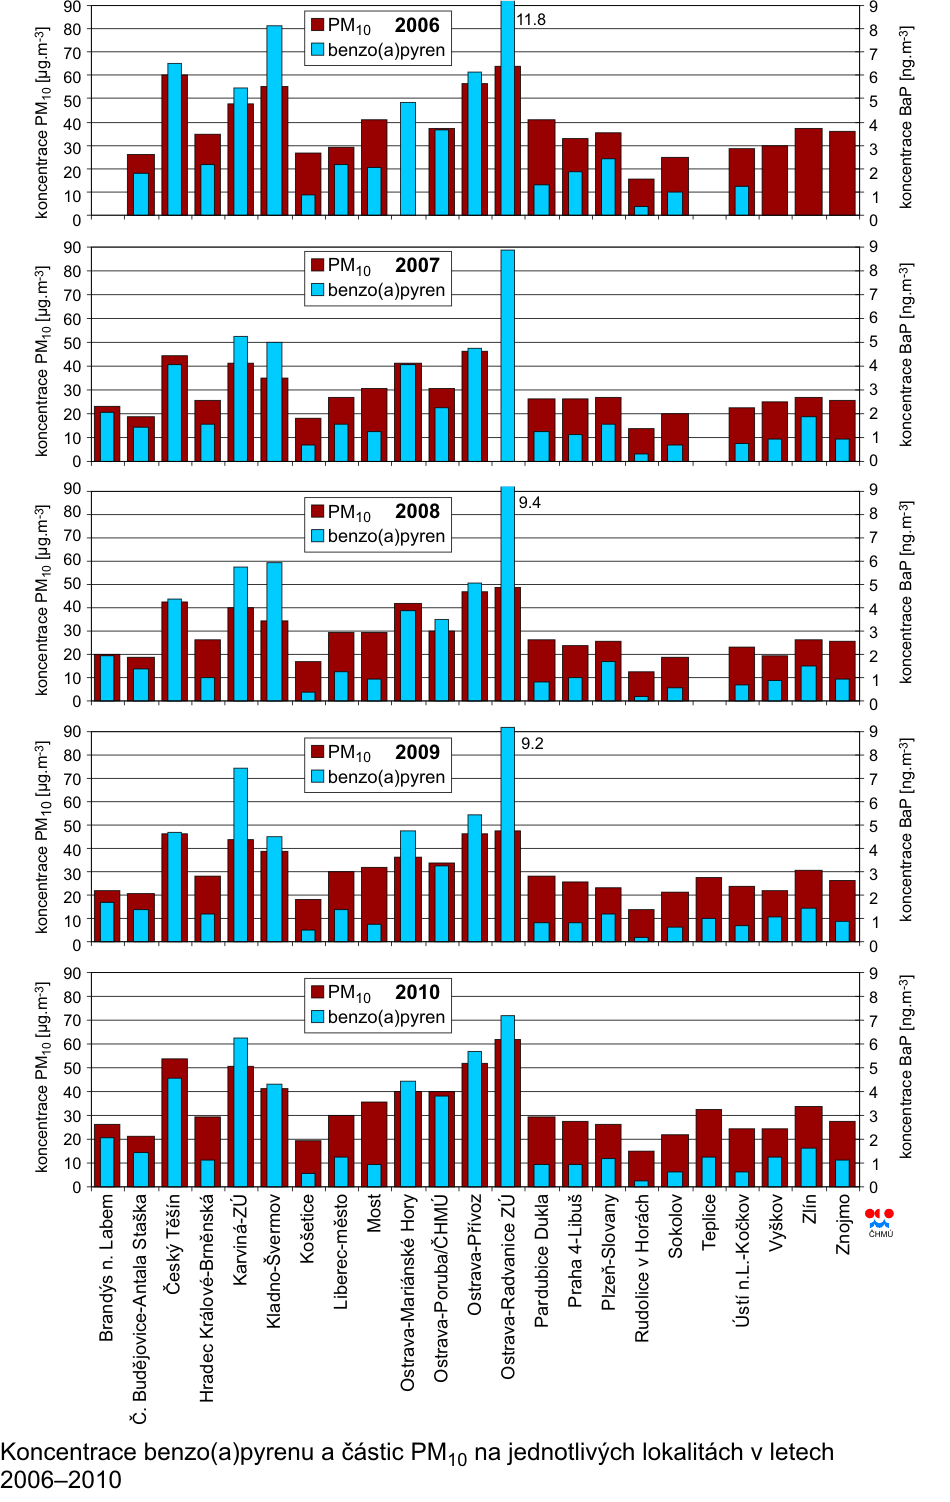
| Fig. II.4.2.45 |
Concentrations of benzo(a)pyrene and PM10 particles in individual
localities, 2006ŌĆō2010 |
| Fig. II.4.2.46 |
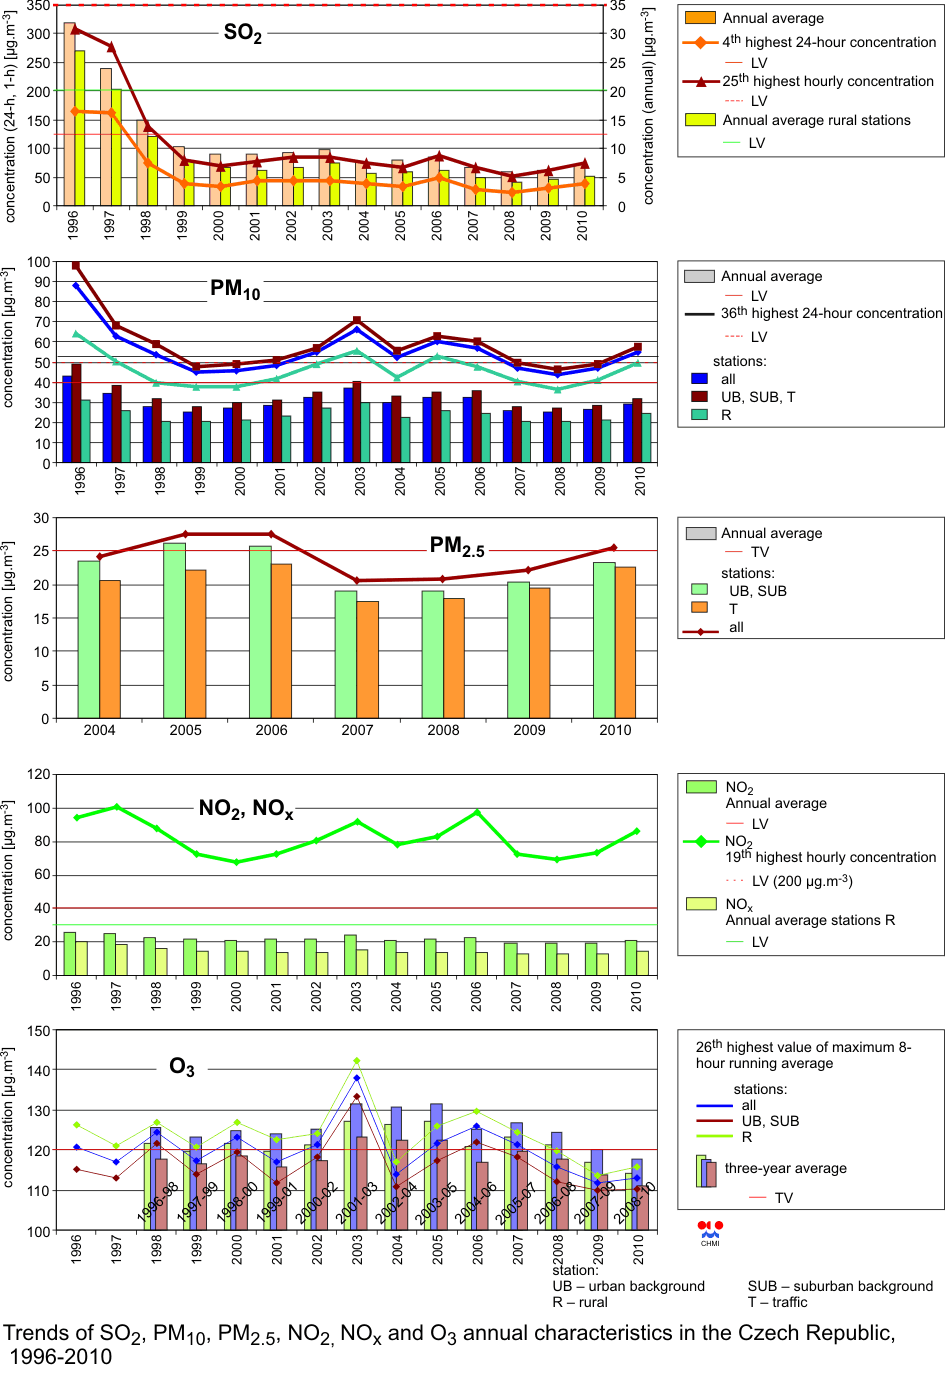
Trends of SO2, PM10, PM2.5, NO2, NOx and O3 annual characteristics
in the Czech Republic, 1996ŌĆō2010 |
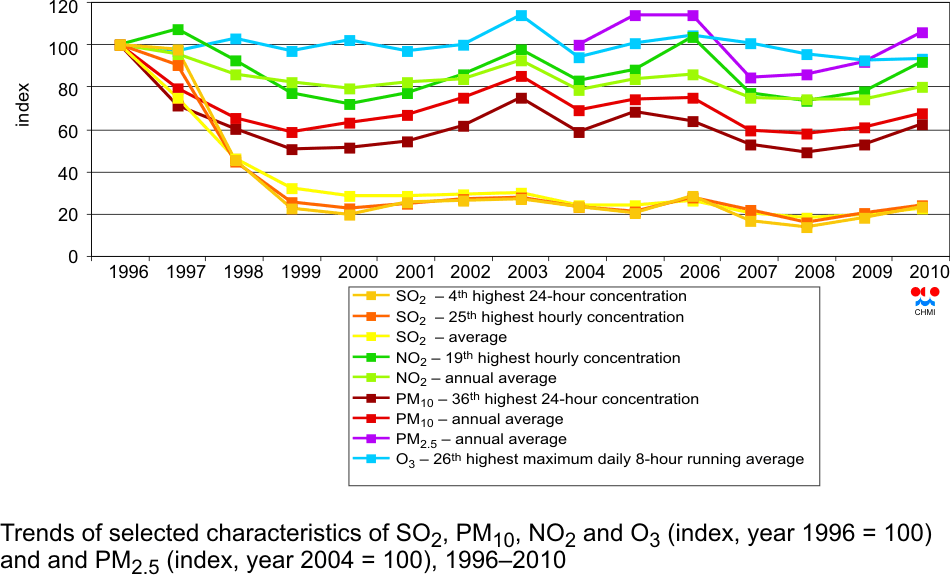
| Fig. II.4.2.47 |
Trends of selected characteristics of SO2, PM10, NO2 and O3 (index,
year 1996 = 100) and and PM2.5 (index, year 2004 = 100), 1996ŌĆō2010 |
| Fig. II.4.2.48 |
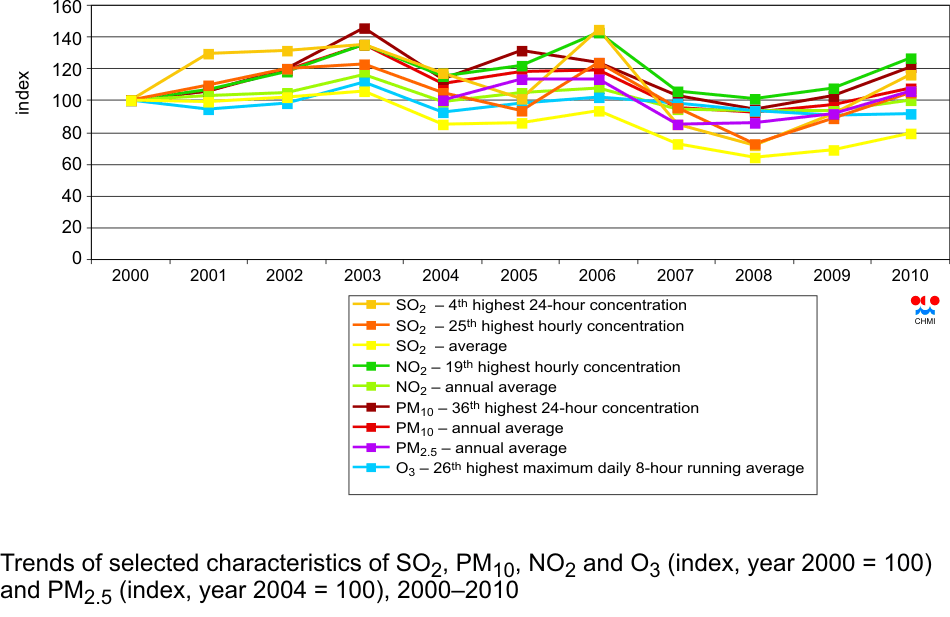
Trends of selected characteristics of SO2, PM10, NO2 and O3 (index,
year 2000 = 100) and PM2.5 (index, year 2004 = 100), 2000ŌĆō2010 |
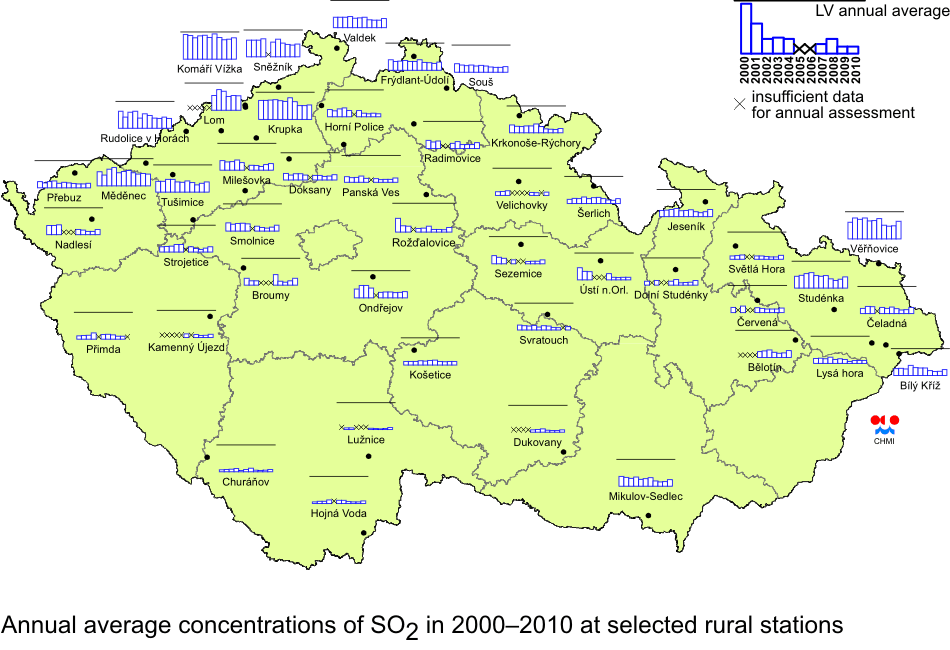
| Fig. II.4.2.49 |
Annual average concentrations of SO2 in 2000ŌĆō2010 at selected rural
stations |
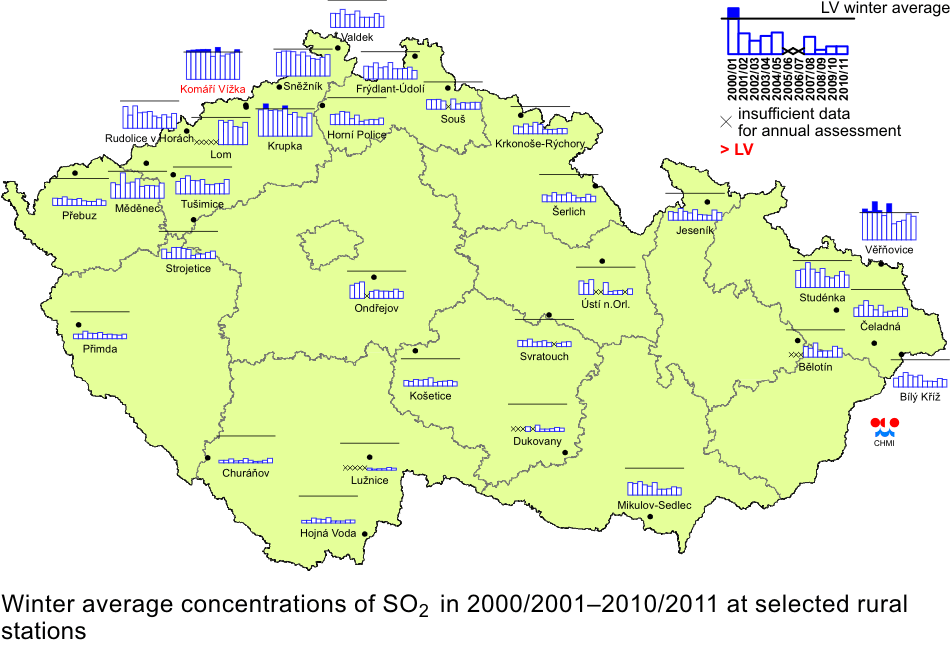
| Fig. II.4.2.50 |
Winter average concentrations of SO2 in 2000/2001ŌĆō2010/2011 at
selected rural stations |
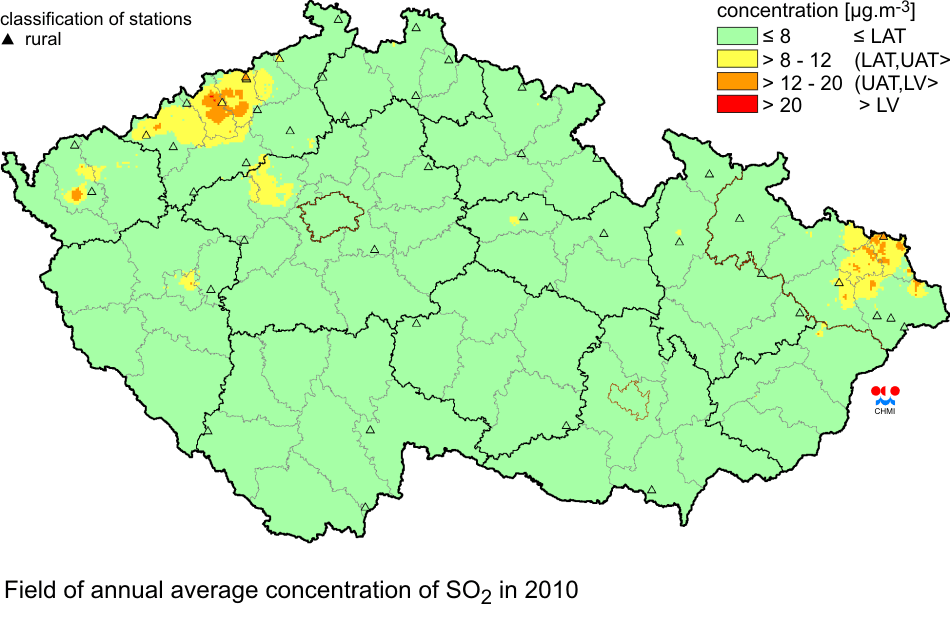
| Fig. II.4.2.51 |
Field of annual average concentration of SO2 in 2010 |
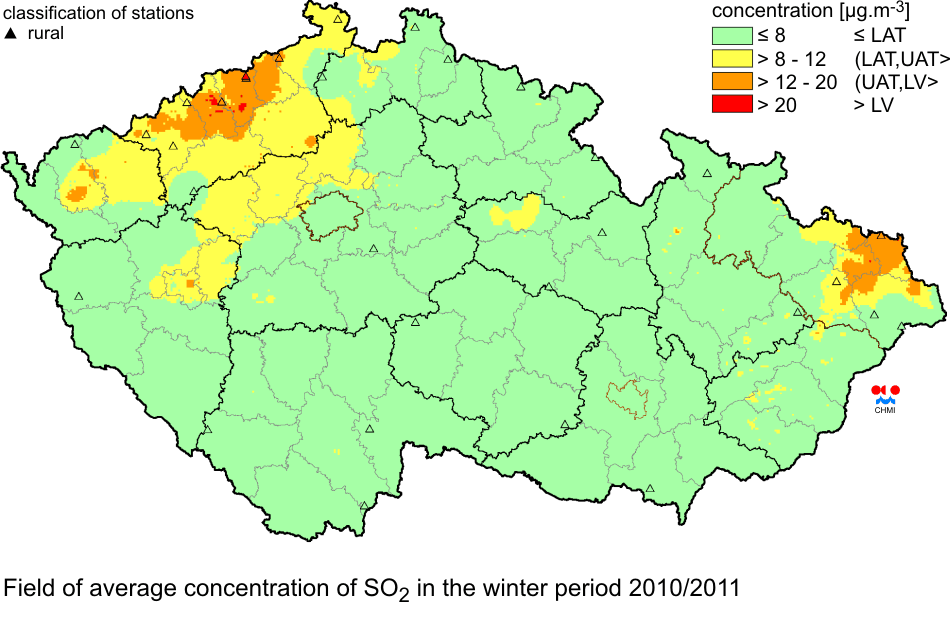
| Fig. II.4.2.52 |
Field of average concentration of SO2 in the winter period 2010/2011 |
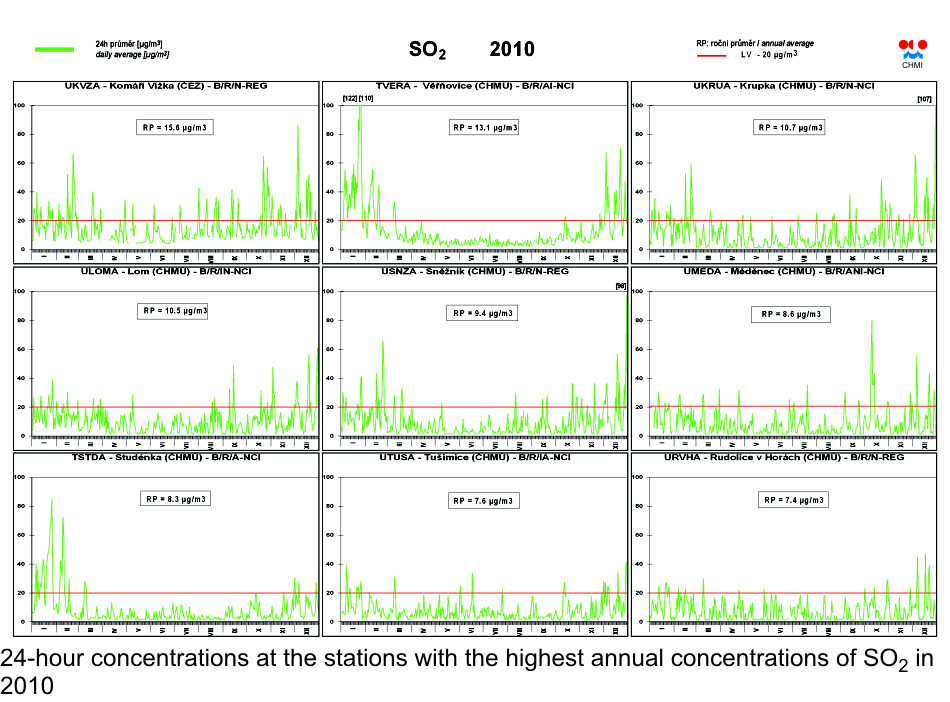
| Fig. II.4.2.53 |
24-hour concentrations at the stations with the highest annual
concentrations of SO2 in 2010 |
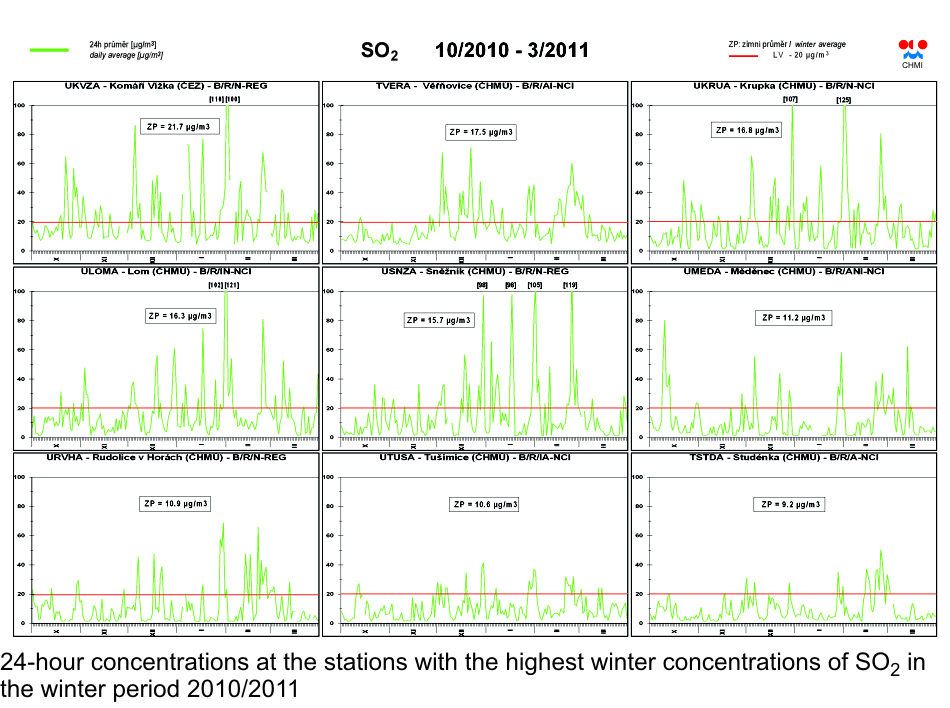
| Fig. II.4.2.54 |
24-hour concentrations at the stations with the highest winter
concentrations of SO2 in the winter period 2010/2011 |
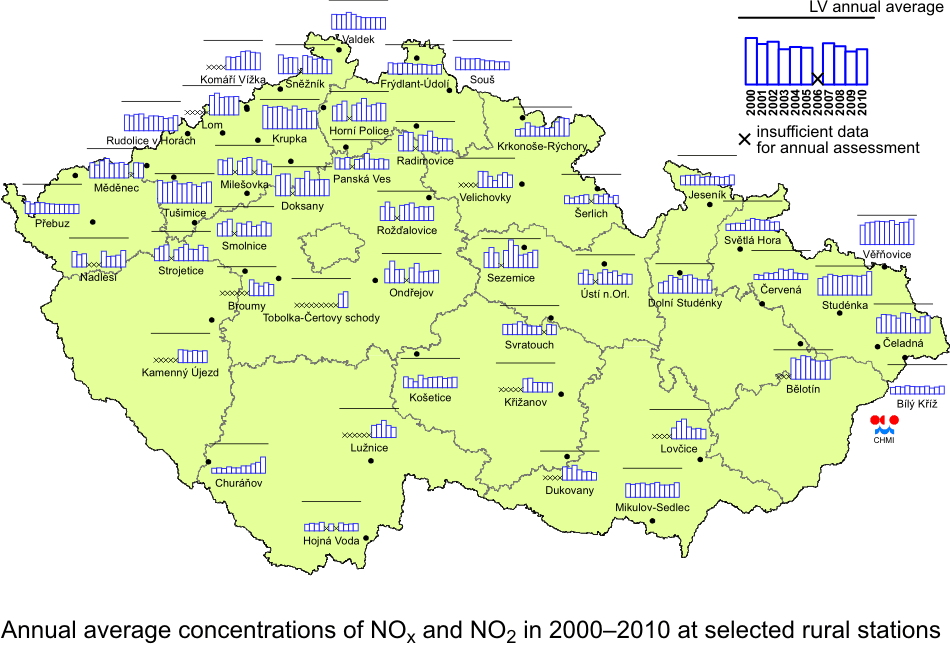
| Fig. II.4.2.55 |
Annual average concentrations of NOx and NO2 in 2000ŌĆō2010 at
selected rural stations |
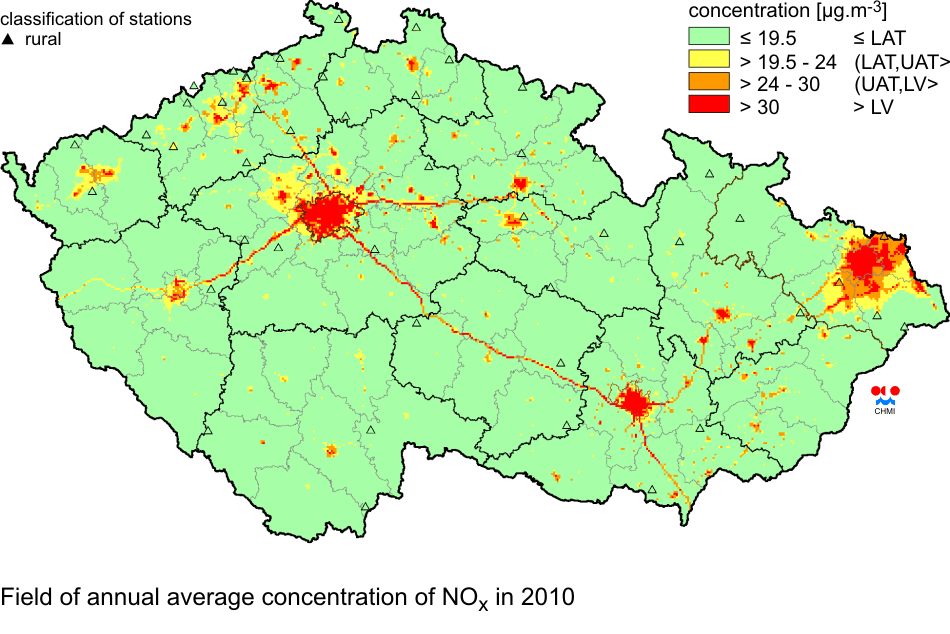
| Fig. II.4.2.56 |
Field of annual average concentration of NOx in 2010 |
| Fig. II.4.2.57 |
24-hour concentrations at the stations with the highest annual
concentrations of NOx in 2010 |
| Fig. II.4.2.58 |
Annual exposure index AOT40 values of ozone in 2000ŌĆō2010 at selected
stations, average for 5 years |
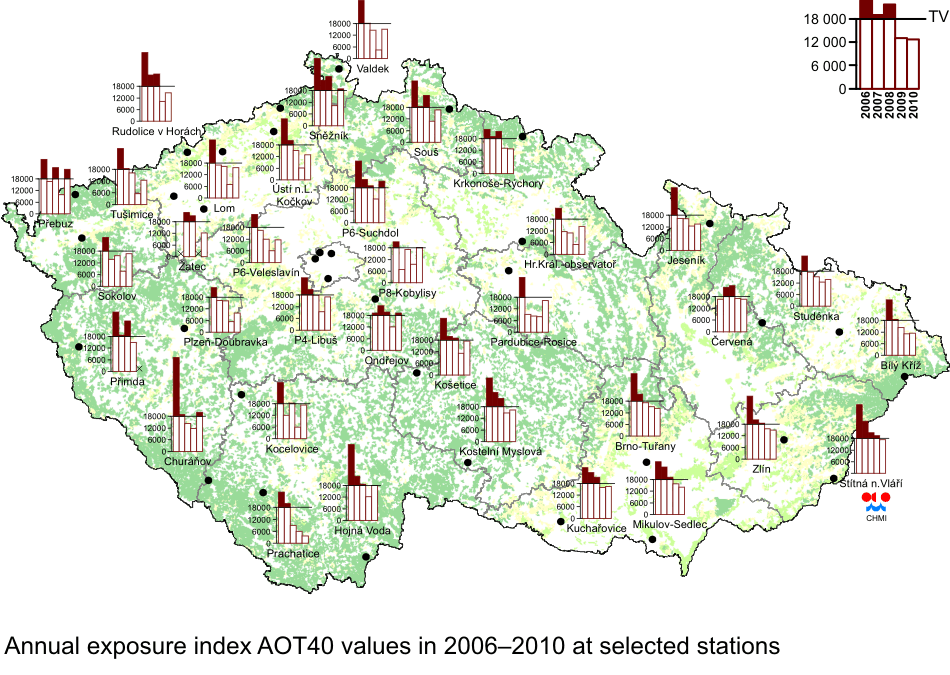
| Fig. II.4.2.59 |
Annual exposure index AOT40 values in 2006ŌĆō2010 at selected stations |
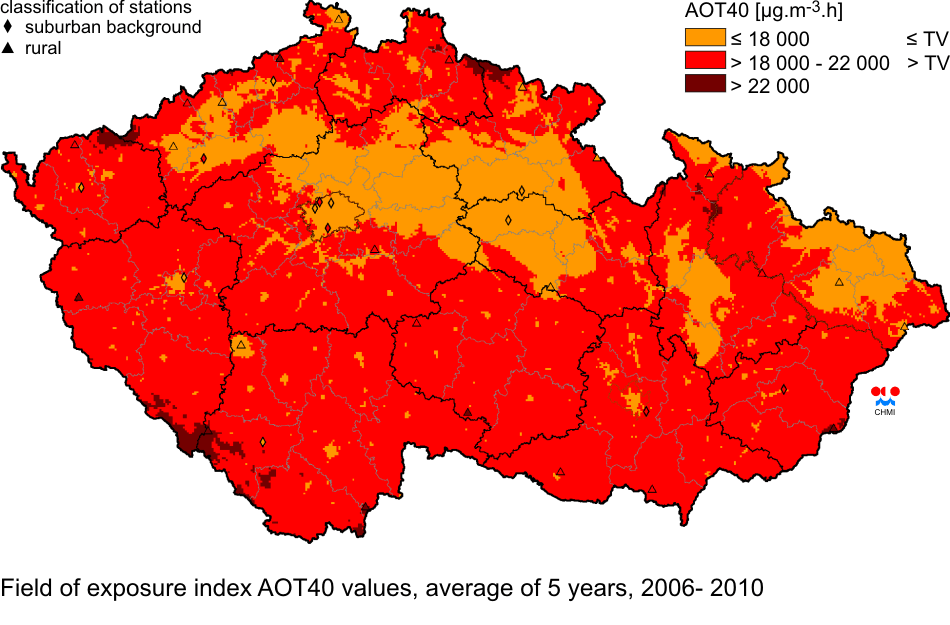
| Fig. II.4.2.60 |
Field of exposure index AOT40 values, average for 5 years, 2006ŌĆō2010 |
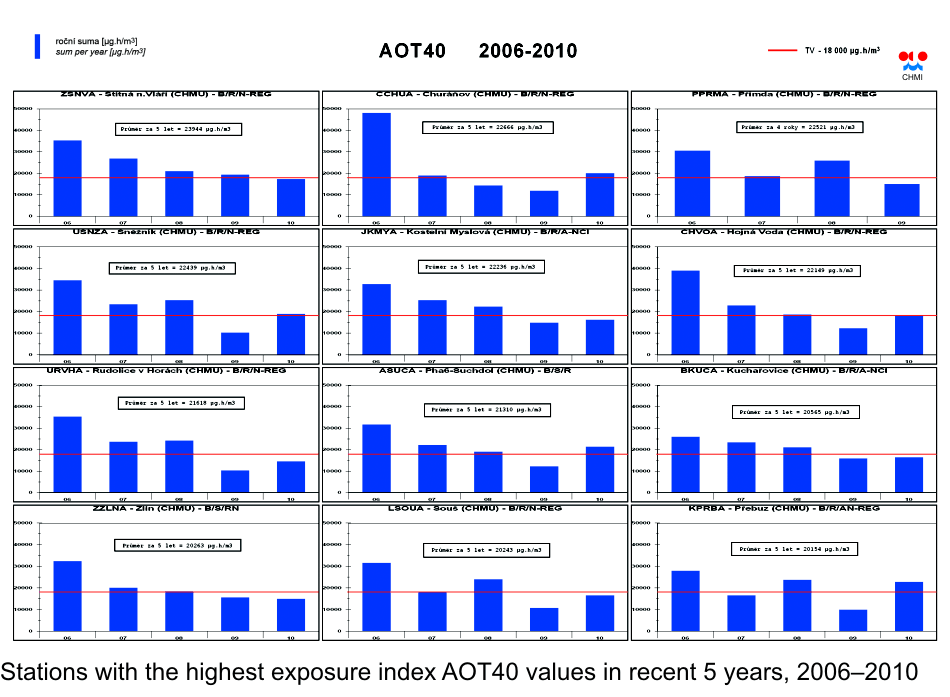
| Fig. II.4.2.61 |
Stations with the highest exposure index AOT40 values in recent 5
years, 2006ŌĆō2010 |
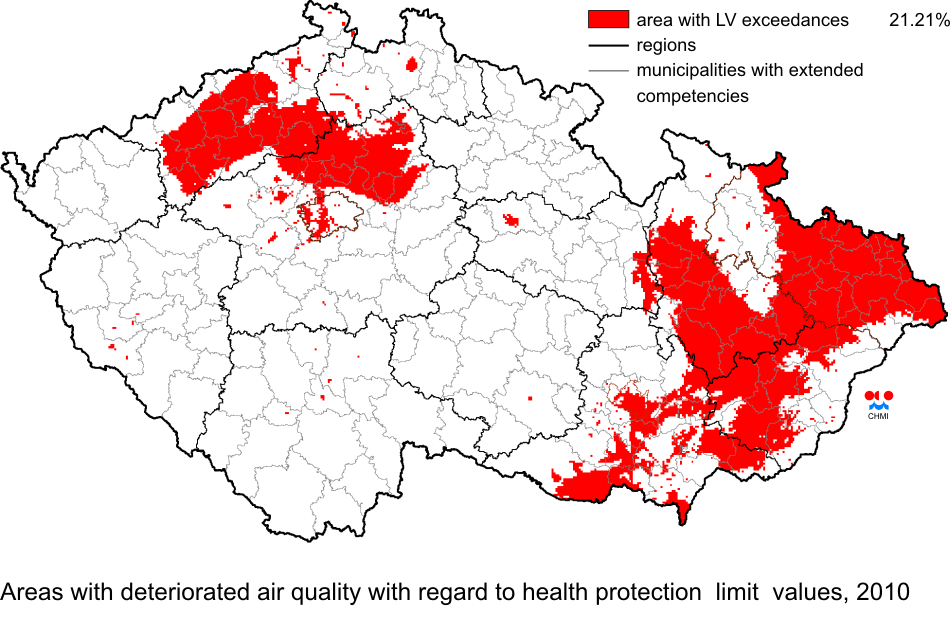
| Fig. II.4.3.1 |
Areas with deteriorated air quality with regard to health protection
limit values, 2010 |
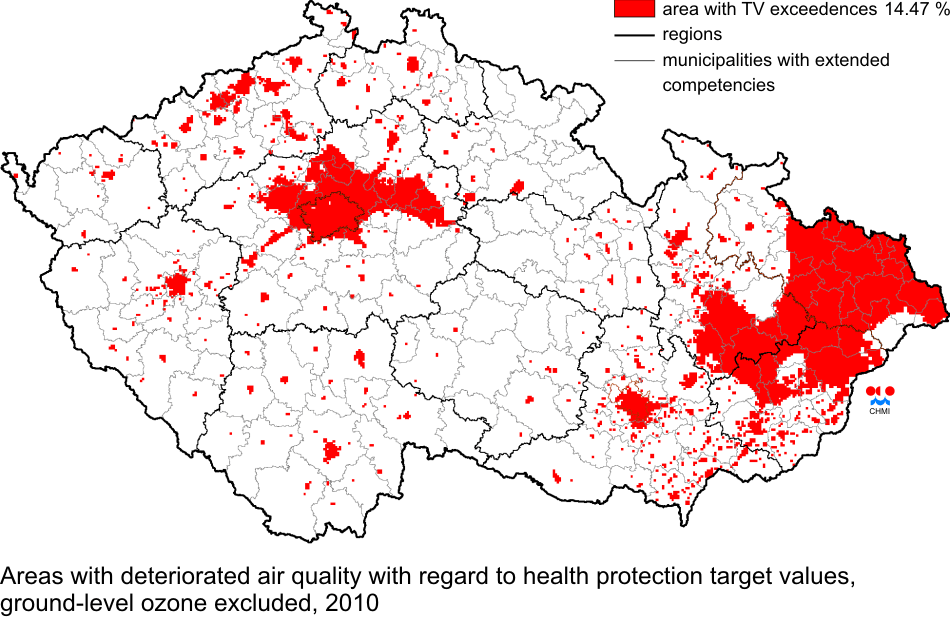
| Fig. II.4.3.2 |
Areas with deteriorated air quality with regard to health protection
target values, ground-level ozone excluded, 2010 |
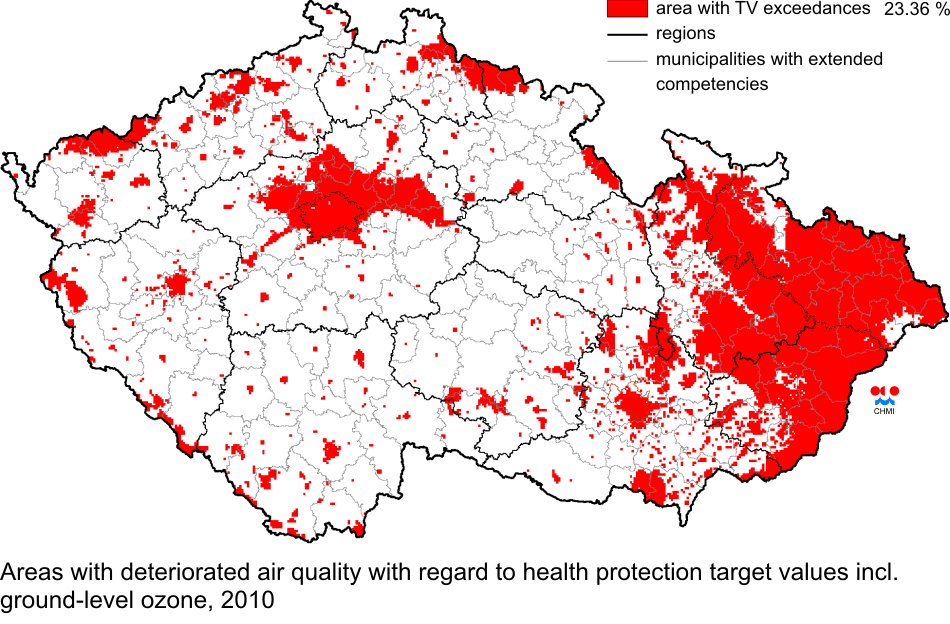
| Fig. II.4.3.3 |
Areas with deteriorated air quality with regard to health protection
target values, incl. ground-level ozone, 2010 |
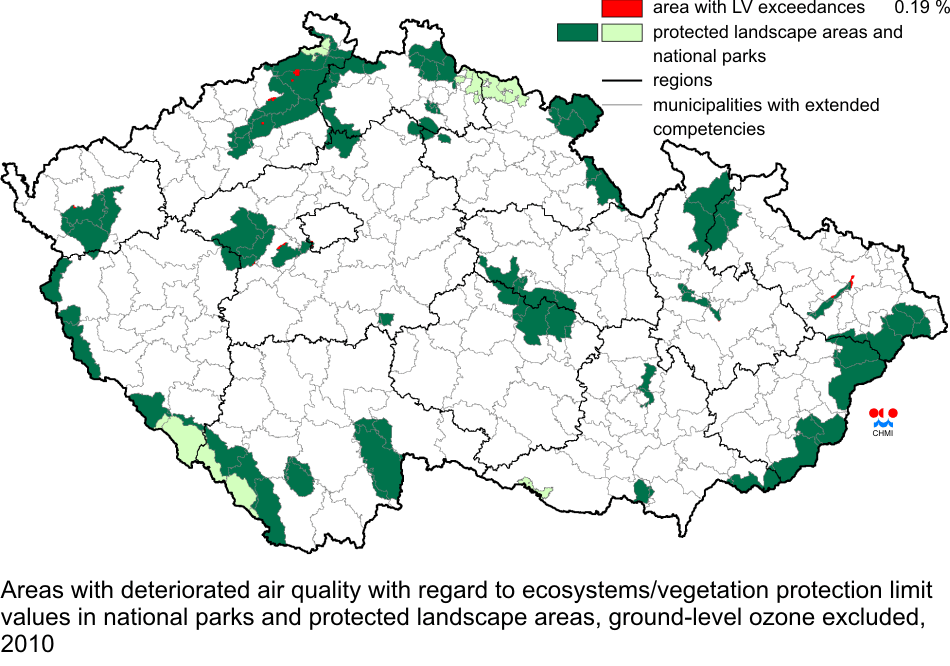
| Fig. II.4.3.4 |
Areas with deteriorated air quality with regard to ecosystems/vegetation
protection limit values in national parks and protected landscape areas,
ground-level ozone excluded, 2010 |
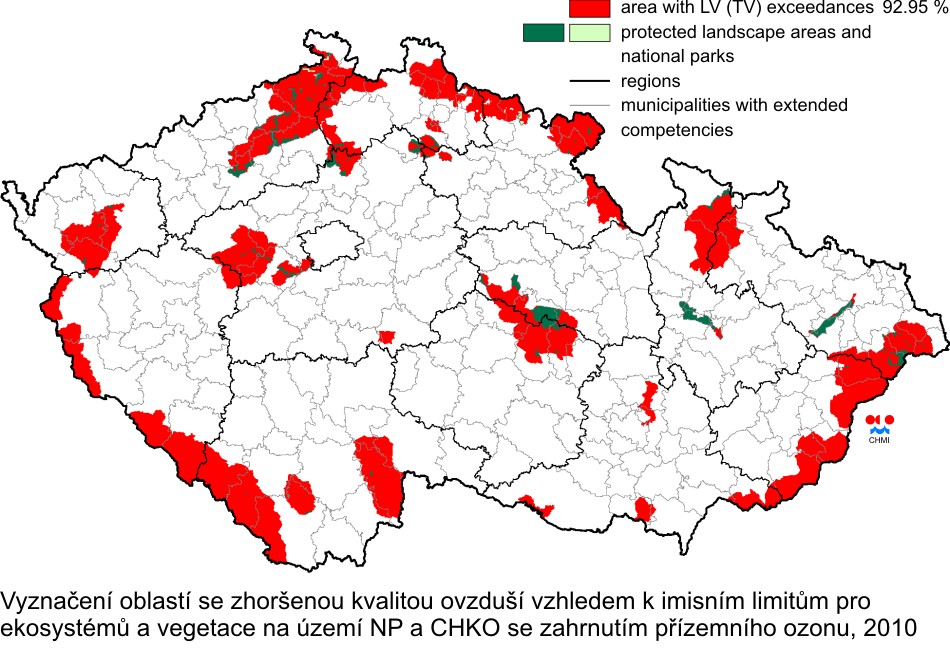
| Fig. II.4.3.5 |
Areas with deteriorated air quality with regard to ecosystems/vegetation
protection limit values in national parks and protected landscape areas,
including ground-level ozone, 2010 |
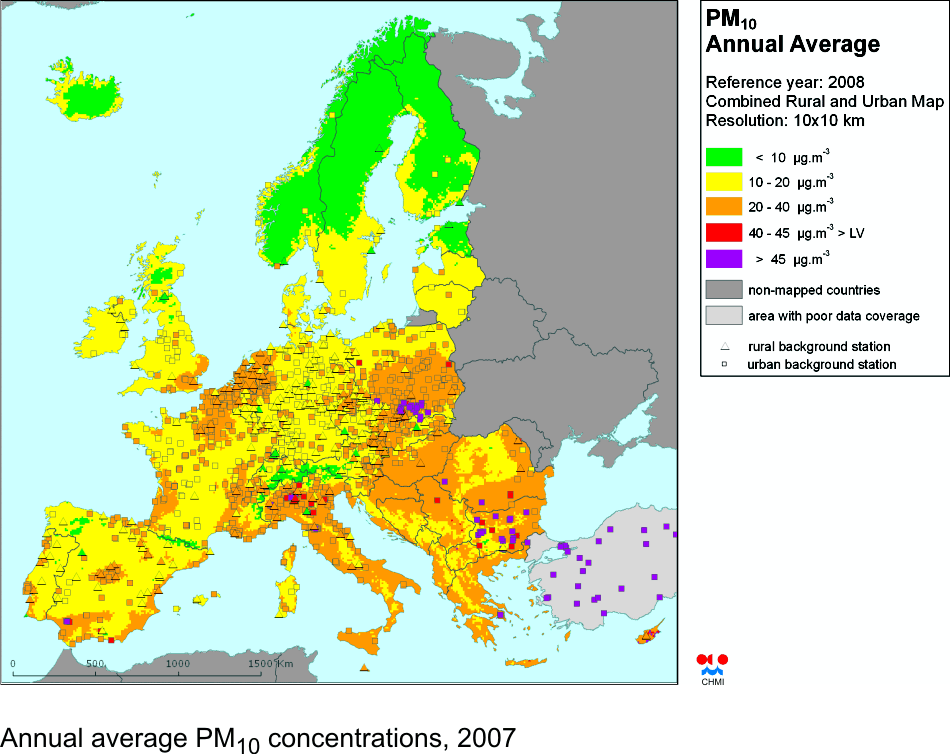
| Fig. II.4.4.1 |
Annual average PM10 concentrations, 2008 |
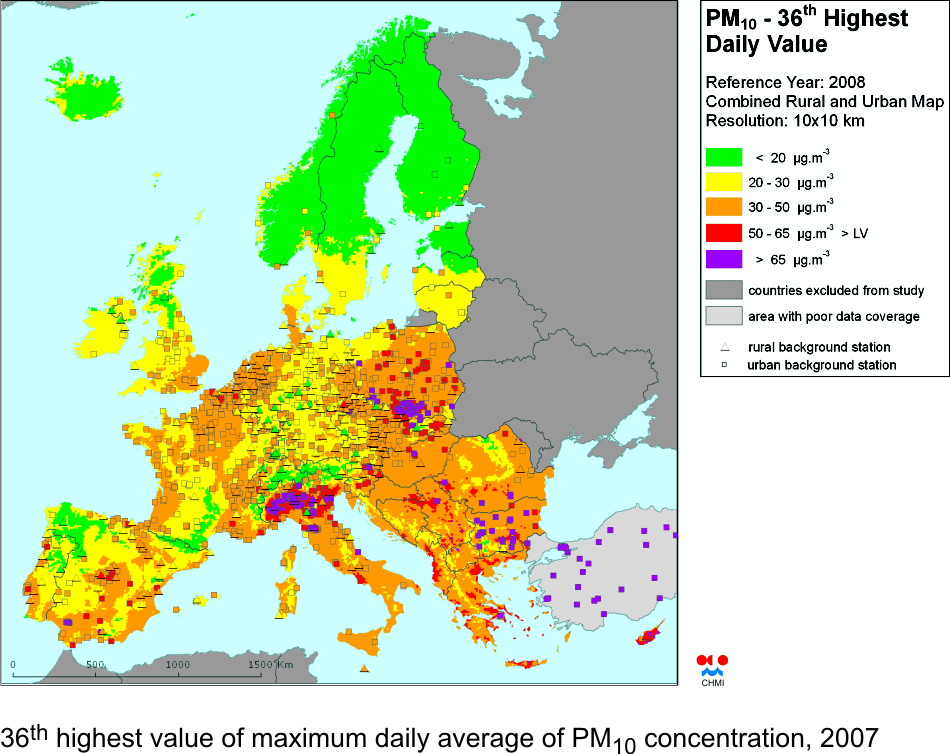
| Fig. II.4.4.2 |
36th highest value of maximum daily average of PM10 concentration,
2008 |
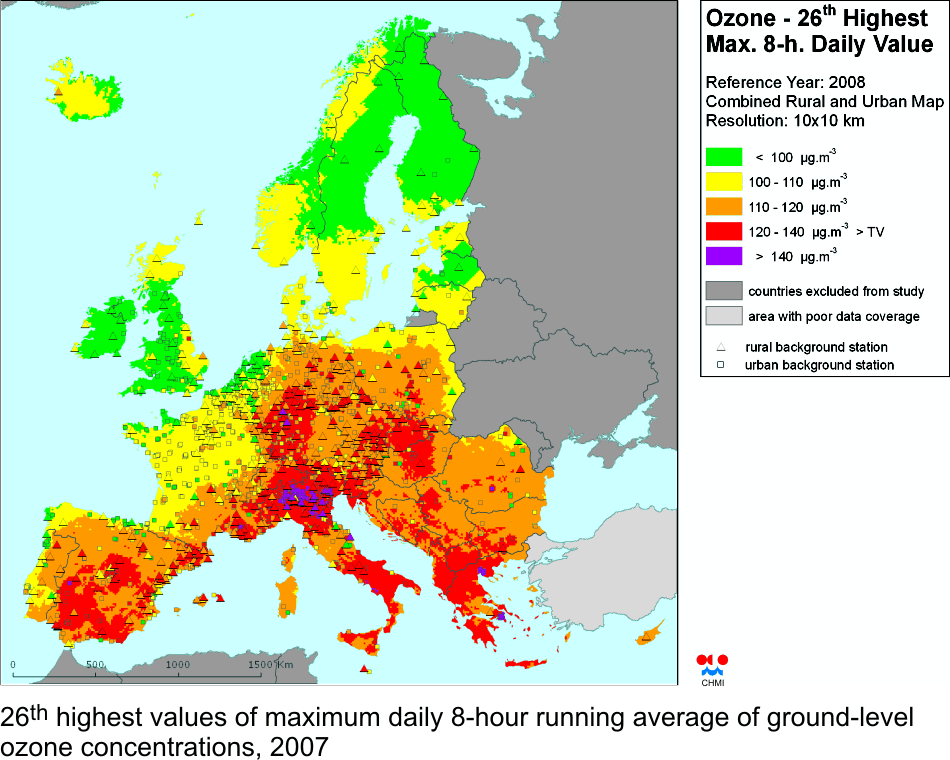
| Fig. II.4.4.3 |
26th highest value of maximum daily 8-hour running average of ground-level
ozone concentrations, 2008 |
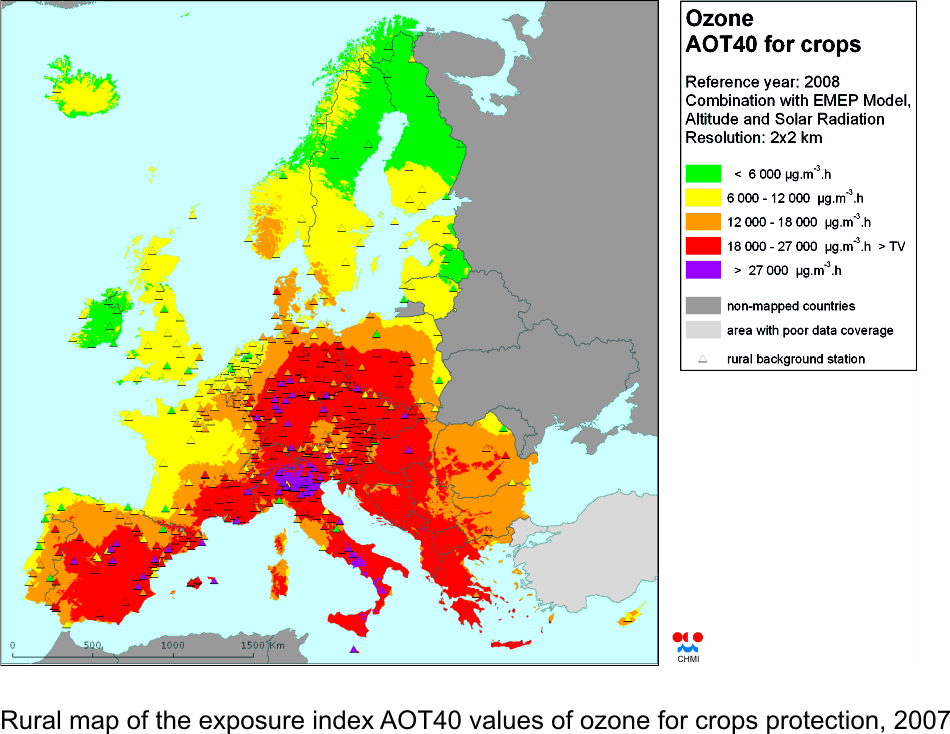
| Fig. II.4.4.4 |
Rural map of the exposure index AOT40 values of ozone for crops
protection, 2008 |
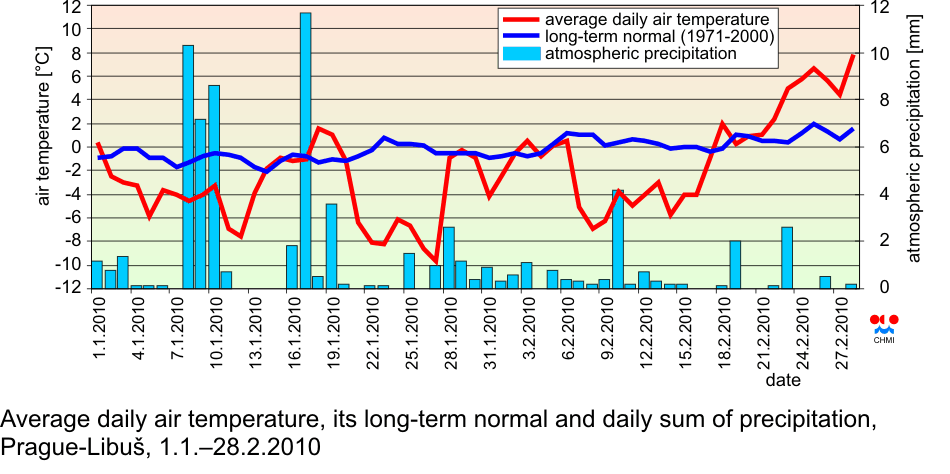
| Fig. II.5.1 |
Average daily air temperature, its long-term normal and daily sum of
precipitation, Prague-Libu┼Ī, 1.1.ŌĆō28.2.2010 |
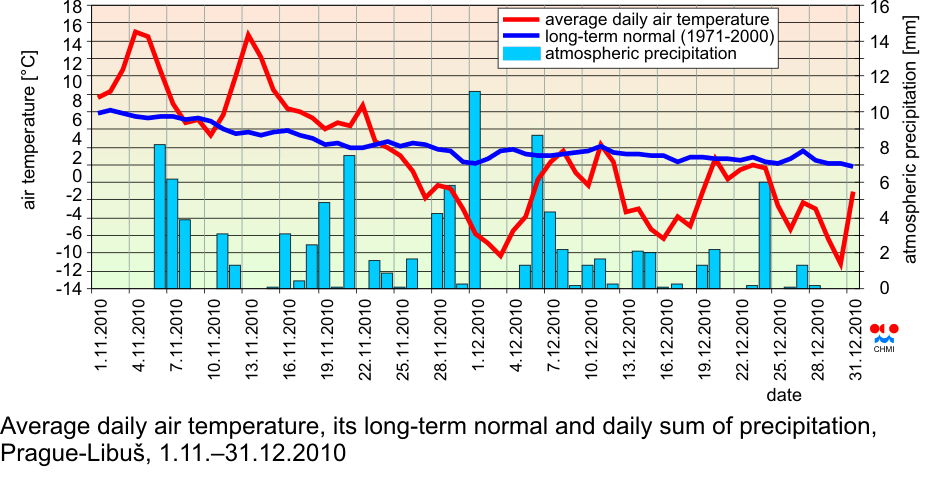
| Fig. II.5.2 |
Average daily air temperature, its long-term normal and daily sum of
precipitation, Prague-Libu┼Ī, 1.11.ŌĆō31.12.2010 |
| Fig. II.5.3 |
Average hourly NO2 concentrations at the station Prague 2-Legerova,
1.1.ŌĆō28.2.2010 |
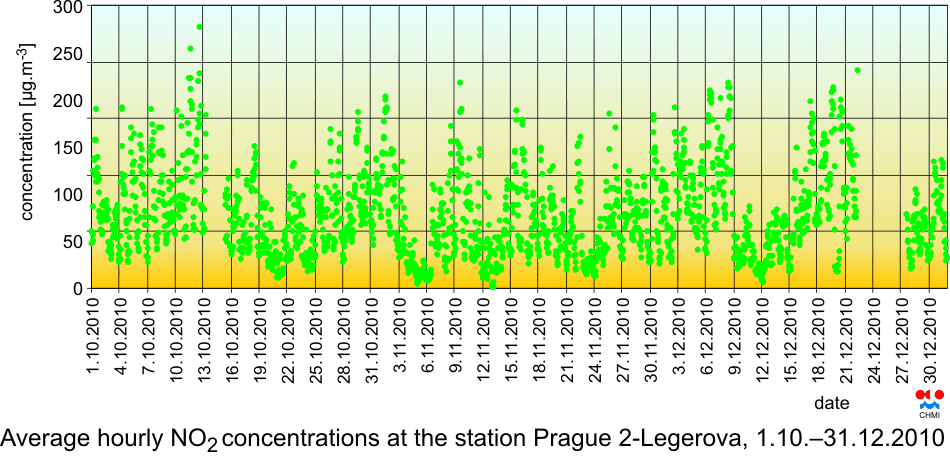
| Fig. II.5.4 |
Average hourly NO2 concentrations at the station Prague 2-Legerova,
1.10.ŌĆō31.12.2010 |
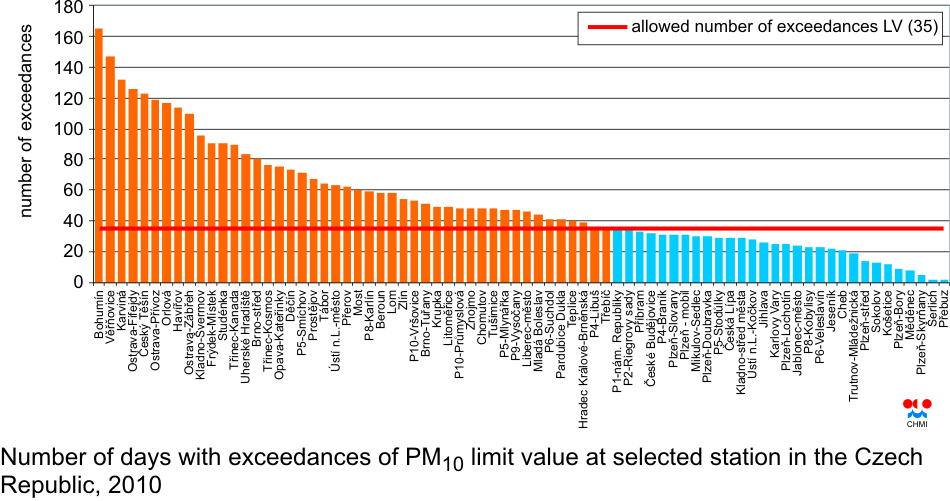
| Fig. II.5.5 |
Number of days with exceedances of PM10 limit value at selected
station in the Czech Republic, 2010 |
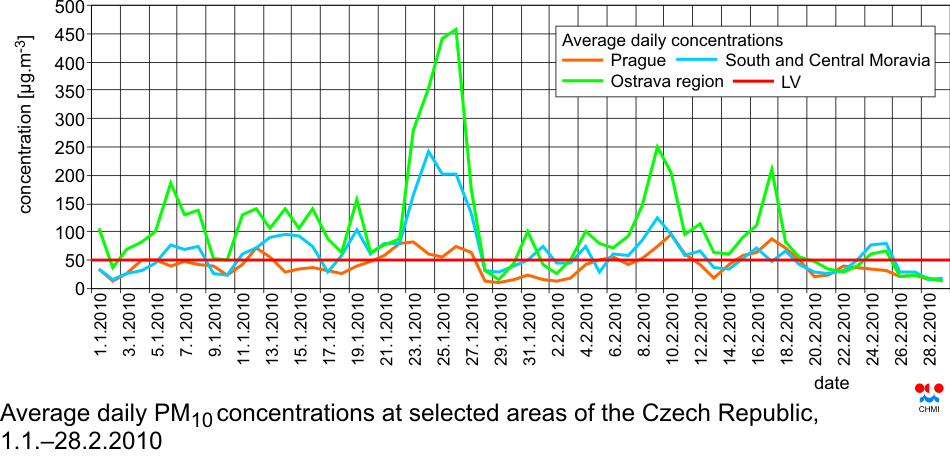
| Fig. II.5.6 |
Average daily PM10 concentrations at selected areas of the Czech
Republic, 1.1.ŌĆō28.2.2010 |
| Fig. II.5.7 |
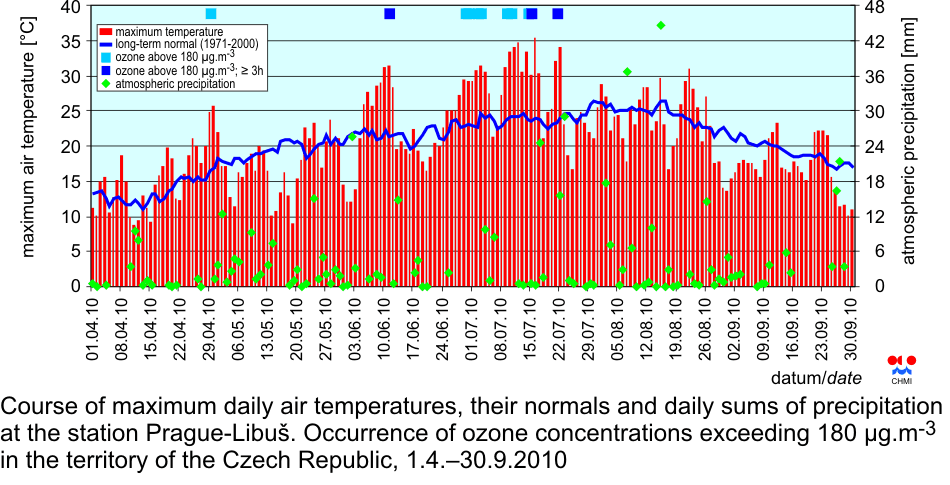
Course of maximum daily air temperatures, their normals and daily
sums of precipitation at the station Prague-Libu┼Ī. Occurrence of ozone
concentrations exceeding 180 ╬╝g.m-3 in the territory of the Czech
Republic, 1.4.ŌĆō30.9.2010 |
| Fig. II.5.8 |
Maximum daily concentration of ground-level ozone at selected
stations, 1.6.ŌĆō31.7.2010 |
| Fig. III.1 |
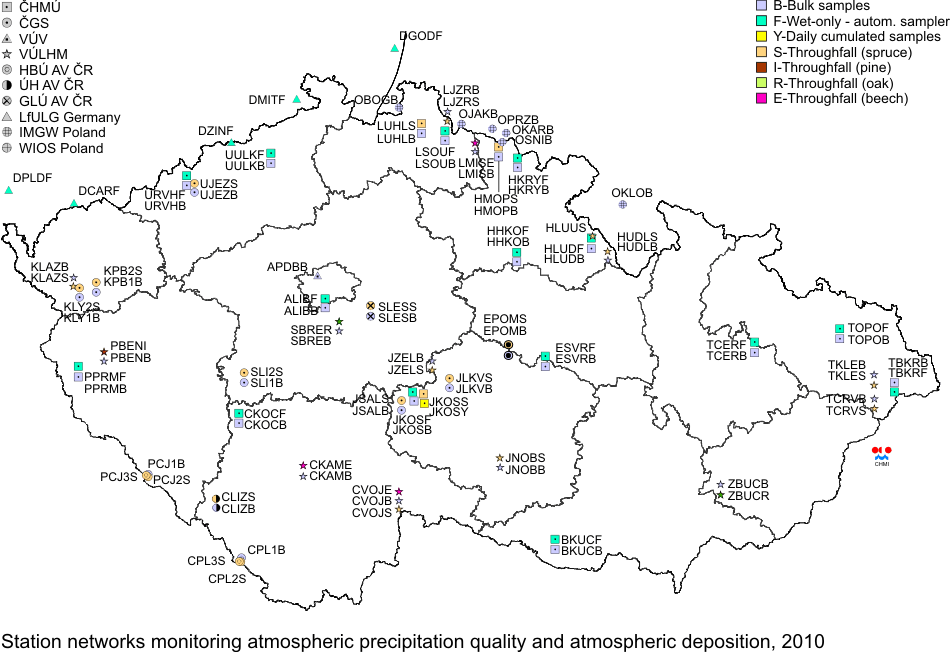
Station networks monitoring atmospheric precipitation quality and
atmospheric deposition, 2010 |
| Fig. III.2 |
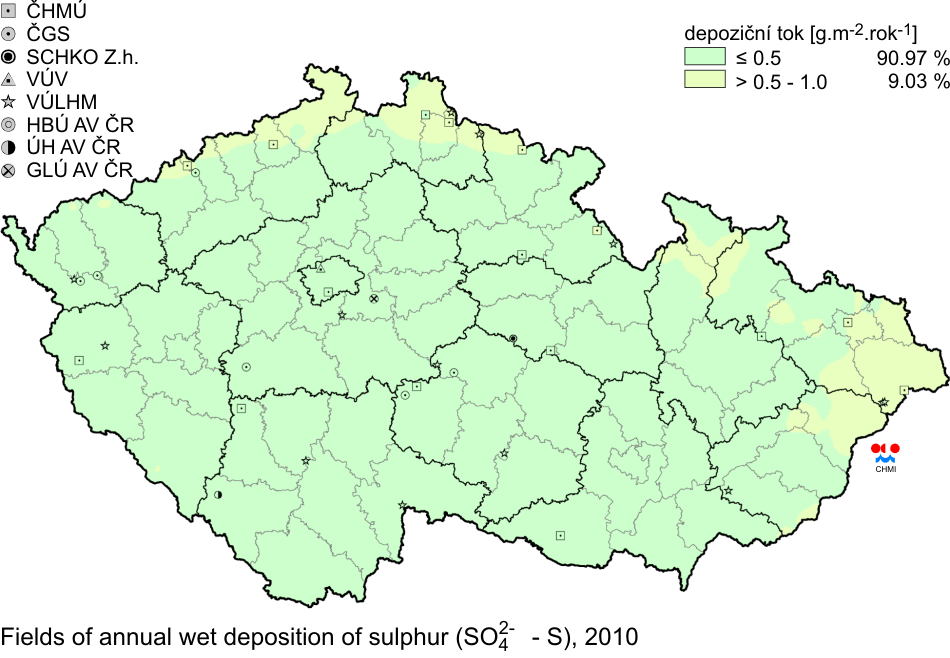
Fields of annual wet deposition of sulphur (SO42- - S), 2010 |
| Fig. III.3 |
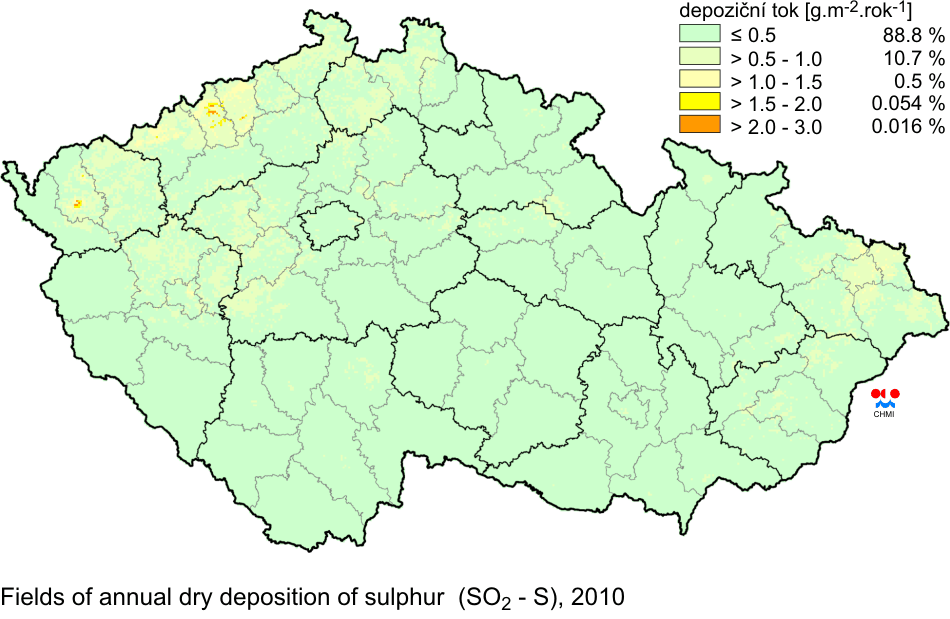
Fields of annual dry deposition of sulphur (SO2 - S), 2010 |
| Fig. III.4 |
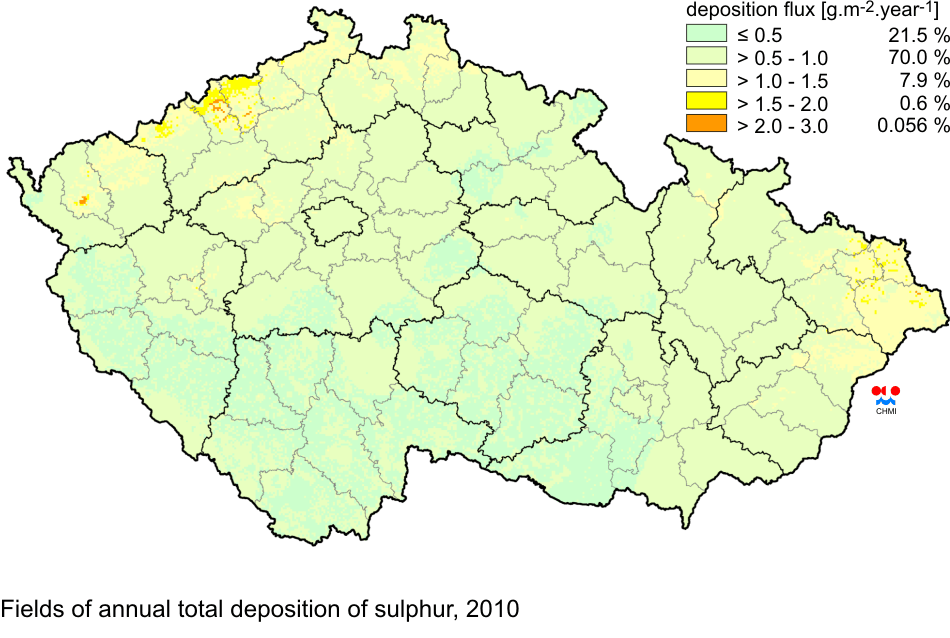
Fields of annual total deposition of sulphur, 2010 |
| Fig. III.5 |
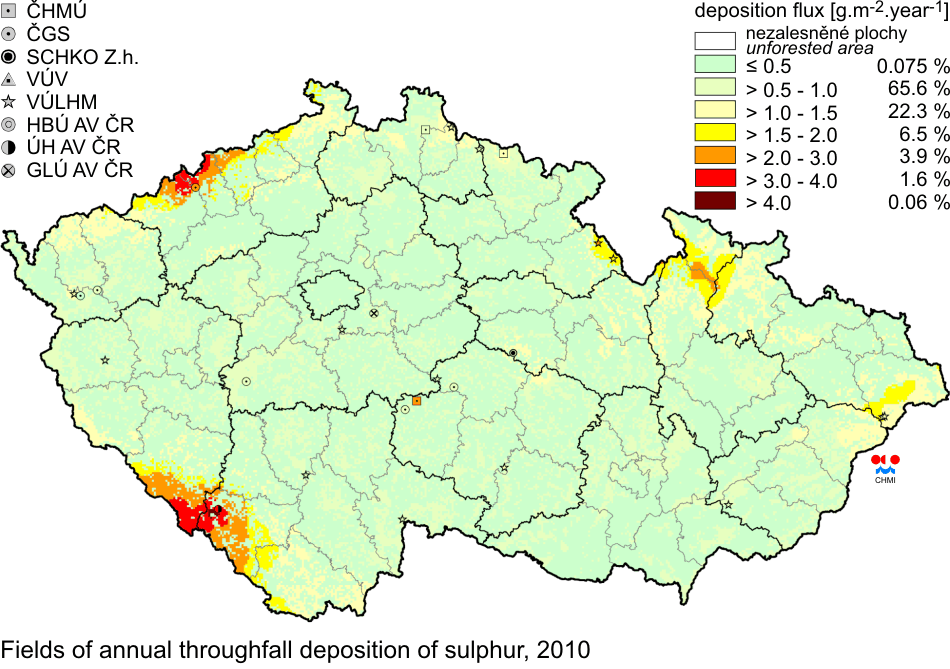
Fields of annual throughfall deposition of sulphur, 2010 |
| Fig. III.6 |
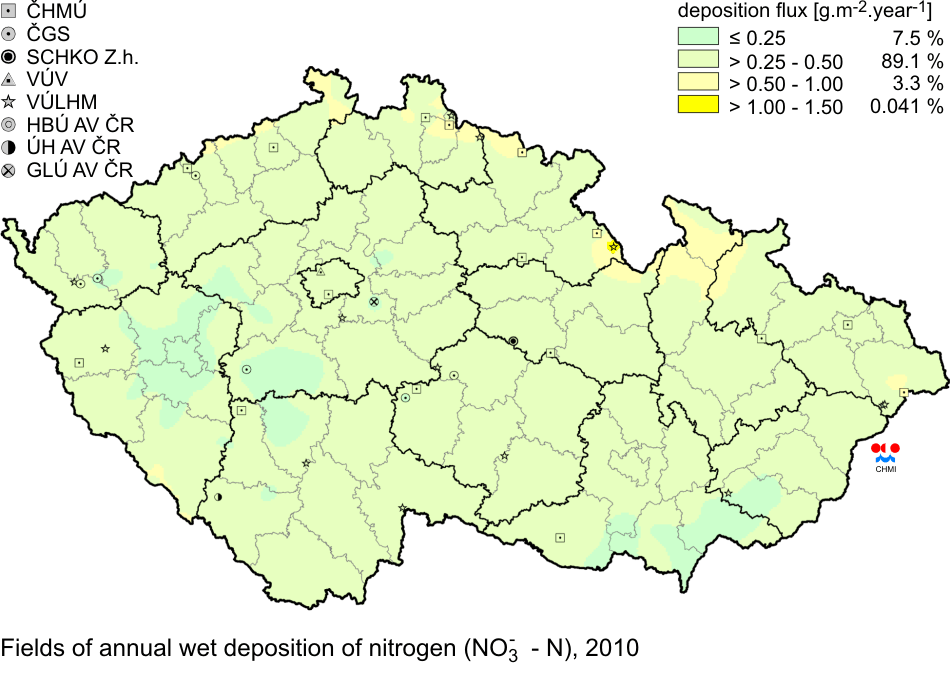
Fields of annual wet deposition of nitrogen (NO3- - N), 2010 |
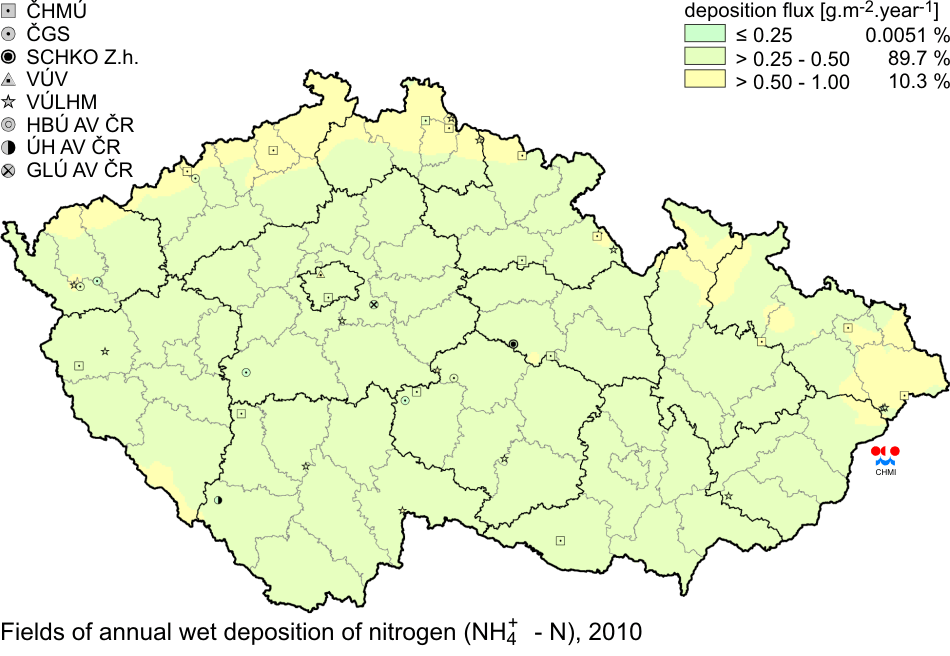
| Fig. III.7 |
Fields of annual wet deposition of nitrogen (NH4+ - N), 2010 |
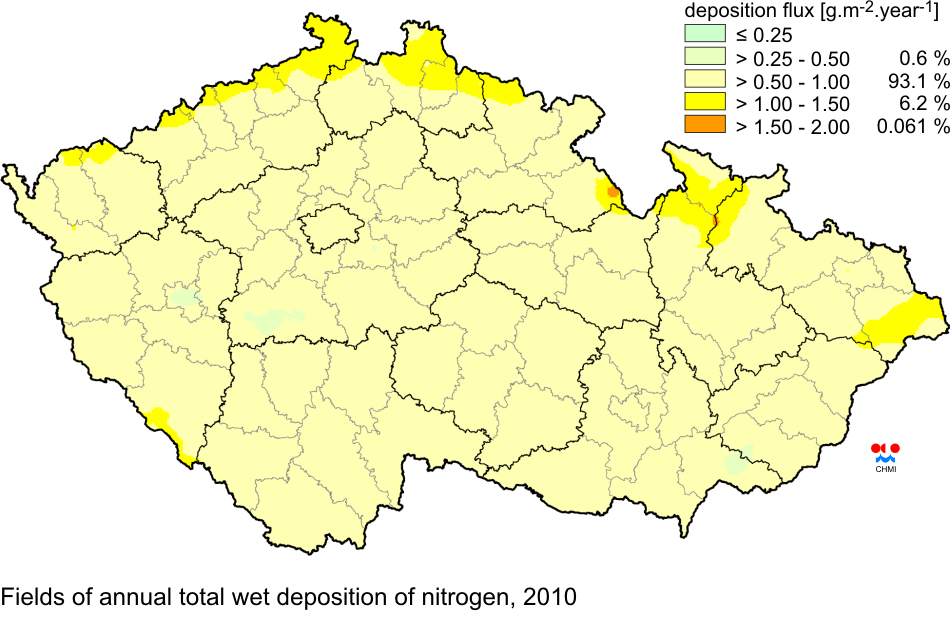
| Fig. III.8 |
Fields of annual total wet deposition of nitrogen, 2010 |
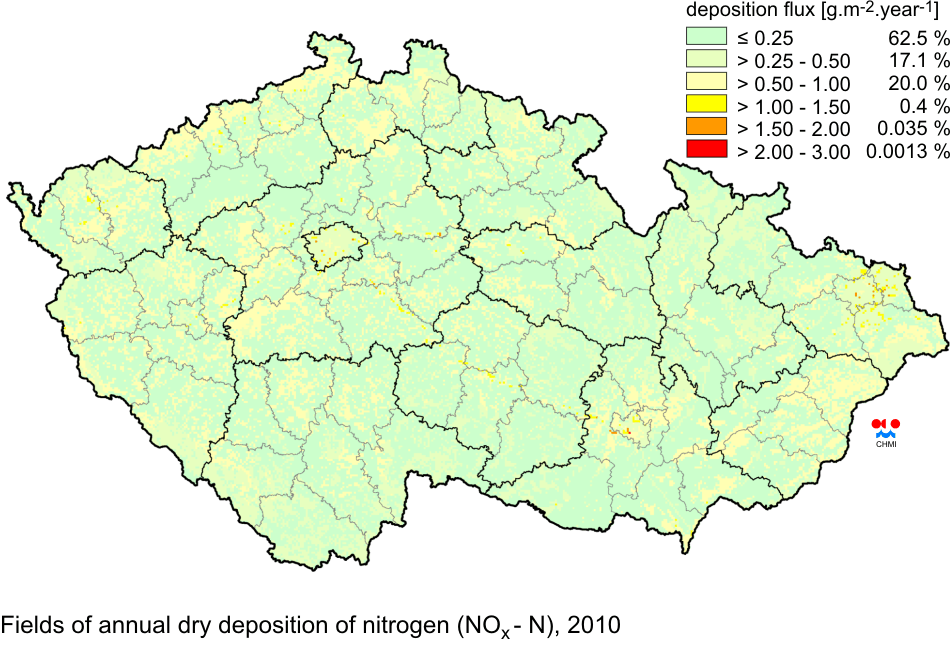
| Fig. III.9 |
Fields of annual dry deposition of nitrogen (NOx - N), 2010 |
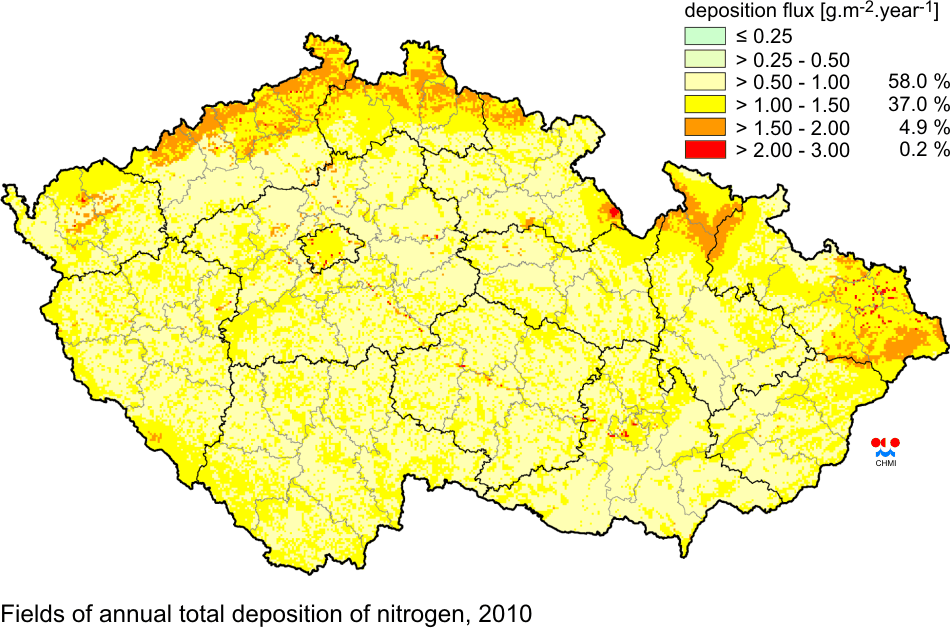
| Fig. III.10 |
Fields of annual total deposition of nitrogen, 2010 |
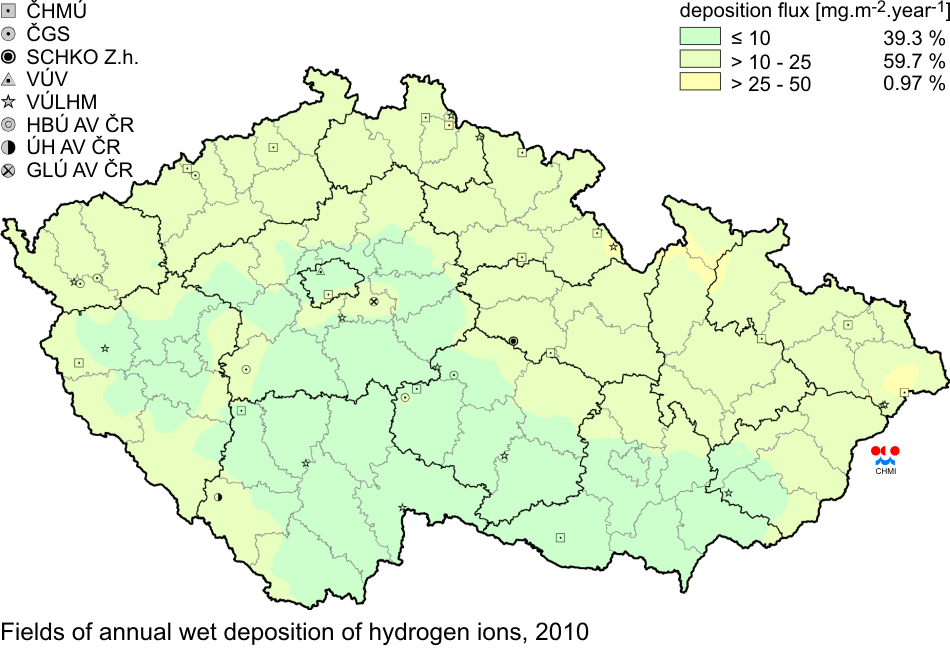
| Fig. III.11 |
Fields of annual wet deposition of hydrogen ions, 2010 |
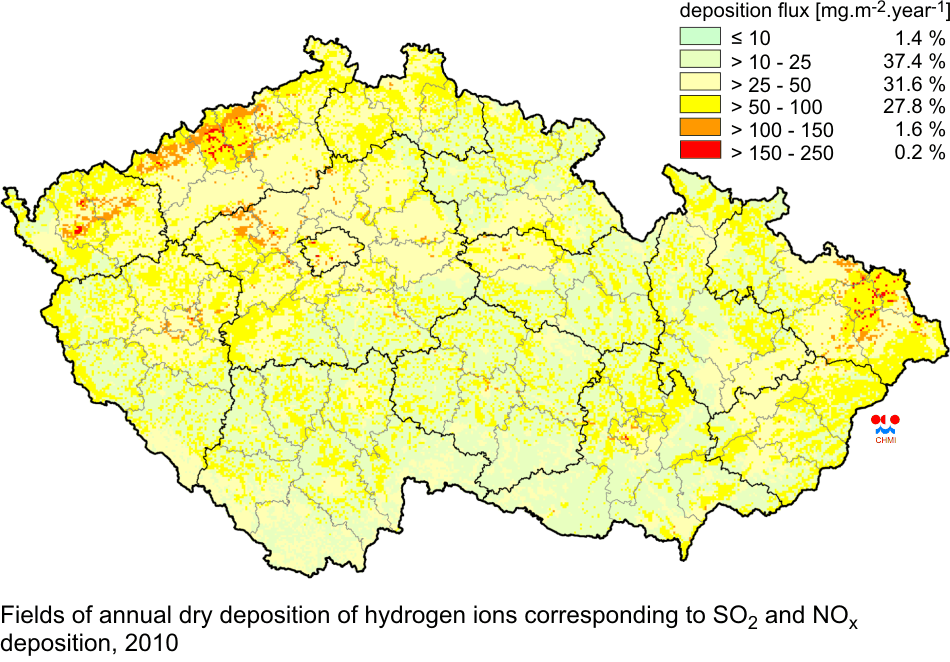
| Fig. III.12 |
Fields of annual dry deposition of hydrogen ions corresponding to
SO2 and NOx deposition, 2010 |
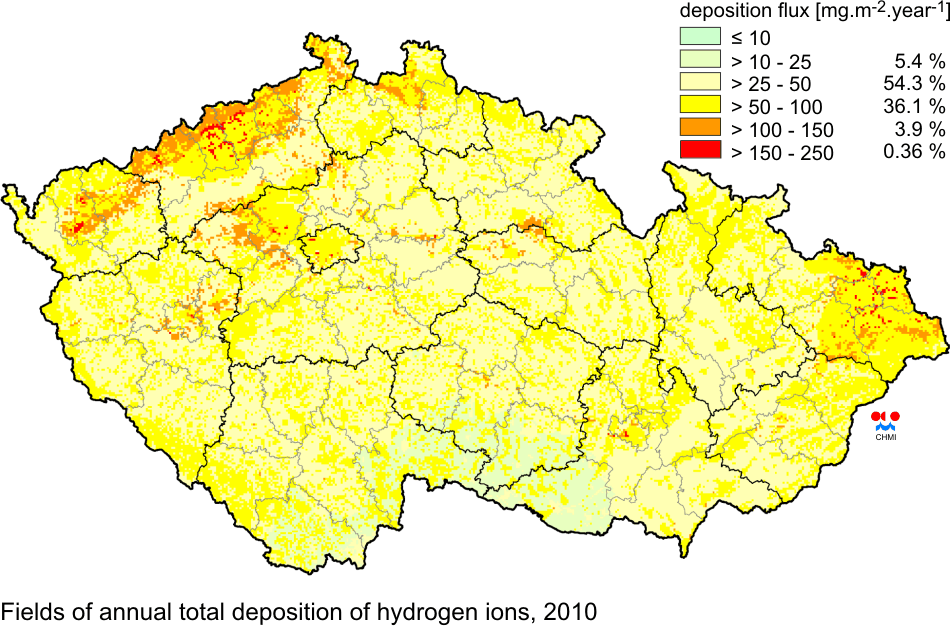
| Fig. III.13 |
Fields of annual total deposition of hydrogen ions, 2010 |
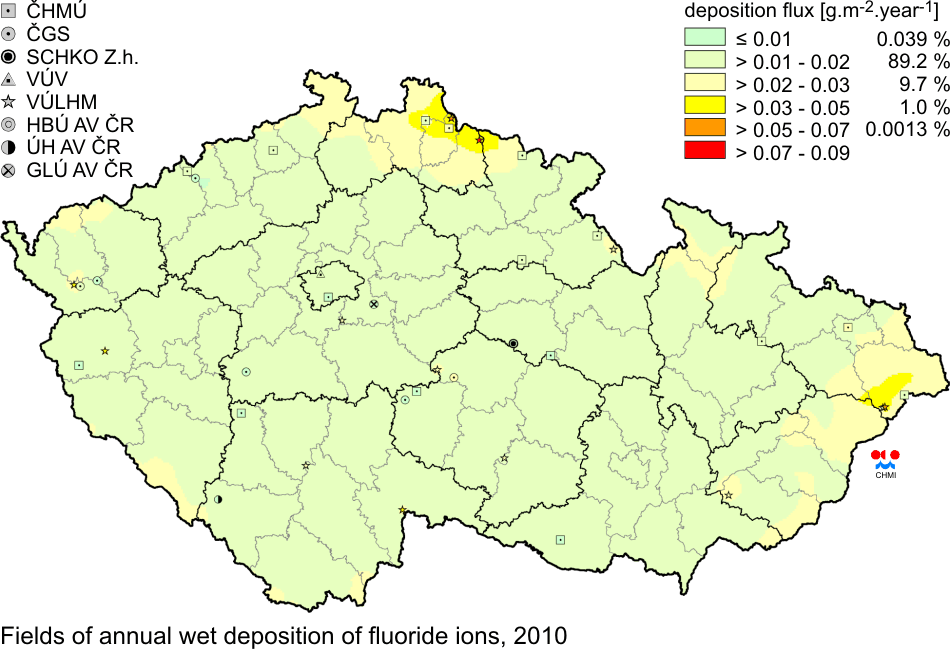
| Fig. III.14 |
Fields of annual wet deposition of fluoride ions, 2010 |
| Fig. III.15 |
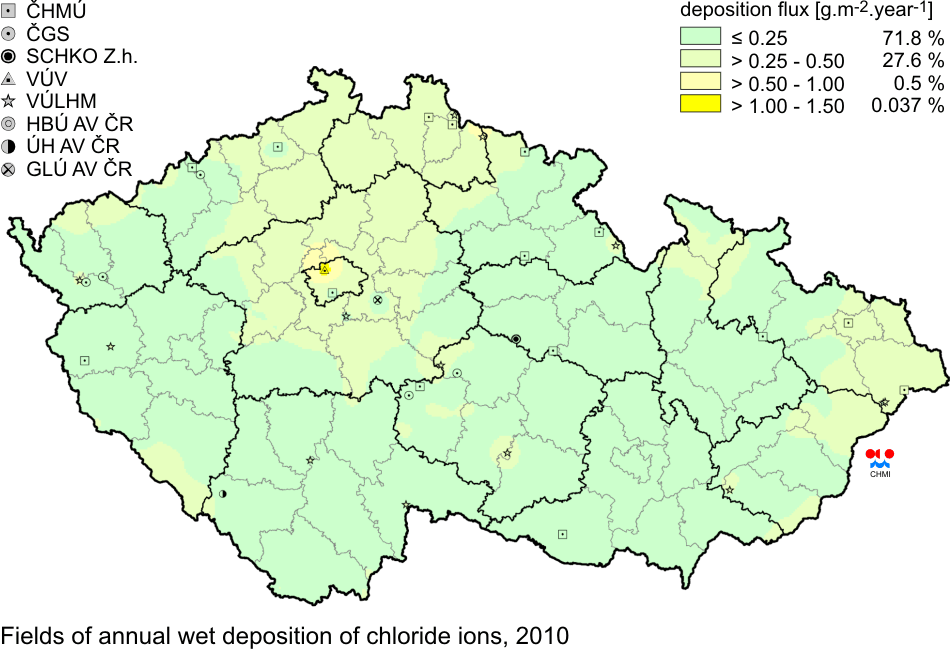
Fields of annual wet deposition of chloride ions, 2010 |
| Fig. III.16 |
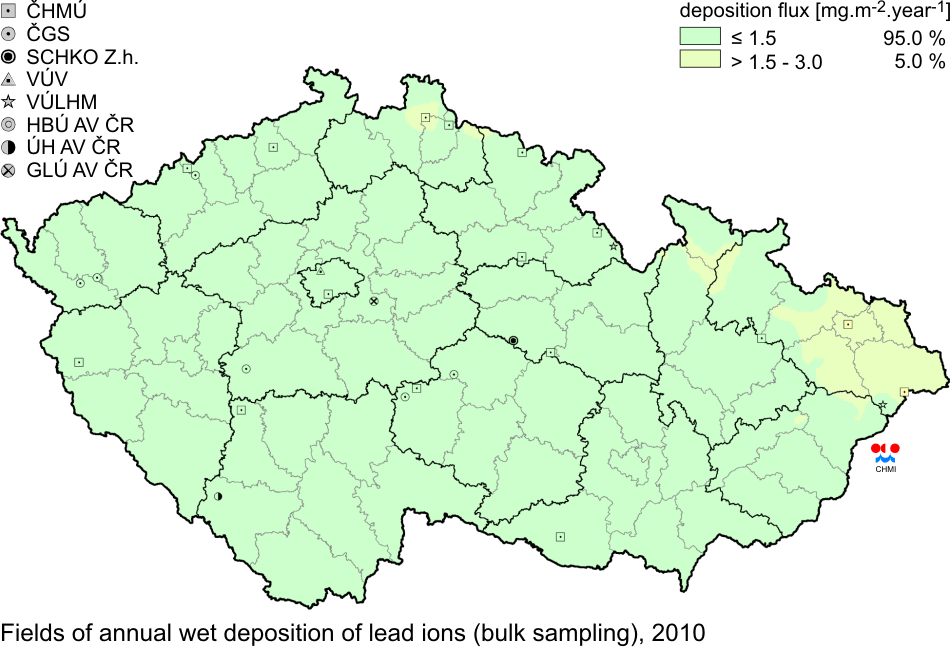
Fields of annual wet deposition of lead ions (bulk sampling), 2010 |
| Fig. III.17 |
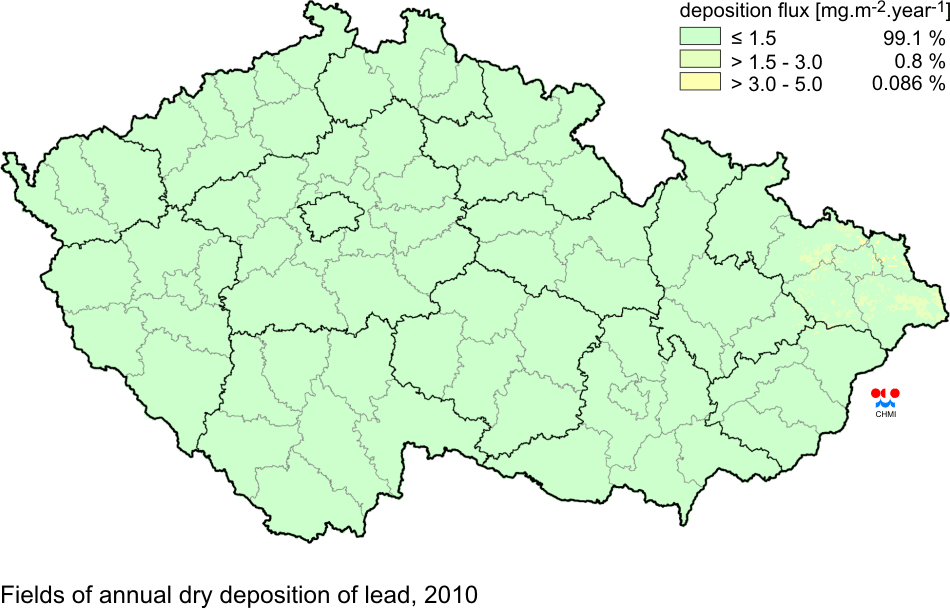
Fields of annual dry deposition of lead, 2010 |
| Fig. III.18 |
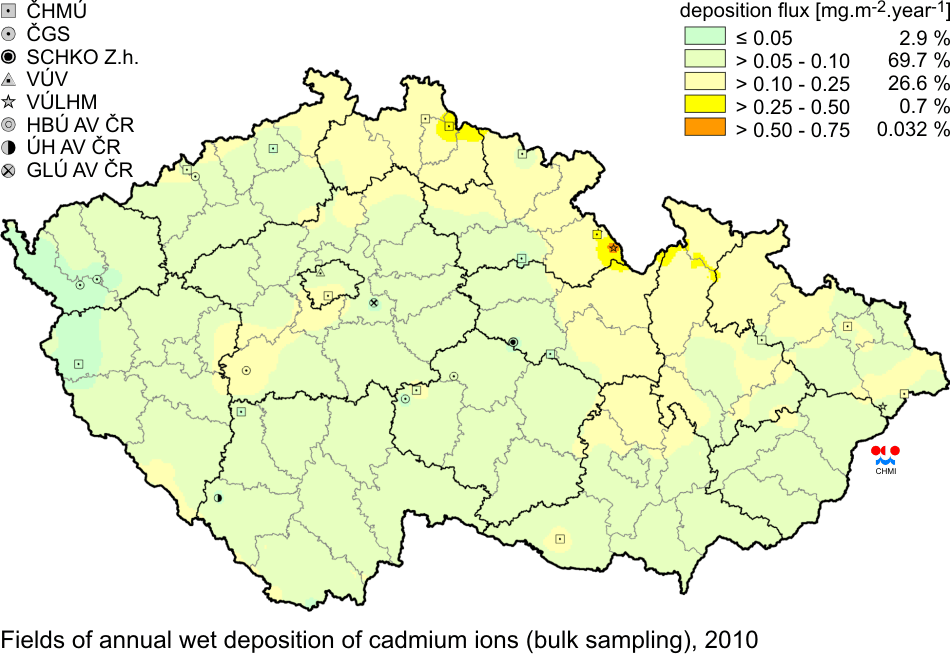
Fields of annual wet deposition of cadmium ions (bulk sampling),
2010 |
| Fig. III.19 |
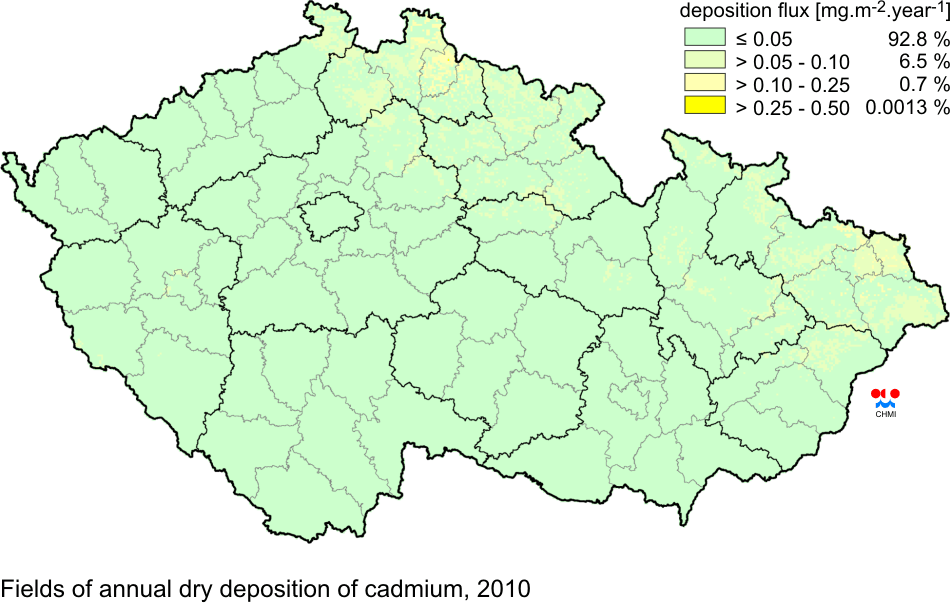
Fields of annual dry deposition of cadmium, 2010 |
| Fig. III.20 |
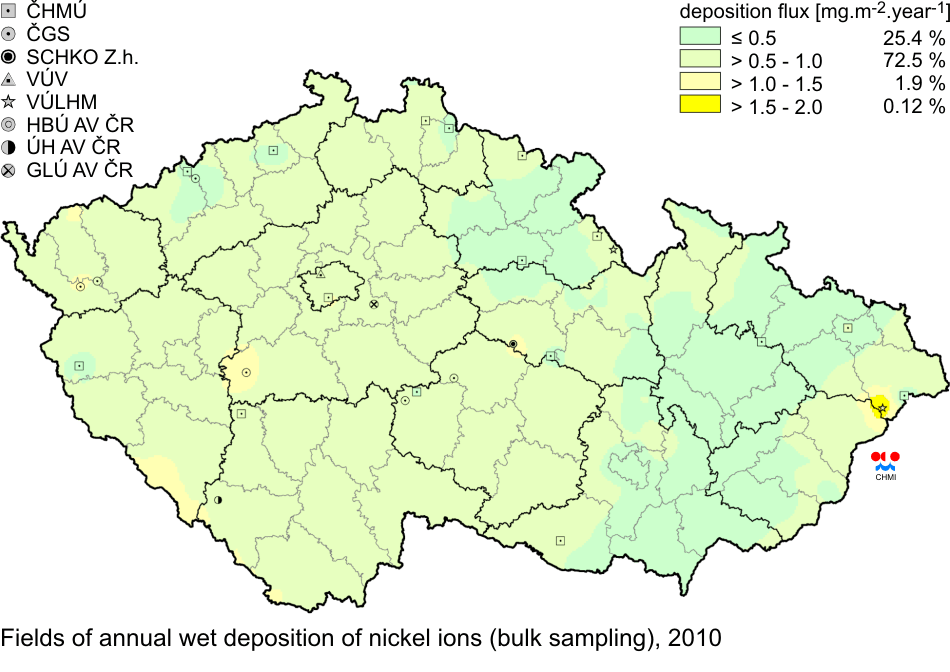
Fields of annual wet deposition of nickel ions (bulk sampling), 2010 |
| Fig. III.21 |
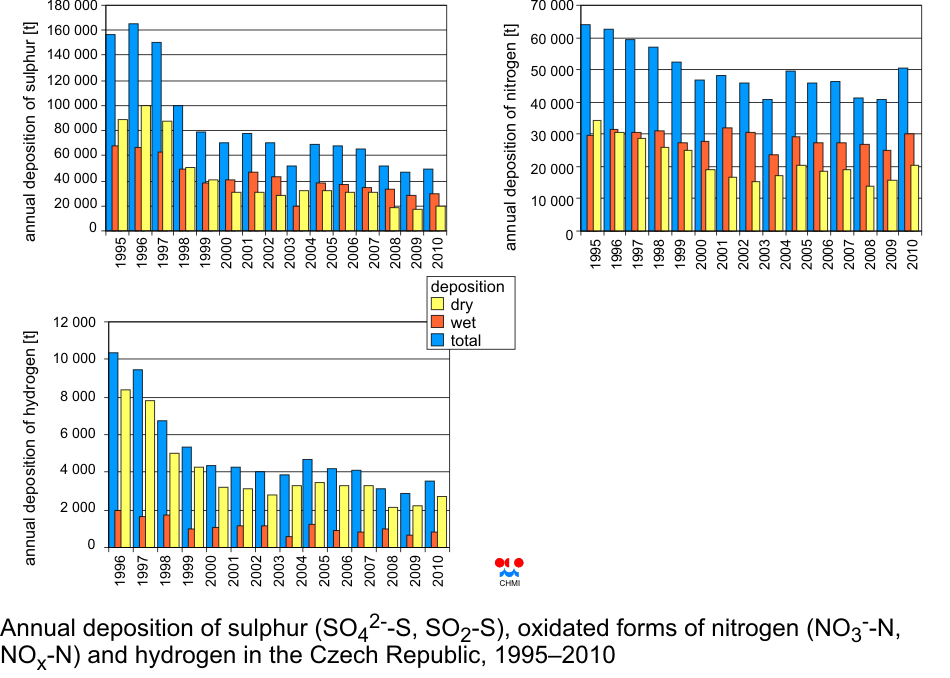
The development of annual deposition of sulphur (SO42-ŌĆōS, SO2ŌĆōS) and
oxidated forms of nitrogen (NO3-ŌĆōN, NOxŌĆōN) and hydrogen in the Czech
Republic, 1995ŌĆō2010 |
| Fig. III.22 |
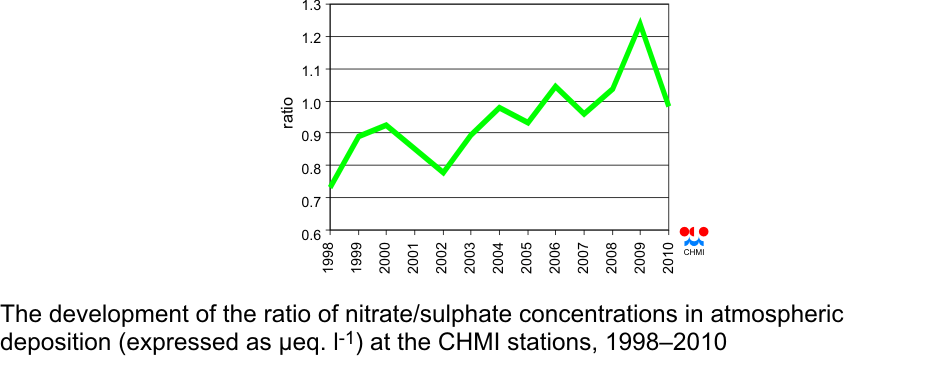
The development of the ratio of nitrate/sulphate concentrations in
atmospheric deposition (expressed as ╬╝eq. l-1) at the CHMI stations,
1998ŌĆō2010 |
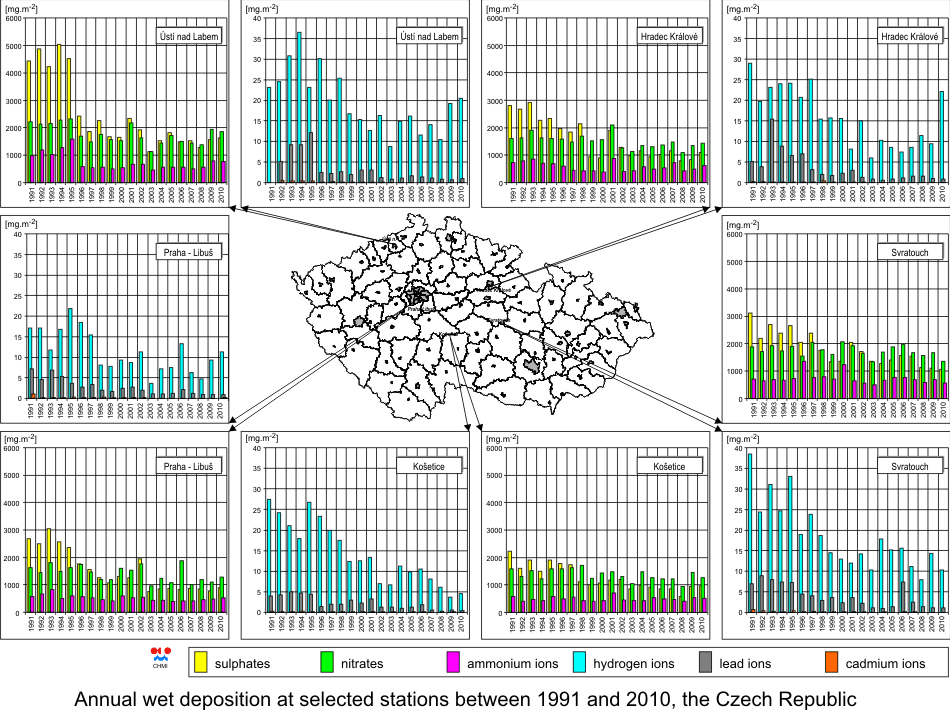
| Fig. III.23 |
The development of annual wet deposition at selected stations in
1991ŌĆō2010, the Czech Republic |