| AIR POLLUTION IN THE CZECH REPUBLIC IN 2010 Czech Hydrometeorological Institute - Air Quality Protection Division |
|
|
|
|
|
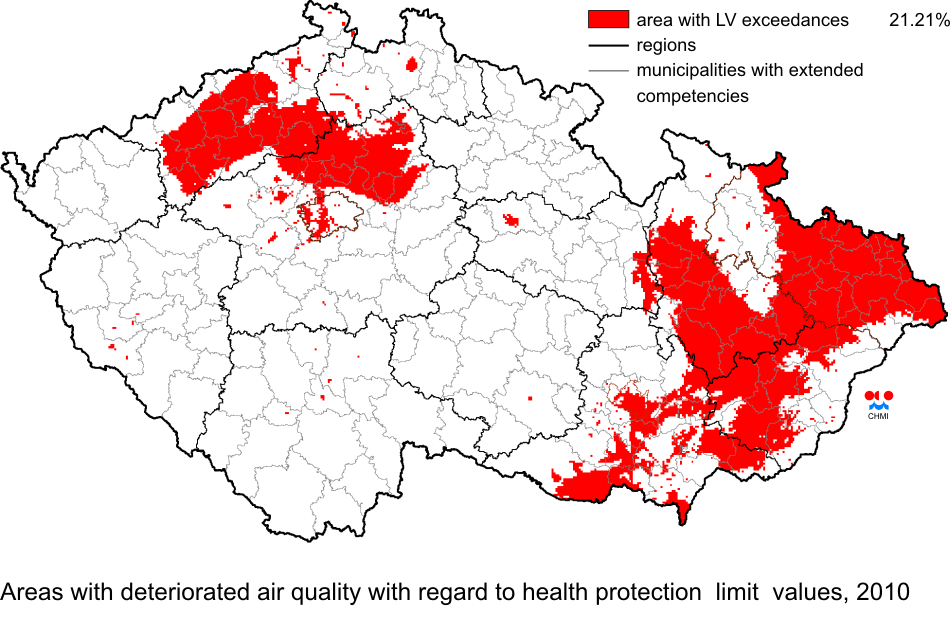
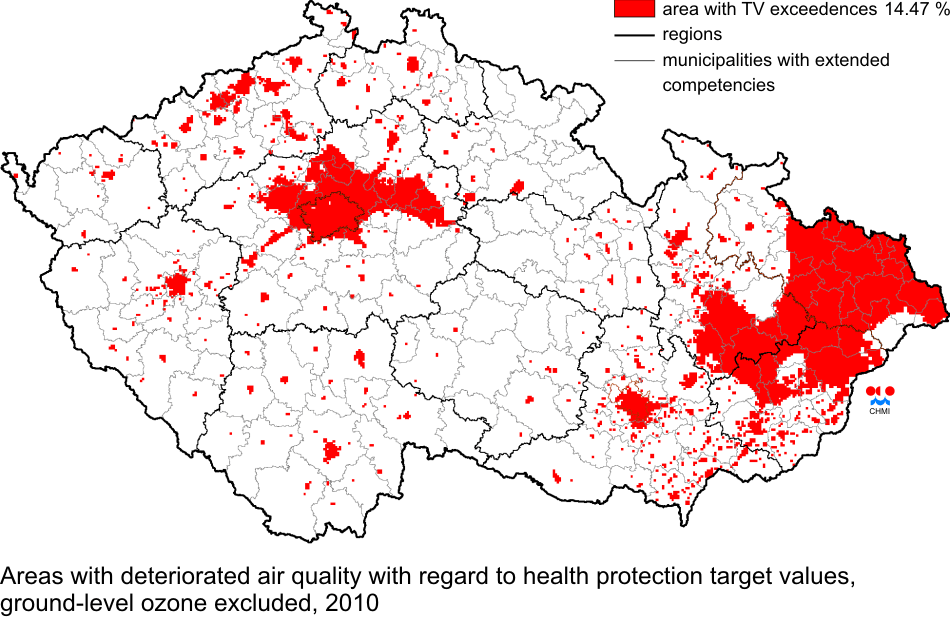
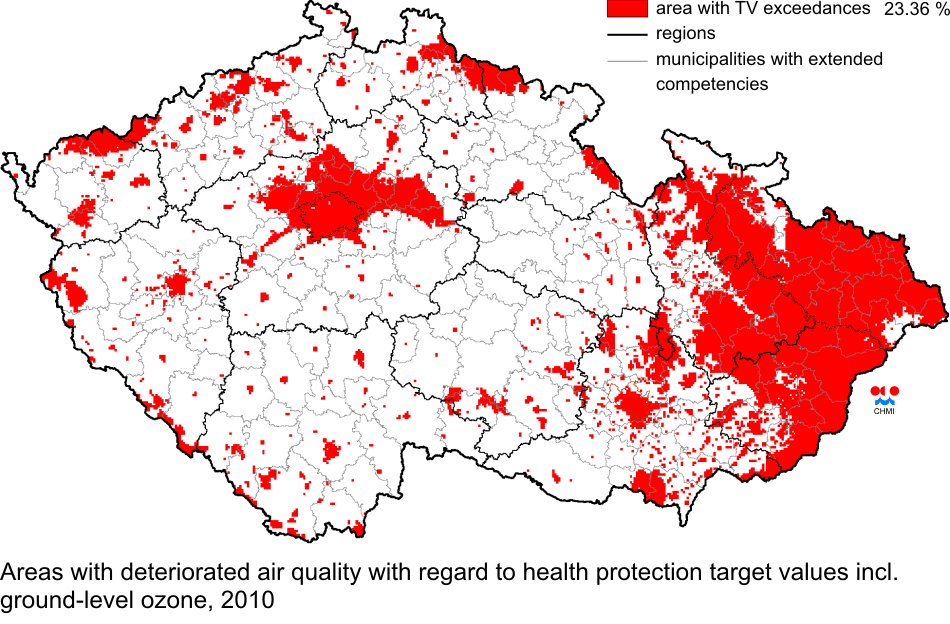
II.4.3 Areas with deteriorated air quality II.4.3.1 Areas with deteriorated air quality with regard to health protection The above mapping procedures were used for the preparation of the maps of spatial distribution of the respective air pollution characteristics presented in the previous subchapters, both for the exceedance of the limit values and for the exceedance of the target values. Areas with the values of air pollution characteristics higher than the respective (target) limit values (marked in red) delineate the areas with deteriorated air quality. Table II.4.3.1 brings the overview of the areas in the Czech Republic, in which the level of the limit values, and especially of the target values for human health protection were exceeded in 2010, for at least one pollutant, based on the results of mapping air pollution characteristics distribution. The exceedance percentage in the respective territory is also presented. The percentages of exceedances presented in the overview in Table II.4.3.1 correspond to the percentages of the territories of the given administrative unit in which at least one limit value of the mentioned set of limit values for the protection of human health was exceeded. The map in Fig. II.4.3.1 depicts the delineation of the areas with deteriorated air quality with regard to limit values, and the map in Fig. II.4.3.2 shows the delineation of the areas with the exceedance of the target values for the protection of human health, ground-level ozone excluded, and in Fig II.4.3.3, ground-level ozone included. Table II.4.3.2 shows the list of administrative units with exceedances of the O3
target value for the protection of health within the areas of the Czech Republic
and the share (%) of the area of exceedance of the respective unit. Ground-level
ozone is presented separately, as it is evident that the measures aimed at the
decrease of ozone concentrations exceeding the target value or the long-term
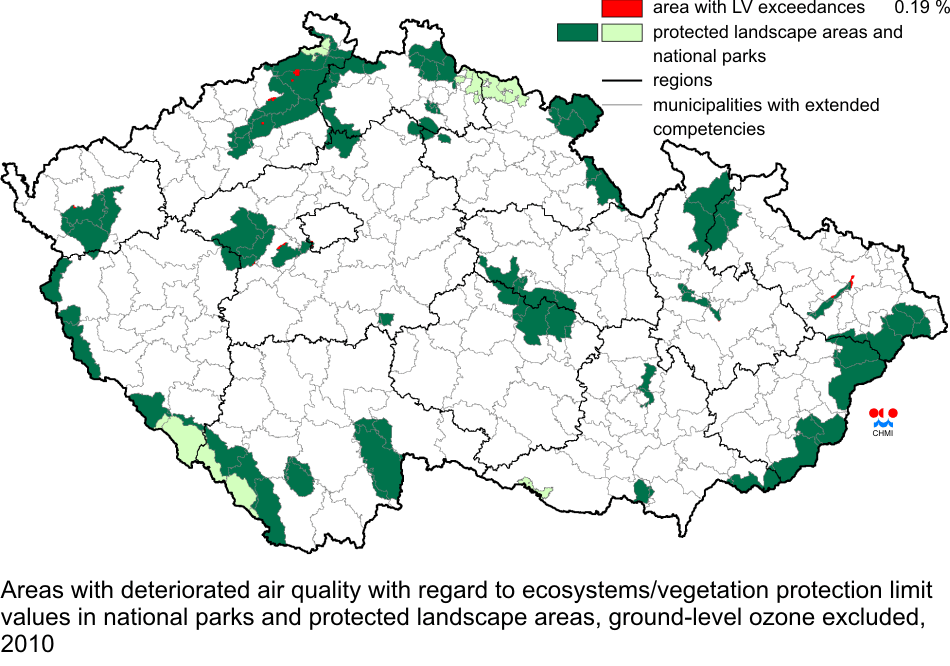
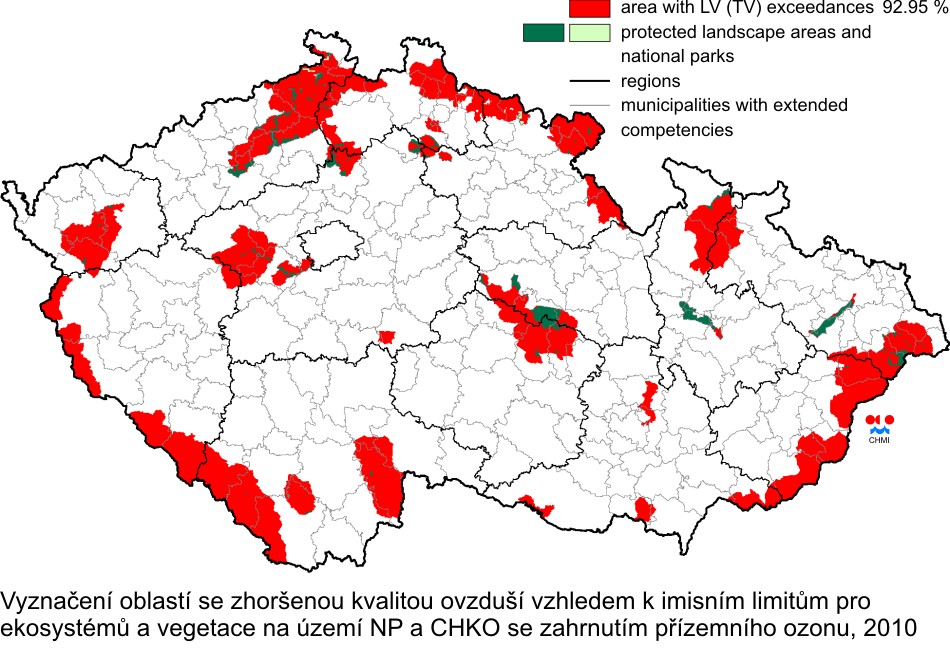
objectives, should be taken at the regional and national level. II.4.3.2 Areas with deteriorated air quality with regard to the protection of ecosystems and vegetation Based on the mapping of air pollution characteristics distribution for the year 2010 with regard to ecosystems and vegetation protection (Chapter II.4.2.2.1, II.4.2.2.2 and II.4.2.2.3) the distribution for annual and winter average concentrations of SO2 (Figs. II.4.2.51 and II.4.2.52) and annual average NOx concentrations (Fig. II.4.2.56) for the protection of ecosystems and vegetation is depicted. The maps in Fig. II.4.3.4 and Fig. II.4.3.5 show the delineation of the areas with deteriorated air quality with regard to the limit value for the protection of ecosystems and vegetation in the territory of national parks and protected landscape areas, the ground-level ozone excluded and included, respectively. Table II.4.3.3 is presented for information. It shows the exceedances of the SO2 and NOx limit value and the AOT40 target value for the protection of ecosystems and vegetation within the national parks and protected landscape areas (% of the territory) in 2010. The values were calculated on the basis of the respective maps of air pollution characteristics.
Fig. II.4.3.1 Areas with deteriorated air quality with regard to health protection limit values, 2010
Fig. II.4.3.2 Areas with deteriorated air quality with regard to health protection target values, ground-level ozone excluded, 2010
Fig. II.4.3.3 Areas with deteriorated air quality with regard to health protection target values, incl. ground-level ozone, 2010
Fig. II.4.3.4 Areas with deteriorated air quality with regard to ecosystems/vegetation protection limit values in national parks and protected landscape areas, ground-level ozone excluded, 2010
Fig. II.4.3.5 Areas with deteriorated air quality with regard to ecosystems/vegetation protection limit values in national parks and protected landscape areas, including ground-level ozone, 2010
|