| AIR POLLUTION IN THE CZECH REPUBLIC IN 2010 Czech Hydrometeorological Institute - Air Quality Protection Division |
|
|
|
|
|
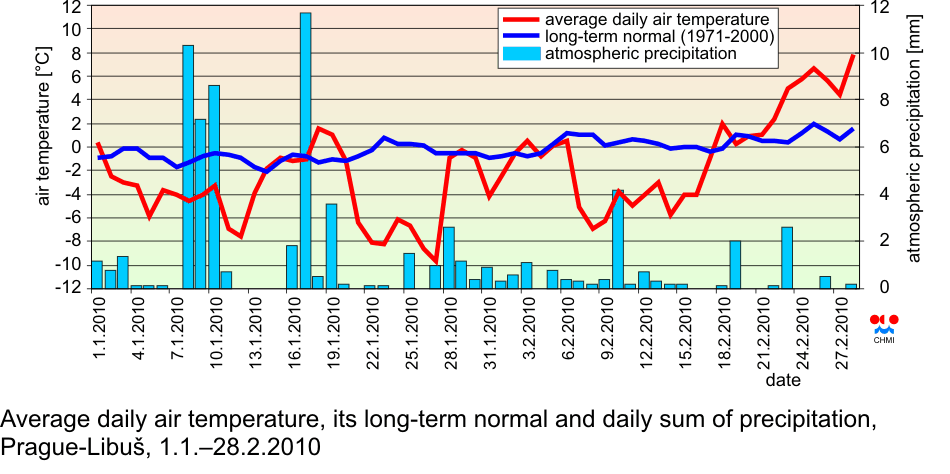
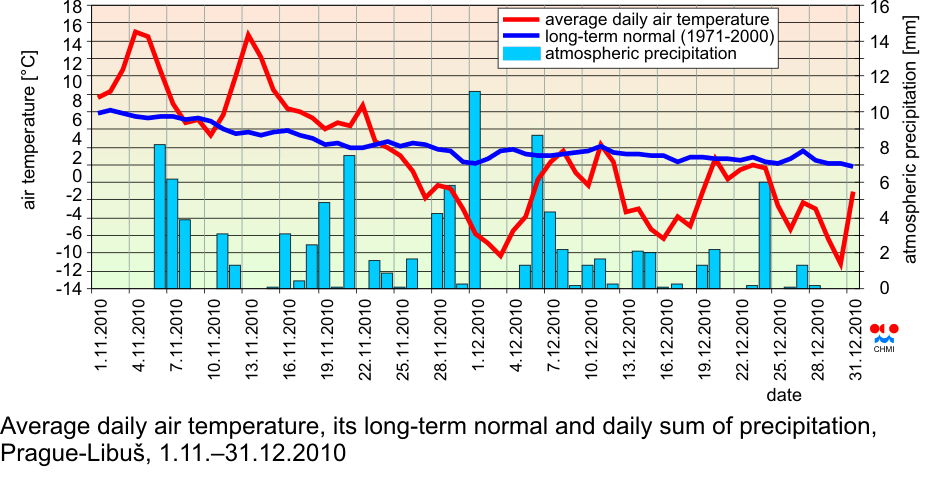
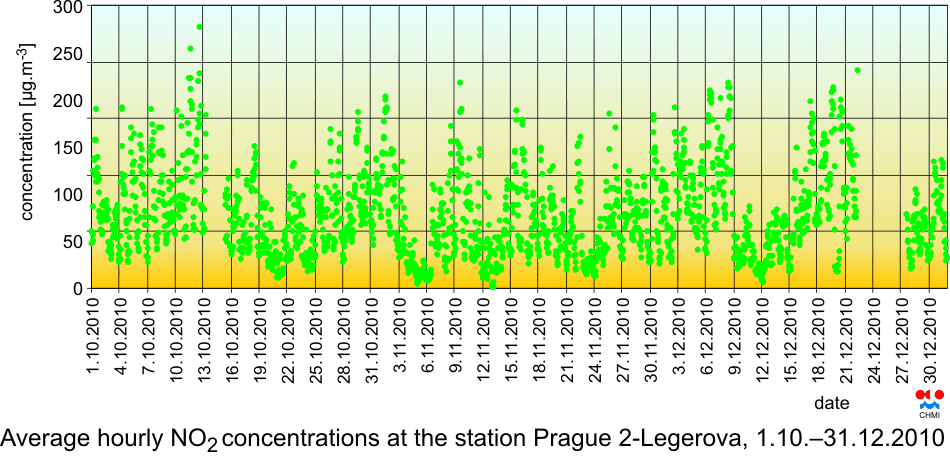
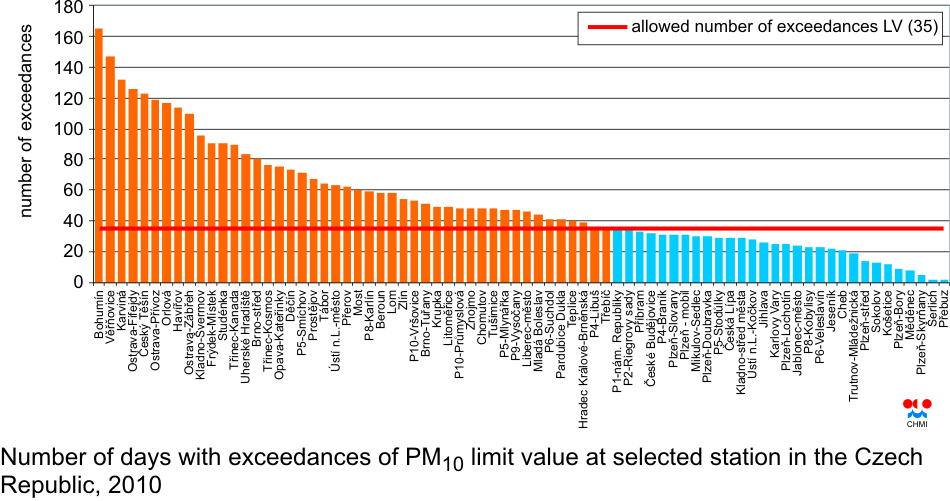
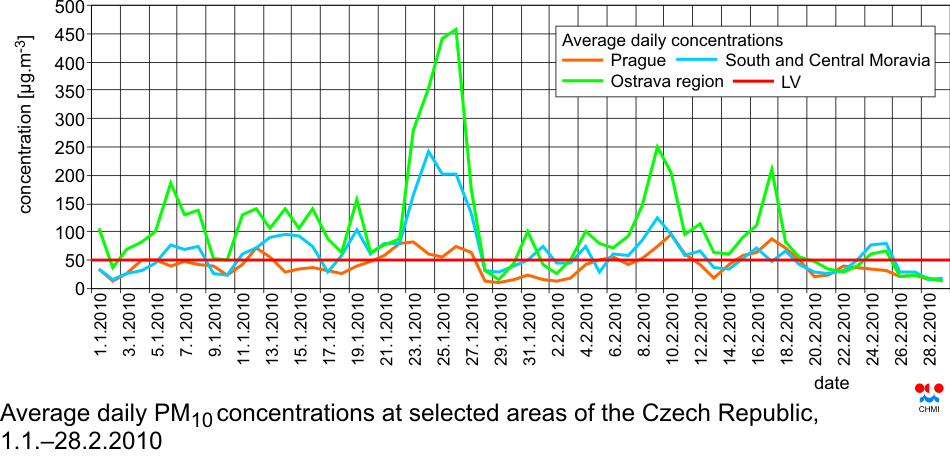
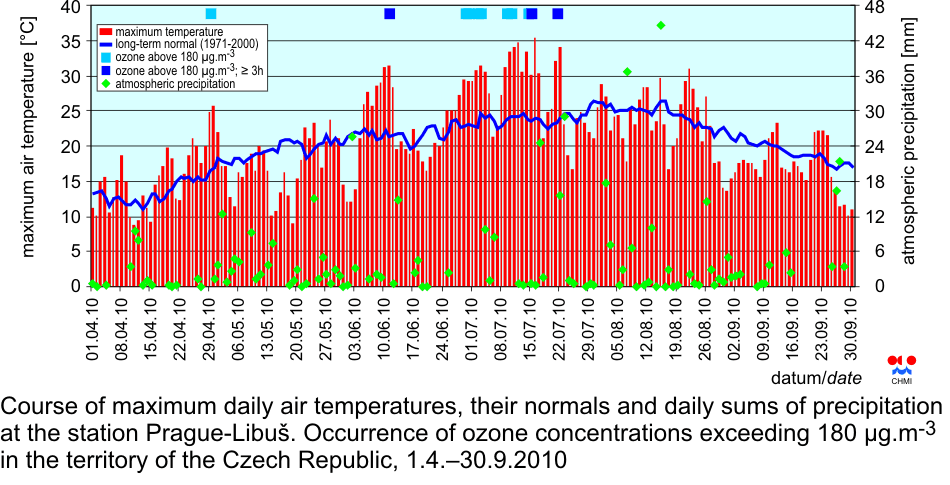
II.5 Evaluation of the smog regulation systems operation on the territory of the Czech Republic in 2010 The temperatures of the first two months of the year 2010 were subnormal and the last two months of the year 2010 were markedly different. In January 2010 the average monthly temperature ŌĆō5.0 ░C was markedly subnormal with the deviation from the normal ŌĆō2.2 ░C, February 2010 with the average monthly temperature ŌĆō1,8 ░C was slightly subnormal with the deviation from the normal ŌĆō1,1 ░C. The month of November with the average monthly temperature 5.0 ░C was significantly above the normal with the deviation +2.3 ░C, while December with the temperature ŌĆō4.9 ░C was slightly below the normal with the deviation ŌĆō1.0 ░C. The year 2010 as a whole with the average temperature 7.2 ░C was slightly below the normal with the deviation from the normal ŌĆō0.3 ░C. In terms of precipitation the monthly totals of January, November and December 2010 were slightly above the normal (140 %, 135 % and 129 % of the normal, respectively). The month of February was significantly below the normal, with the monthly total precipitation 26 mm, which represents 68 %. The highest precipitation in 2010 was recorded in the ├Üst├Ł nad Labem and South Moravian regions, and namely 144 % of the long-term normal, the lowest precipitation, 113 % of the normal, in the Hradec Kr├Īlov├® Region. The annual average for the whole Czech Republic is 867 mm, which is 129 %. According to the results of the Prague-Libu┼Ī station the average daily temperatures in the period from 1.1. to 17.2. 2010 were markedly below zero, with the lowest average temperature ŌĆō9.7 ░C on 27.1.2010. The whole period from 18.2. to 28.2.2010 had the average daily temperatures above zero with the highest average value 7.8 ░C on 28.2.2010. The average daily temperatures from 1.11. to 25.11.2010 were above zero with the highest average temperature 14.7 ░C on 13.11.2010. From 26.11. to 31.12.2010 the temperatures stayed below zero (with the exception of 6 days) with the lowest average temperatureŌĆō11.2 ░C on 30.12.2011. As regards the precipitation, the significant values were recorded in the period 8.1.ŌĆō11.1. 2010 with daily totals from 7.2 to 10.3 mm, and on 17 January with the total of 11.7 mm. In the period 1.11.ŌĆō31.12.2010 there were 64 % of days with precipitation with the highest total of 11.1. mm recorded on 1.12.2010 (Figs. II.5.1 and II.5.2). Anticyclonic situations in JanuaryŌĆōFebruary and NovemberŌĆōDecember 2010 occurred in 16 % of cases and their relative frequency for the above months was unsteady and ranged between 7 and 32 %. The highest relative frequency of the occurrence of anticyclonal situations ŌĆō 32 % of days in the given month ŌĆō was in January 2010, in February it reached 11 %. In November 2010 the anticyclonal situations were recorded in 7 % and in December 2010 in 13 % of days. Anticyclonal situations in January 2010 caused unfavourable dispersion conditions which resulted in high concentrations of suspended particles of PM10 fraction. SO2 and NO2 concentrations In 2010 the hourly concentrations of SO2 exceeding 250 ╬╝g.m-3 were recorded in the territory of the Czech Republic in 9 cases with the highest value 398 ╬╝g.m-3 at the station Pardubice-Dukla. The conditions for the announcement of the SRS signals were not fulfilled. From 1.1. to 28.2.2010 and from 1.11. to 31.12. 2010 there were recorded concentrations of NO2 above 200 ╬╝g.m-3 lasting for 3 subsequent hours and more only at the station Prague 2-Legerova, and namely on 5 days: 8.2.2010 from 15:00ŌĆō17:00 with the maximum value 235 ╬╝g.m-3, on 10.2.2010 from 14:00ŌĆō17:00 with the maximum value 216 ╬╝g.m-3, on 16.2.2010 from 15:00ŌĆō17:00 with the maximum value 244 ╬╝g.m-3, on 17.2.2010 from 11:00ŌĆō18:00 with the maximum value 256 ╬╝g.m-3 and on 22.2.2010 from 06:00ŌĆō08:00 with the maximum value 233 ╬╝g.m-3 (Figs. II.5.3 and II.5.4). Two-hour exceedance occurred at the station Ostrava-─īeskobratrsk├Ī, 1-hour exceedances were recorded at the stations Prague 10-Pr┼»myslov├Ī and Uhersk├® Hradi┼Īt─ø. In all cases the NO2 concentrations decreased very quickly, the expected significant increase did not occur, and, consequently, the conditions for the announcement of the SRS signals were not fulfilled. PM10 concentrations The concentrations of PM10 at 46 stations of 77, i.e. 59.7 % measuring AIM CHMI localities (stations decisive for the announcement of the warning and regulation signals) exceeded the daily limit value 50 ╬╝g.m-3 which may be exceeded only 35x in one year (Fig. II.5.5). The worst period from 1.1. to 28.2.2010 with 5 episodes longer than 3 days, when the daily average concentrations, especially in Moravia and Silesia, recorded multiple exceedances of the value 50 ╬╝g.m-3 (Fig. II.5.6). During the episode lasting from 19 to 27 January 2010, at 70 stations there were recorded PM10 concentrations exceeding the value 50 ╬╝g.m-3 every day from 23 to 26 January. The overview of stations exceeding the average daily concentration 50 ╬╝g.m-3 in the 3-day and longer episodes in January and February 2010 is shown in TableII.5.1. The analysis of the synoptic situation during the episodes of high PM10 concentrations On 18 January 2010 the weather in the Czech Republic was influenced by the anticyclone 1025 hPa, with the centre above France, the eastern parts of Moravia and Silesia were influenced by the weakening occluded front. On the following day the decaying anticyclone moved towards Austria and the weather in the Czech Republic was influenced by the frontal system which diffused during its passage over the central Europe towards southeast. Starting from 20 January the weather in the Czech Republic was influenced by massive anticyclone of 1050 hPa with the centre over the Urals. On the following day the anticyclone strengthened to 1055 hPa and passed towards western Siberia. From 22 to 25 January the anticyclone gradually weakened to 1040 hP and its centre moved from the area of St. Petersburg towards southern Norway. The ridge of higher pressure expanded to the southeast up to the Black Sea and the anticyclone of 1045 developed again over the Urals. On 26 January the anticyclone 1050 hPa was situated above the Urals and one ridge of higher pressure stretched over central Europe as far as to the eastern Atlantic and the second one to the area of the Black Sea. On the following day the ridge of higher pressure over the central Europe decayed and in the rear of the cyclone 980 hPa with the centre over northern Scandinavia the frontal system passed over the North Sea towards southeast. On 28 January in the afternoon the occluded front moved over the territory of the Czech Republic and on the following day the frontal zone passed already from western to central Europe. Similarly, at the end of the year 2010 there occurred 3 episodes of high concentration of suspended particles of PM10 fraction, and namely on the following days: 3ŌĆō8, 18ŌĆō24 and 30ŌĆō31 December 2010. During all mentioned days the aerological measurements in Prague-Libu┼Ī recorded the inversion temperature stratification of air mass. The synoptic aspect of the above mentioned episodes showed most frequently the situation marked as SWc2 (i.e. Southwestern cyclonal), during which there prevails the advection of warm air in any part of the year. In the cold part of the year the influx of warmer air is manifested mainly in the higher atmosphere layers, while the air near to the ground surface may be colder due to the weak influx of solar radiation and radiation cooling of the earth surface during night hours. This resulted in the formation of ground-level inversions and bad dispersion conditions. Deteriorated dispersion conditions in the first and the last quarter of the year 2010 resulted in the exceedance of the alert limit values for PM10 particles and the fulfilment of the conditions for the announcement of warning and regulation signals within the SRS. The signals were announced in the territory of the ├Üst├Ł nad Labem, Central Bohemian, Pardubice and Moravian-Silesian regions. Ground-level ozone As regards the maximum daily temperatures at the station Prague-Libu┼Ī, the period from 1.4. to 30.9.2010 was slightly above the normal with the deviation +0.6 ░C, but the temperatures were rather fluctuating. Daily temperature deviations from the normal ranged in the interval from +11.3 ░C to ŌĆō11.4 ░C. The highest average monthly temperature deviation from the long-term normal in the monitored period was +3.5 ░C in July, the lowest one ŌĆō2.2 ░C in May, the deviations in the remaining months ranged from +1.8 ░C to ŌĆō1.9 ░C. In the monitored period there were 16 days with the temperatures above 30 ░C; the highest value 35.3 ░C was measured on 16 July 2010. In the period from 1.4.ŌĆō30.9.2010 the total precipitation amounted to 459 mm, out of which 200 mm in the period from 17.7. to 15.8.2010 (Fig. II.5.7). Occurrence of increased concentrations of ground-level ozone from 1.4. to 30.9. 2010 The increased ozone concentrations can be expected with the occurrence of high air temperatures, when the weather is clear or somewhat clear with low wind velocities. Between 1.4. and 30.9.2010, according to the measurement of the station Prague-Libu┼Ī, there occurred 4 periods during which the afternoon temperatures exceeded 30 ░C for minimum two subsequent days. The overview of the periods is shown in Table II.5.3. According to the station Prague-Libu┼Ī the first case of the temperature above 30 ░C was recorded on 10.6. and the last one on 22.8. The period of the occurrence of tropical temperatures was interrupted by the invasions of cold air of diverse duration. The longest period with tropical temperatures lasted from 9 to 17 July. The analysis of the occurrence of the highest average hourly concentrations of ground-level ozone in the territory of the Czech Republic from April to September 2010 shows that in April the highest concentration of ground-level ozone in the territory of the Czech Republic reached 186 ╬╝g.m-3, and namely in Plze┼ł, in May 159 ╬╝g.m-3, also in Plze┼ł, in June 188 ╬╝g.m-3 in Karvin├Ī, in July 202 ╬╝g.m-3 in Most, in August 155 ╬╝g.m-3 in Mlad├Ī Boleslav and in September 165 ╬╝g.m-3 in ┼Āerlich. In 2010 there were recorded 3 days with the exceedance of the limit value for O3 180 ╬╝g.m-3, and namely on 12.6. at 3 stations, out of which in Karvin├Ī for 3 hours, and in each of the remaining two cases at 7 stations, out of which at 3 stations (Karvin├Ī, Sn─ø┼Šn├Łk and Teplice) for 3 hours and more on 16.7., and on 22.7. at 2 stations (Pardubice-Rosice and Most) (tab. II.5.4.). The distribution of maximum daily concentrations from 1.6. to 31.7.2010 at selected stations in the Czech Republic is presented in Fig. II.5.8. Synoptic situation and the weather on 16 and 22 July 2010 Two episodes with the greatest occurrence of high concentrations of ground-level ozone were recorded on 16 and 22 July 2010. On 16.7. the cyclone 986 hPa was situated above England and the inflow of warm air to central Europe culminated on its front side. In the rear of this cyclone cold front proceeded over western Europe, and it passed the territory of the Czech Republic in early morning hours on 17.7.2010. During the day the weather was mostly clear, and in the northern mountainous areas somewhat clear. The maximum afternoon temperatures in Bohemia reached up to 37 ░C, in Moravia they were by about 1.0 ░C lower. There prevailed weak easterly wind. On 22.7. the situation was very similar to that of 16.7., with the exception of the centre of the cyclone 989 hPa ŌĆō it was situated above southern Scandinavia and the cold front began to pass over the territory of the Czech Republic as soon as around midnight from 22 to 23 July 2010. During the day the weather in western Bohemia and in the mountains was somewhat clear to cloudy, in the remaining territory of Bohemia and in Moravia mostly clear. The maximum afternoon temperatures in Bohemia reached up to 36 ░C, in Moravia they were by about 1.0 ░C lower. In early morning there prevailed weak southerly wind, later it turned towards the north and strengthened to 2ŌĆō4 m.s-1. The cold front brought abundant precipitation in western Bohemia up to 94 mm. During this period 6 stations recorded the concentrations exceeding 180 ╬╝g.m-3 for three hours, however they decreased very quickly. In connection with the expected transition of the cold front lower values of ozone concentrations were predicted for the following day, without the exceedance of the alert threshold limit. The warning signal was not announced. Tab. II.5.4 Overview of concentrations exceeding 180 ╬╝g.m-3 in 3-hour and longer episodes
Fig. II.5.1 Average daily air temperature, its long-term normal and daily sum of precipitation, Prague-Libu┼Ī, 1.1.ŌĆō28.2.2010
Fig. II.5.2 Average daily air temperature, its long-term normal and daily sum of precipitation, Prague-Libu┼Ī, 1.11.ŌĆō31.12.2010
Fig. II.5.3 Average hourly NO2 concentrations at the station Prague 2-Legerova, 1.1.ŌĆō28.2.2010
Fig. II.5.4 Average hourly NO2 concentrations at the station Prague 2-Legerova, 1.10.ŌĆō31.12.2010
Fig. II.5.5 Number of days with exceedances of PM10 limit value at selected station in the Czech Republic, 2010
Fig. II.5.6 Average daily PM10 concentrations at selected areas of the Czech Republic, 1.1.ŌĆō28.2.2010
Fig. II.5.7 Course of maximum daily air temperatures, their normals and daily sums of precipitation at the station Prague-Libu┼Ī. Occurrence of ozone concentrations exceeding 180 ╬╝g.m-3 in the territory of the Czech Republic, 1.4.ŌĆō30.9.2010
Fig. II.5.8 Maximum daily concentration of ground-level ozone at selected stations, 1.6.ŌĆō31.7.2010
|