IV.6 HEAVY METALS
IV.6.1 Air pollution caused by heavy metals in the year 2013
Lead
In 2013 the limit value for lead concentrations was not
exceeded in any of 55 localities with sufficient number of data
for the calculation of the valid annual average. The highest
annual average was measured in the locality Ostrava-Mariánské
Hory (Table XIII.12). With the exception of the year 2011, when
the highest concentration was recorded in the locality Příbram
I-nemocnice, the highest lead concentrations are repeatedly
measured in the Ostrava-Karviná area.
Lead concentrations are very low in the whole territory of the
CR and they do not reach even one half of the limit value, i.e.
the lower assessment threshold 250 ng.m-3 (Fig.
IV.6.7). In comparison with the year 2012 lead concentrations
decreased in 60 % of localities (29 of the total number of 48
stations, which measured lead concentrations both in 2012 and
2013). The courses of short-term (24-hour, or 14-day
concentrations, according to the measuring scheme at the
respective station) average concentrations of lead in selected
localities do not show any seasonal character (Fig. IV.6.3).
Cadmium
In 2013 the annual limit value for cadmium (5 ng.m-3) was
exceeded only in one locality (Tanvald-školka, 7 ng.m-3) of the
total number of 55 localities with the valid annual average
(Table. XIII.13). The highest annual average concentrations were
measured mostly in the localities in the districts Jablonec nad
Nisou and Ostrava-město (Table IV.6.1).
In comparison with the year 2012 in 41 % of localities (21 of
the total number of 51 stations which measured cadmium
concentrations both in 2012 and 2013) the average annual
concentrations decreased. Cadmium concentrations have seasonal
character with higher values in winter and spring months which
confirms that cadmium is emitted into the atmosphere from
combustion sources used for heating (Fig. IV.6.4). There is one
exception, and namely the locality Tanvald-školka, where higher
concentrations of cadmium are recorded also in the summer
period. This fact suggests the existence of another type of
source which, however, has not been identified yet.
Arsenic
The annual limit value of arsenic (6 ng.m-3) was exceeded
only in one locality (Kladno-Švermov, 6.7 ng.m-3) of the total
number of 55 localities with the valid annual average (Table
XIII.14). The limit value for arsenic has been exceeded every
year at least at one station since the beginning of measurements
in 1986 with the exception of the year 2012, when the limit
value was met at all measuring stations. In comparison with the
year 2012 the annual average concentration decreased in 46 % of
localities (23 of the total number of 50 stations, which
measured arsenic concentrations both in 2012 and 2013). The
heaviest loads of arsenic concentrations are recorded in
northwestern parts of Bohemia and the surroundings of the city
of Plzeň (Fig. IV.6.2).
The course of short-term (24-hour or 14-day concentrations,
according to the measuring scheme at the respective station)
average arsenic concentrations (Fig. IV.6.5) shows, similarly as
the average concentrations of cadmium, a marked seasonal
character suggesting the significant share of combustion sources
contributing to air pollution caused by arsenic.
Nickel
The limit value for nickel (20 ng.m-3) was not exceeded at any of 55 localities with sufficient number of data for the calculation of the valid annual average. The highest concentration 9.9 ng.m-3 was measured at the station Jihlava-Znojemská, classified as traffic station (Table XIII.15, Fig. IV.6.6). A slight decrease of the annual average concentration in comparison with the previous year was recorded in 68 % of localities (34 of the total number of 50 stations which measured Ni concentrations both in 2012 and 2013).
IV.6.2 The development of heavy metals concentrations
The average annual concentrations of all monitored heavy
metals have been decreasing in the past years; most significant
decrease was recorded in lead and cadmium concentrations (Fig.
IV.6.13). In arsenic and nickel two marked deviations occurred
within the evaluated period, and namely the increase of arsenic
concentrations in 2006 and 2010, and the increase of nickel
concentrations in 2007 and 2010. The increase of annual average
concentration is apparent in 2010 also in lead. The cause of
these deviations has not been sufficiently explained yet.
In 2005–2007 a very marked decrease of cadmium concentrations
was recorded at urban stations, and consequently, in the
national average. This was caused by the decrease of the
exceptionally high concentrations of cadmium measured in the
urban locality Tanvald ZÚ since 2005. The area around Tanvald (the
Liberec region) is characterized by high share of glass industry
(ASKPCR, 2014), which used to be the significant source of
cadmium emissions from the used dying and fluxing substances,
primarily in the past (Beranová, 2013). Since 2004 the measures
set by the Integrated regional programme to improve ambient air
quality in the Liberec region has been implemented aimed at the
reduction of cadmium emissions from glassworks (Rada Libereckého
kraje, 2004). The implementation of modern technologies resulted
in a marked decrease of cadmium concentrations in several
following years (ATEM, 2006), and, consequently, to the
reduction of air pollution concentrations in this area. Despite
this decrease, there are recorded the above-the-limit cadmium
concentrations, however, their source has not been identified
yet.
In the areas not influenced by industrial production, the
average annual concentrations of all heavy metals are usually
higher in cities (Fig. IV.6.13). This is caused primarily by the
concentration of industrial plants in cities, and by higher
intensity of traffic. Urban localities are characterized also by
more marked decrease of heavy metals concentrations during the
evaluated period in comparison with the rural localities. Since
2005–2006 when heavy metals concentrations in rural localities
slightly decreased, stagnation has been apparent in the
following years.
IV.6.3 Emissions of heavy metals
The group of heavy metals includes the metals with a specific
weight above 4.5 g.cm-3 and their compounds. The compounds of
heavy metals are the natural component of fossil fuels and their
content in the fuel varies according to the mining locality. The
amount of emissions during the combustion of fossil fuels
depends primarily on the type of fuel, type of the combustion
plant and on the combustion temperature, influencing the
volatility of heavy metals. Emissions of heavy metals are formed
also during some technological processes due to their content in
input raw materials. Heavy metals are present e.g. in iron ore,
scrap iron, input mixture for glass melting, in dying substances
etc. Besides, there are many sources of fugitive emissions of
these pollutants which have not been included in emission
inventories yet. For instance heavy metals in particulate
emissions from tyre and brake wear or emissions of heavy metals
connected with old ecological loads from mining and
metallurgical activities. These types of sources are considered
the probable cause of air pollution by arsenic around Kladno.
Combustion processes are significant mainly in emissions of
arsenic and nickel. One of the most important sectors is the
sector of public electricity and heat production; its share in
arsenic emissions in 2012 was 65.8 % and in nickel emissions
58.8 % (Figs. IV.6.16 and
IV.6.17). This sector also contributed
significantly to cadmium emissions (28.3 %) and lead emissions
(23.8 %). The share of the sectors of iron and steel production
(1A2a and 2C1) prevailed in 2012 mainly in emissions of lead
(38.7 %) and cadmium (37.7 %);
Figs. IV.6.14 and
IV.6.15.
Another significant source of heavy metals emissions is
represented by the sector 1A2fi, which covers the combustion
processes in manufacturing industries (production of glass,
cement, lime and other mineral products).
Due to the prevailing share of the sector of public electricity
and heat production and the sector of iron and steel production,
the spatial distribution of heavy metals emissions is given
primarily by the location of the plants operating within the
above sectors. Significant emissions of arsenic and nickel are
focused in the areas with coal-burning thermal power plants and
heating plants (Figs. IV.6.20 and
IV.6.21). These are mainly the
enterprises operating in the Ústí nad Labem region. Large amount
of nickel is emitted into atmosphere also in the Pardubice
region from the Chvaletice power plant and in the Plzeň region
from the Teplárny ELÚ III heating plant. Emissions of arsenic
are emitted, besides the Ústí nad Labem region, also in the the
Central Bohemia region from the Mělník I power plant and in the
Pardubice region from the Opatovice power plant. Emissions of
lead and cadmium prevail in the Moravia-Silesia region due to
the concentration of the plants producing iron and steel (Figs.
IV.6.18 and
IV.6.19).
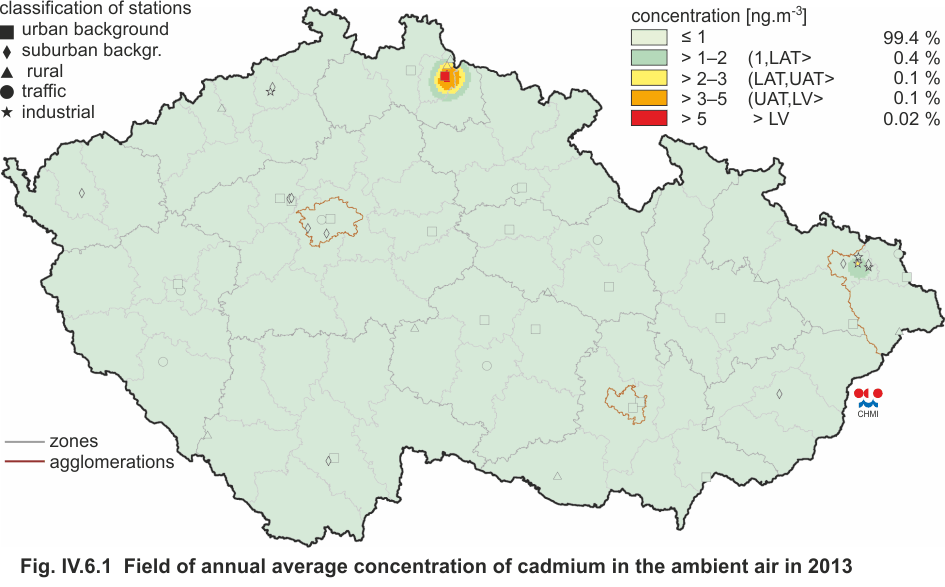
Fig. IV.6.1 Field of annual average concentration of cadmium
in the ambient air in 2013

Fig. IV.6.2 Field of annual average concentration of arsenic
in the ambient air in 2013
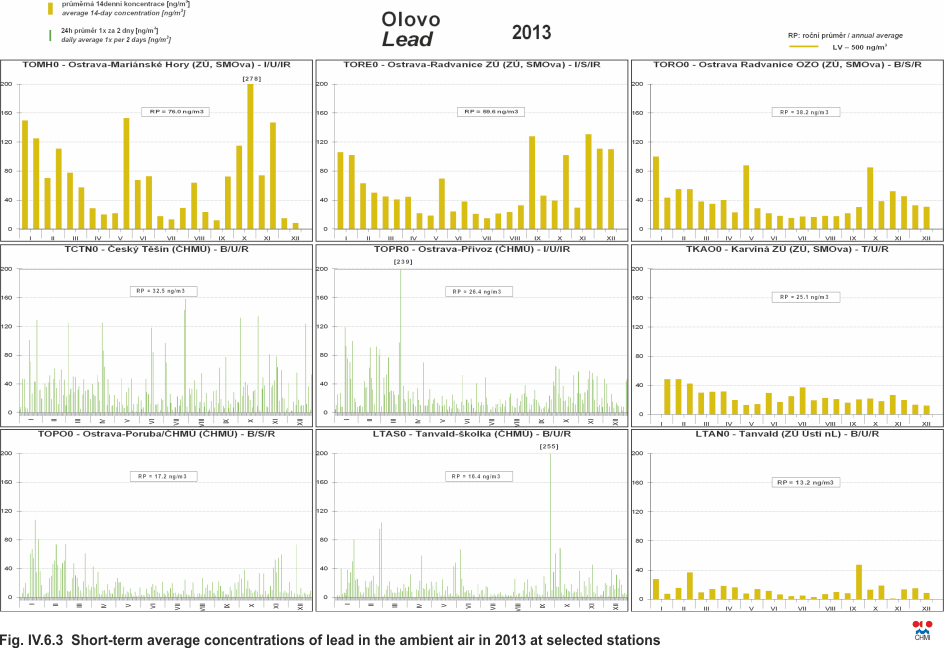
Fig. IV.6.3 Short-term average concentrations of lead in the
ambient air 2013 at selected stations
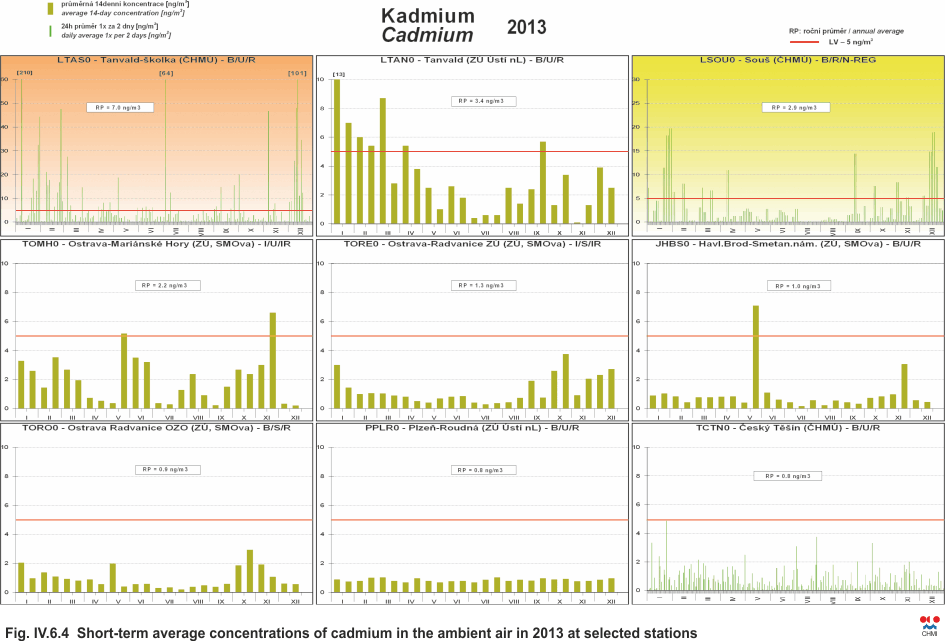
Fig. IV.6.4 Short-term average concentrations of cadmium in
the ambient air in 2013 at selected stations
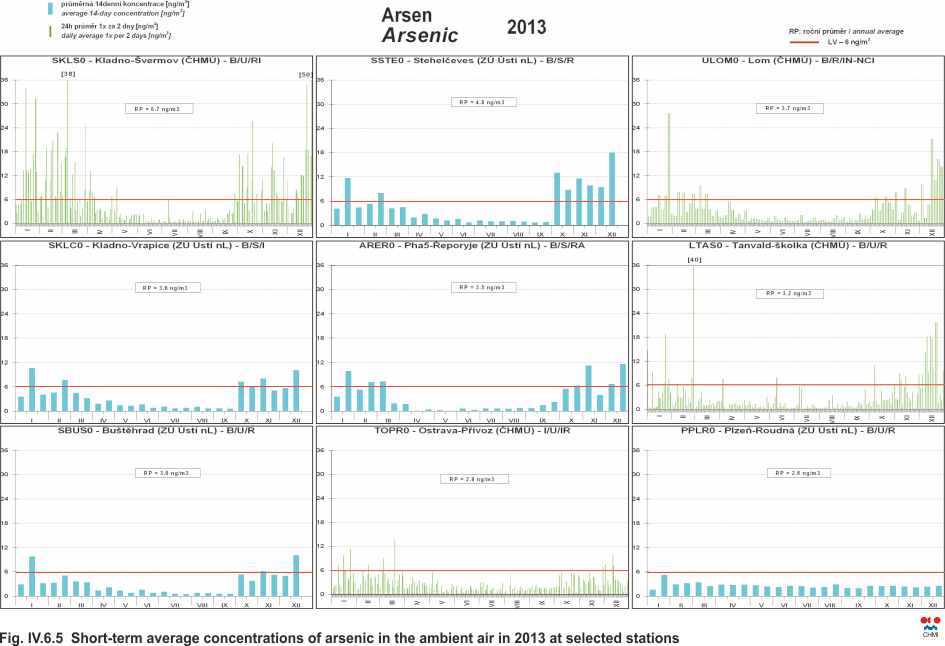
Fig. IV.6.5 Short-term average concentrations of arsenic in
the ambient air 2013 at selected stations
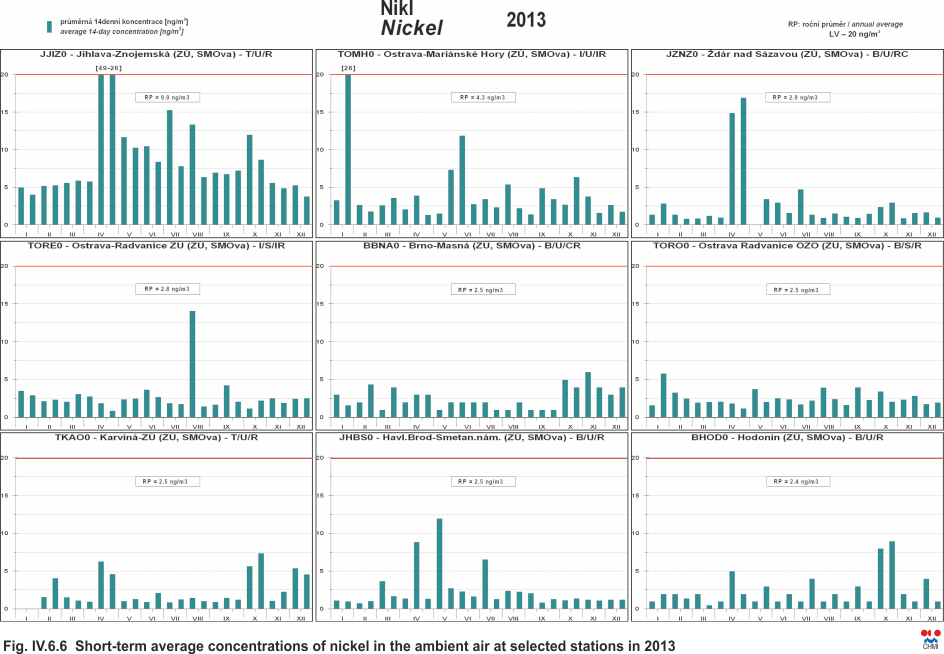
Fig. IV.6.6 Short-term average concentrations of nickel in
the ambient air at selected stations in 2013
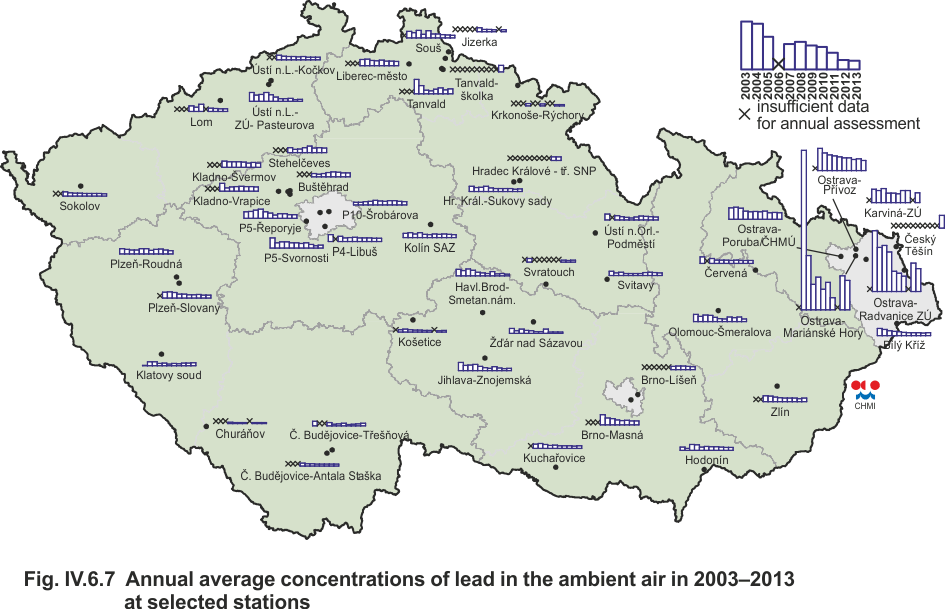
Fig. IV.6.7 Annual average concentrations of lead in the
ambient air in 2003–2013 at selected stations
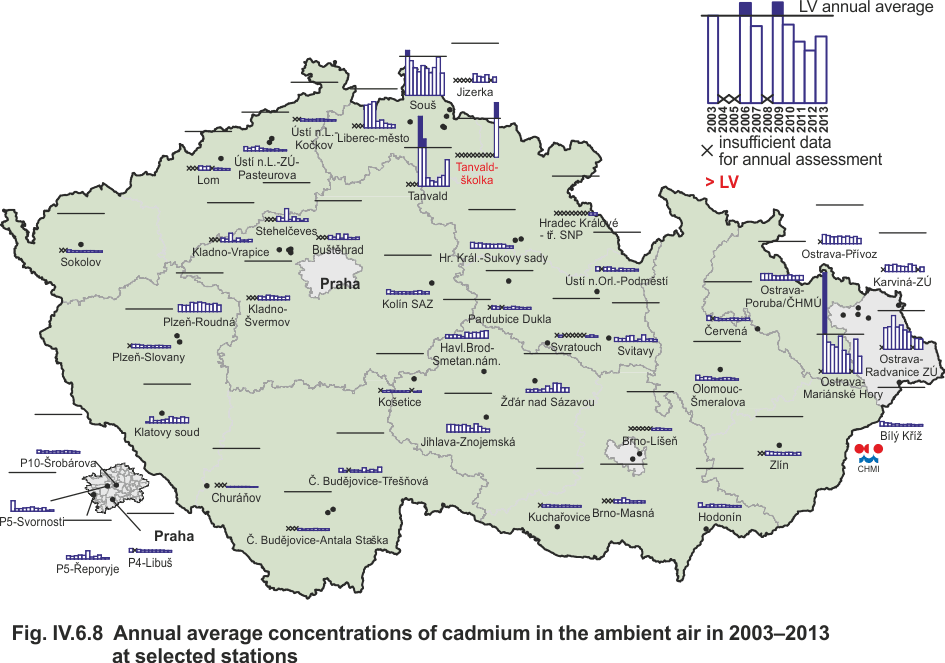
Fig. IV.6.8 Annual average concentrations of cadmium in the
ambient air in 2003–2013 at selected stations
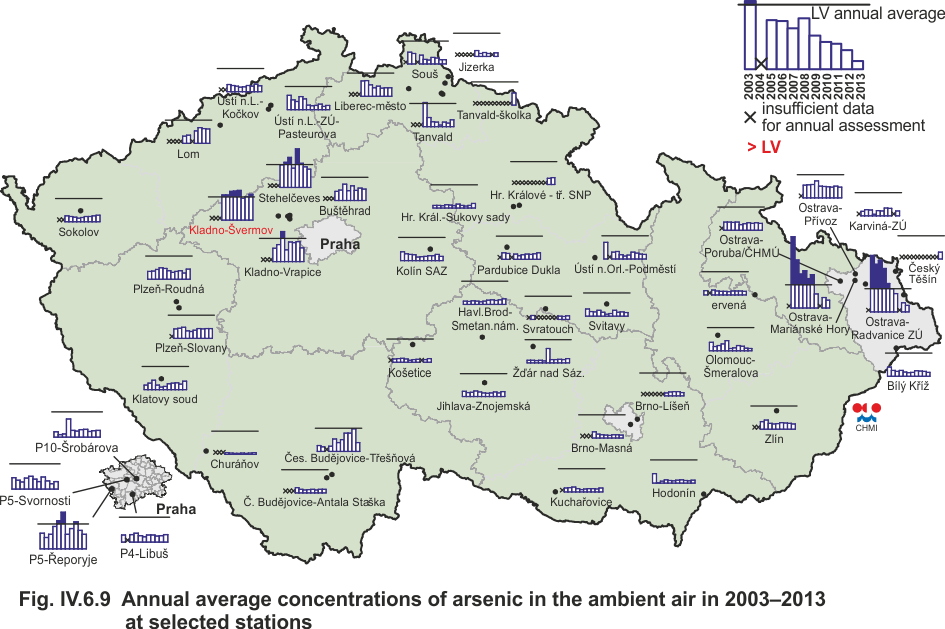
Fig. IV.6.9 Annual average concentrations of arsenic in the
ambient air in 2003–2013 at selected stations
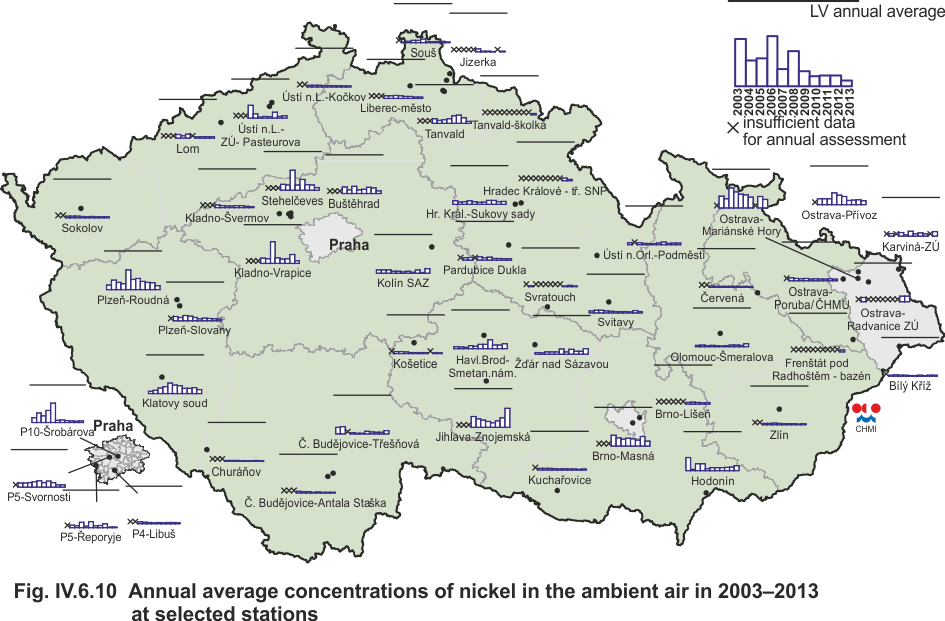
Fig. IV.6.10 Annual average concentrations of nickel in the
ambient air in 2003–2013 at selected stations
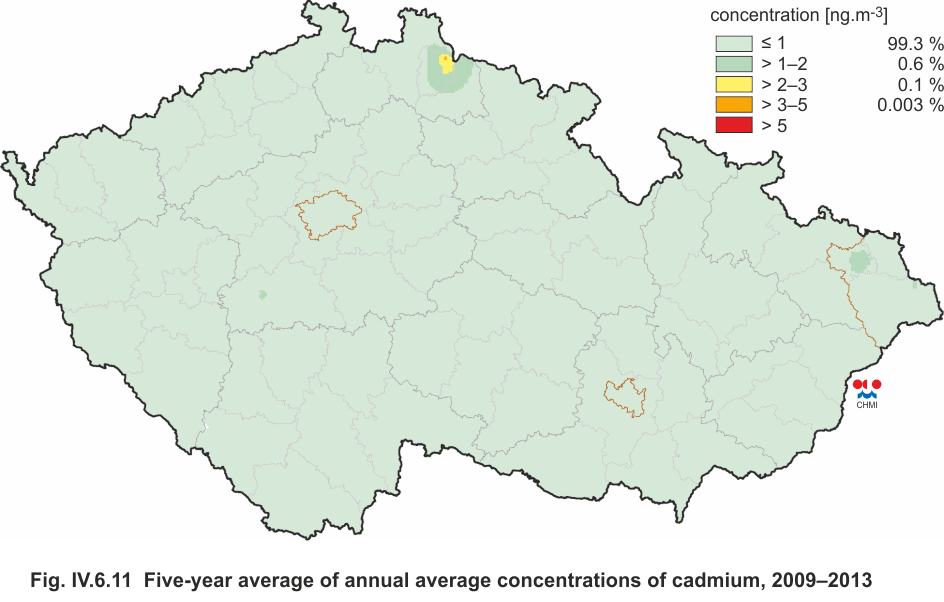
Fig. IV.6.11 Five-year average of annual average
concentrations of cadmium, 2009–2013
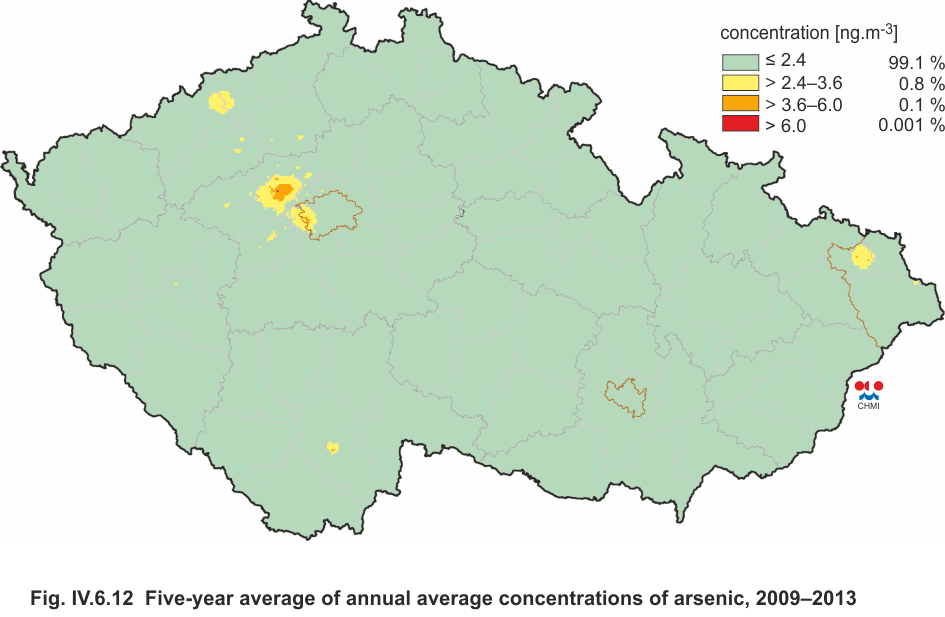
Fig. IV.6.12 Five-year average of annual average
concentrations of arsenic, 2009–2013
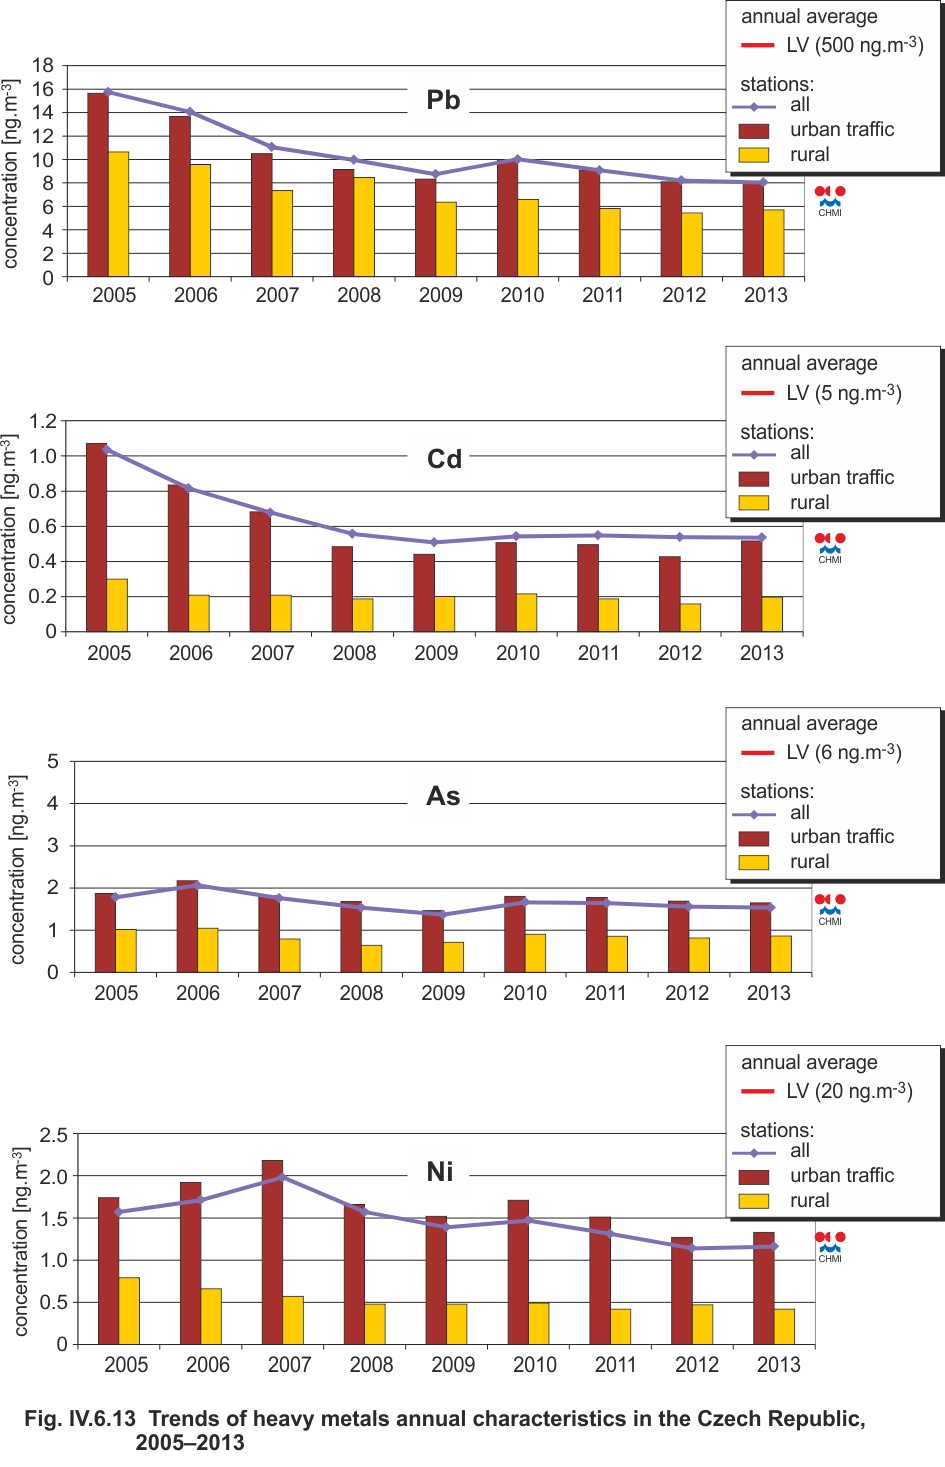
Fig. IV.6.13 Trends of heavy metals annual characteristics in the Czech Republic, 2005–2013
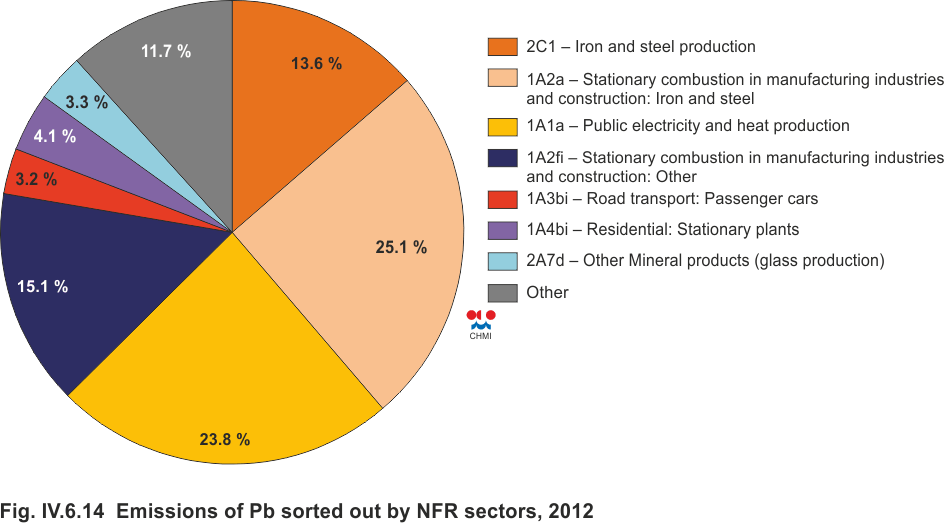
Fig. IV.6.14 Emissions of Pb sorted out by NFR sectors, 2012
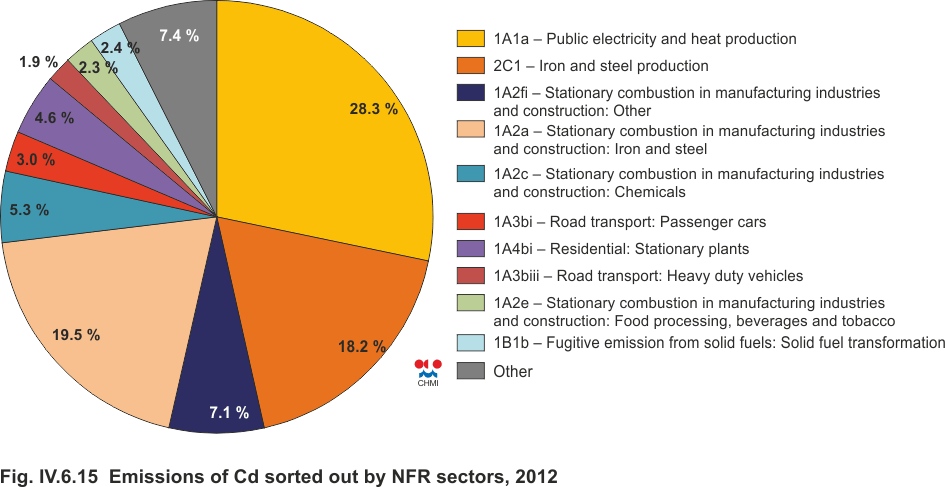
Fig. IV.6.15 Emissions of Cd sorted out by NFR sectors, 2012
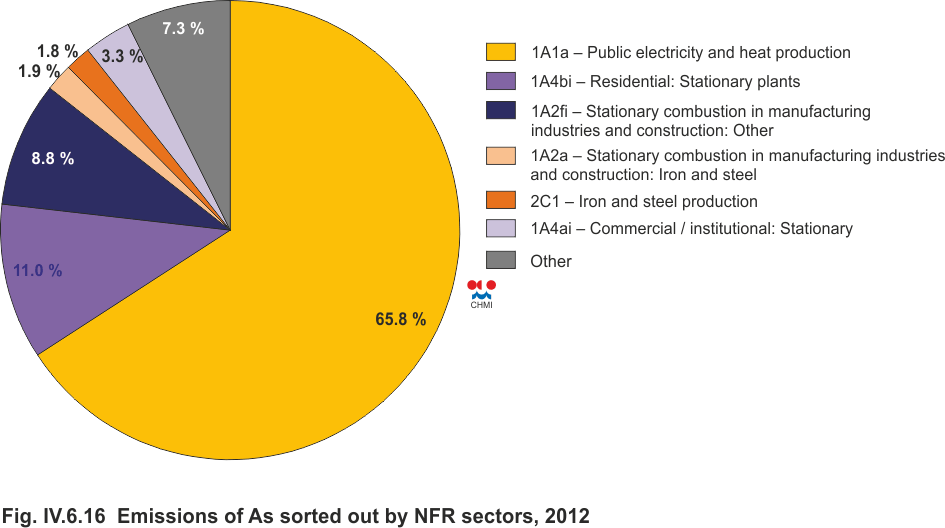
Fig. IV.6.16 Emissions of As sorted out by NFR sectors, 2012
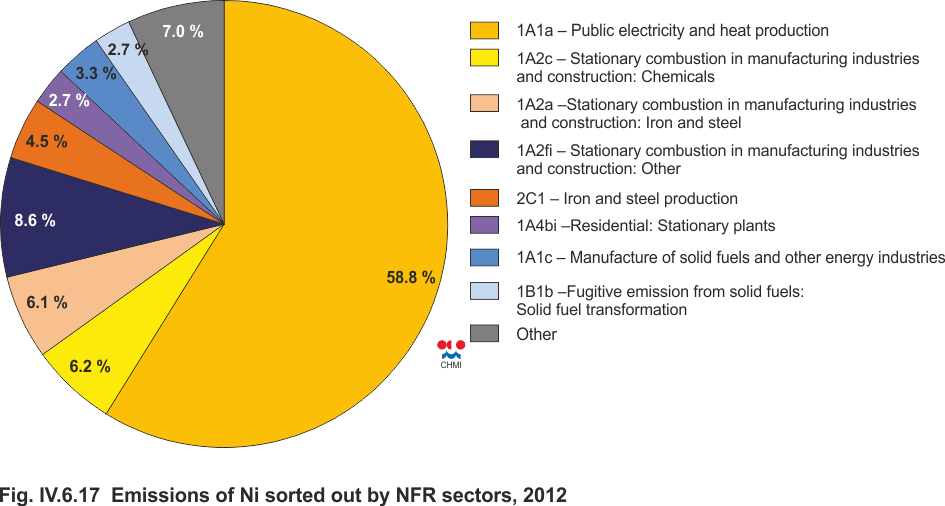
Fig. IV.6.17 Emissions of Ni sorted out by NFR sectors, 2012
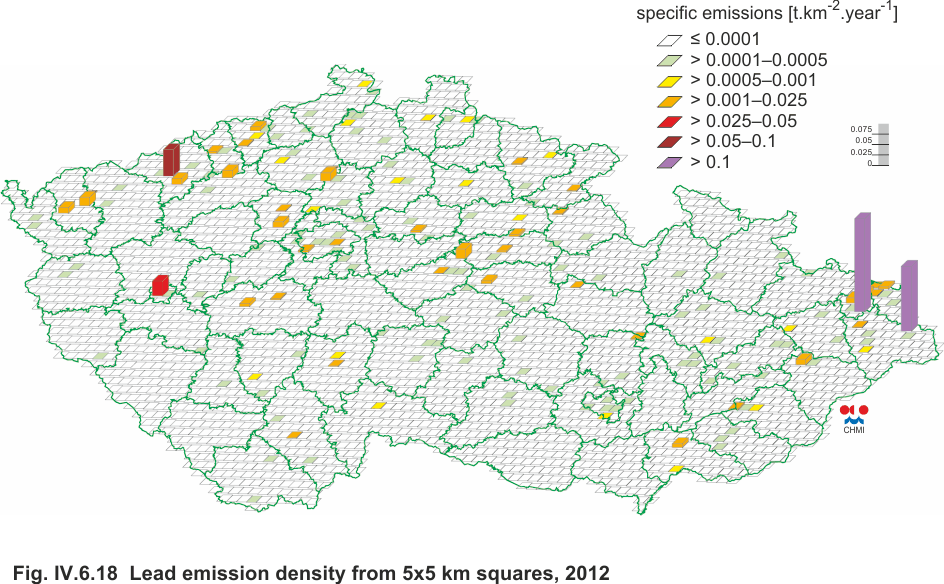
Fig. IV.6.18 Lead emission density from 5x5 km squares, 2012
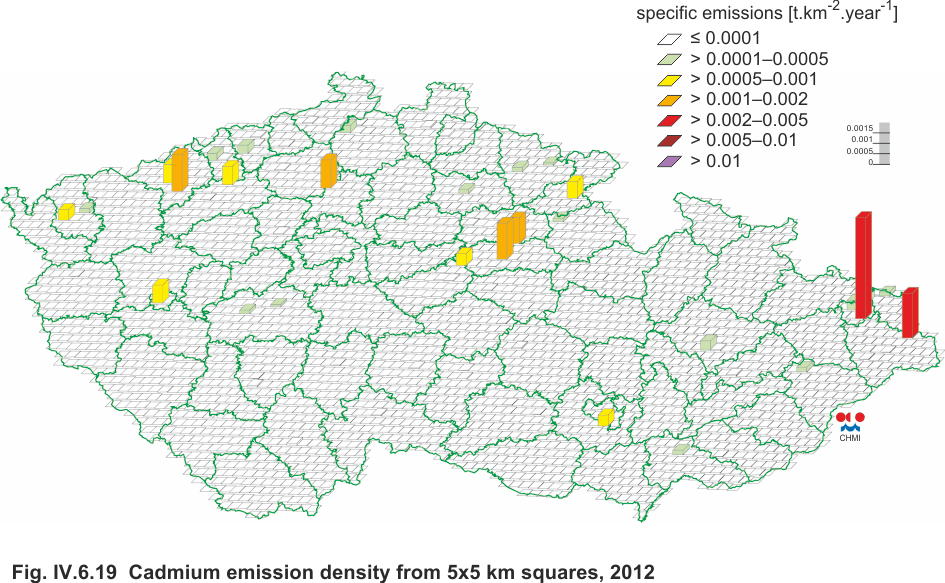
Fig. IV.6.19 Cadmium emission density from 5x5 km squares,
2012
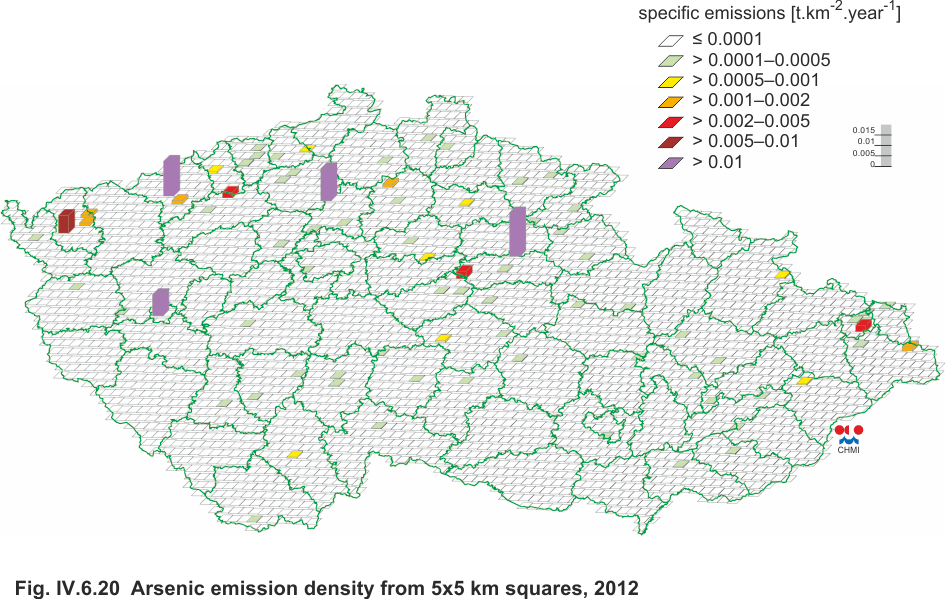
Fig. IV.6.20 Arsenic emission density from 5x5 km squares,
2012
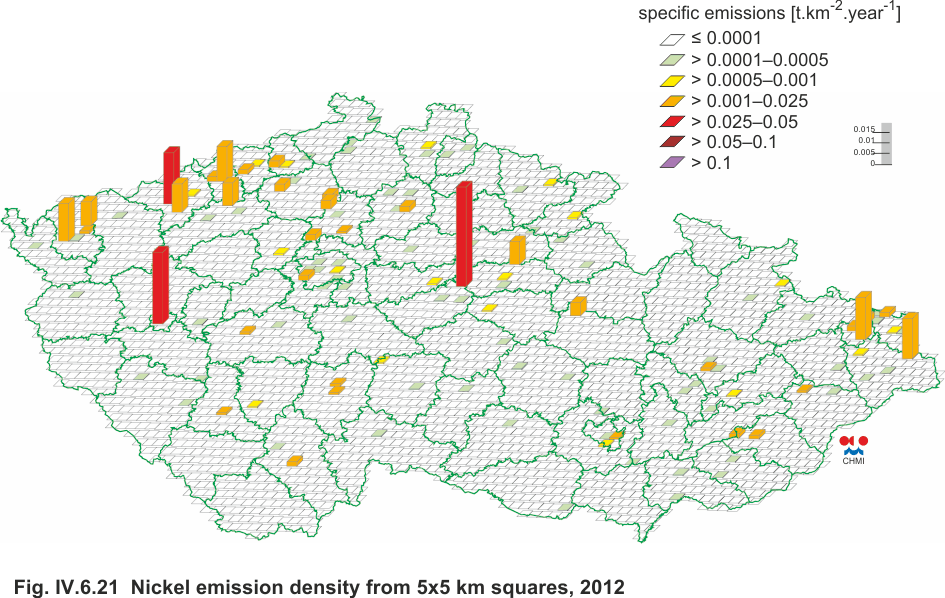
Fig IV.6.21 Nickel emission density from 5x5 km squares, 2012