| Fig. –1 |
Scheme of ISKO’s links to data sources and co-operating systems |
| Fig. 1.1 |
Total emissions of principal pollutants in the Czech Republic between 1990
and 2003 |
| Fig. 1.2 |
Fuel consumption in REZZO 3 sources, 1992–2003 |
| Fig. 1.3 |
Changes in residential heating in 2003 as compared to 1991 |
| Fig. 1.4 |
Particulate emission density from 5x5 km squares, 2002 |
| Fig. 1.5 |
Sulphur dioxide emission density from 5x5 km squares, 2002 |
| Fig. 1.6 |
Nitrogen oxide emission density from 5x5 km squares, 2002 |
| Fig. 1.7 |
CO emission density from 5x5 km squares, 2002 |
| Fig. 2.1.1 |
Major station networks of ambient air quality monitoring, 2003 |
| Fig. 2.1.2 |
Monitoring of principal pollutants in selected organisations – development |
| Fig. 2.2.1 |
4th highest 24-hour concentrations and annual average concentrations of SO2
in 1992–2003 at selected stations |
| Fig. 2.2.2 |
Field of the 4th highest 24-hour concentration of SO2 in 2003 |
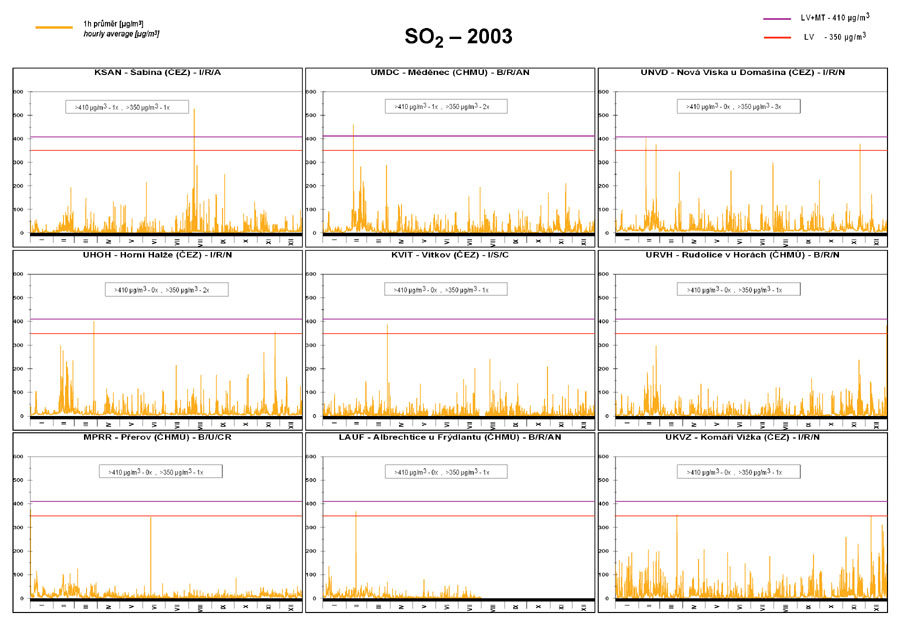
| Fig. 2.2.3 |
Stations with the highest hourly concentrations of SO2 in 2003 |
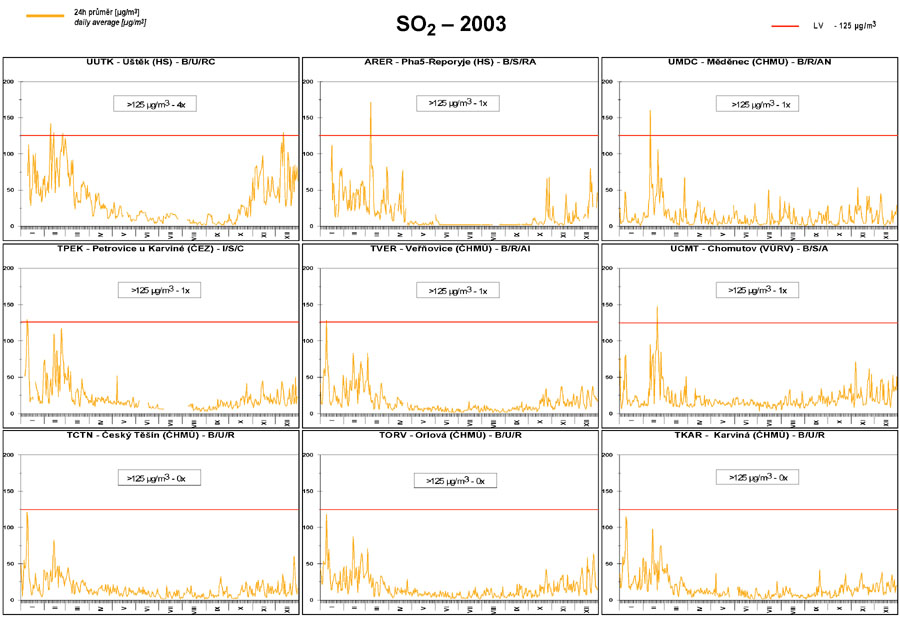
| Fig. 2.2.4 |
Stations with the highest 24-hour concentrations of SO2 in 2003 |
| Fig. 2.2.5 |
36th highest 24-hour concentrations and annual average concentrations of
PM10 in 1994–2003 at selected stations |
| Fig. 2.2.6 |
Field of the 36th highest 24-hour concentration of PM10 in 2003 |
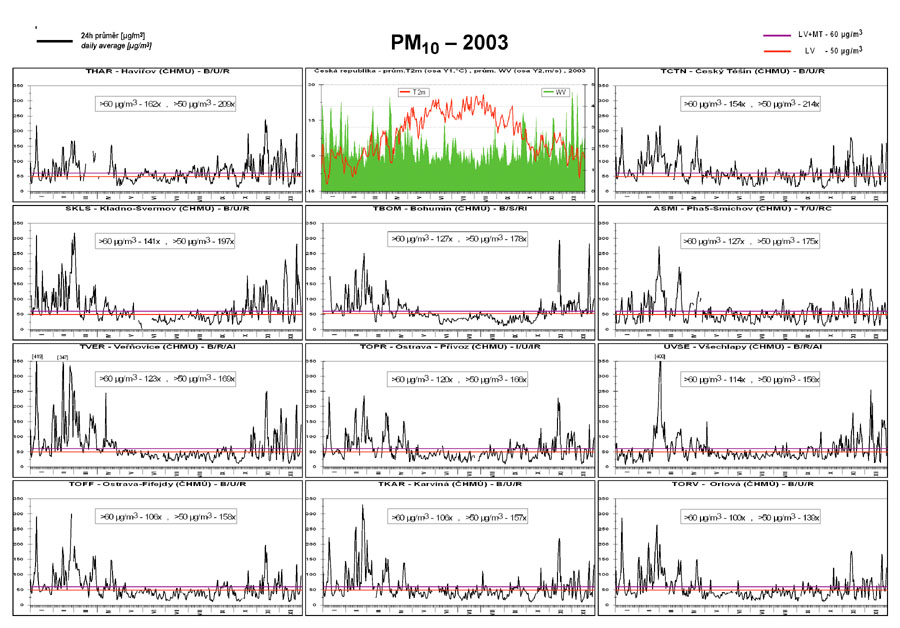
| Fig. 2.2.7 |
Field of annual average concentration of PM10 in 2003 |
| Fig. 2.2.8 |
Stations with the highest exceedence of LV+MT for 24-hour concentrations of
PM10 in 2003 |
| Fig. 2.2.9 |
19th highest hourly concentrations and annual average concentrations of NO2
in 1992–2003 at selected stations |
| Fig. 2.2.10 |
Field of annual average concentration of NO2 in 2003 |
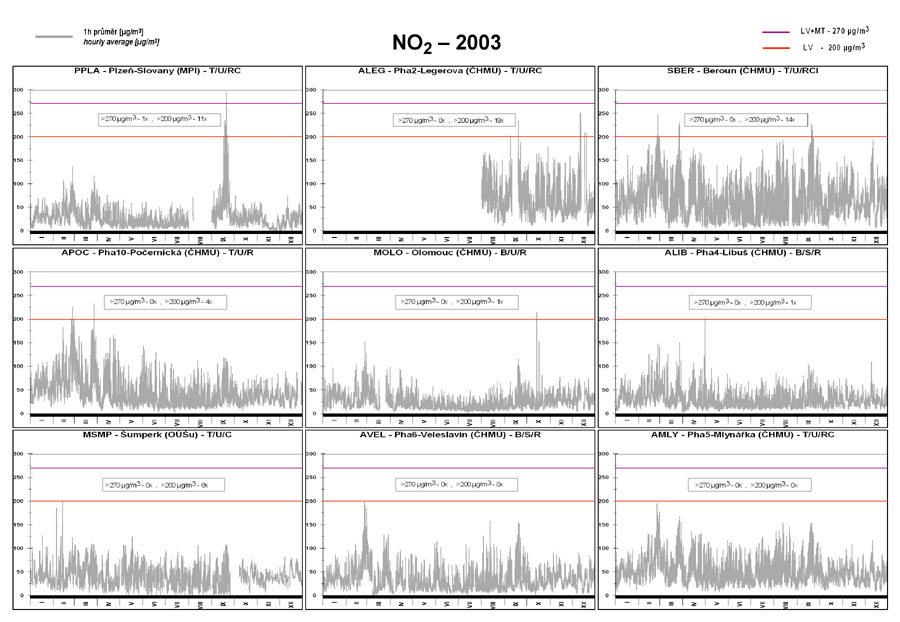
| Fig. 2.2.11 |
Stations with the highest hourly concentrations of NO2 in 2003 |
| Fig. 2.2.12 |
Annual average concentrations of lead in the ambient air in 1992–2003 at
selected stations |
| Fig. 2.2.13 |
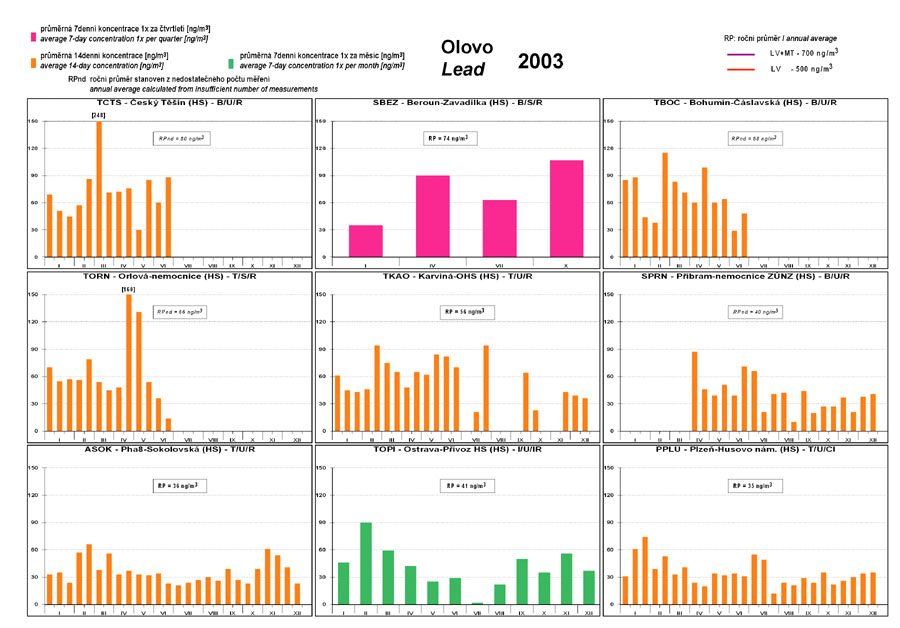
7/14-day average concentrations of lead in the ambient air at selected
stations in 2003 |
| Fig. 2.2.14 |
Maximum 8-hour moving average concentrations of CO in 1994–2003 at selected
stations |
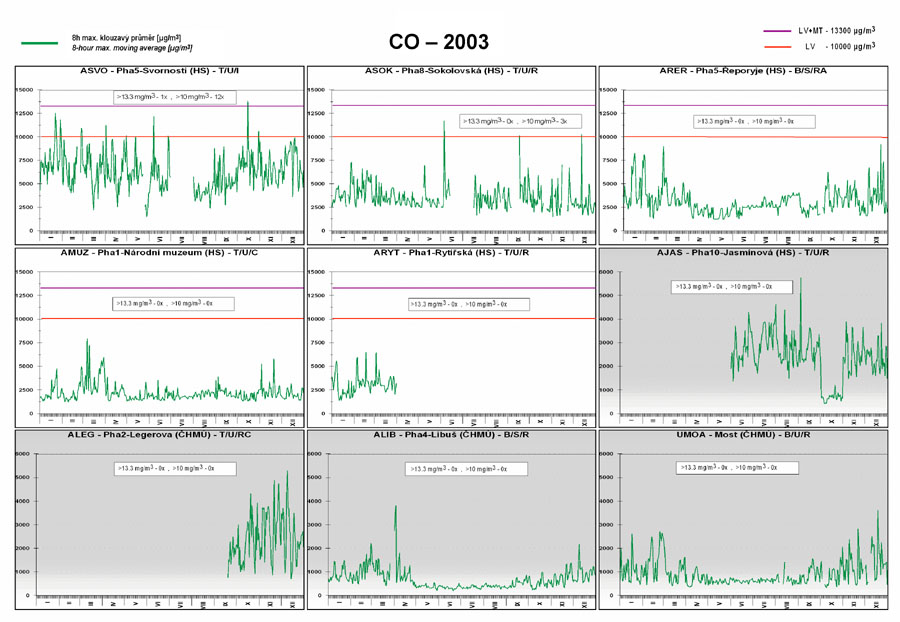
| Fig. 2.2.15 |
Stations with the highest values of maximum 8-hour moving average
concentrations of CO in 2003 |
| Fig. 2.2.16 |
Annual average concentrations of benzene in 1999–2003 at selected stations |
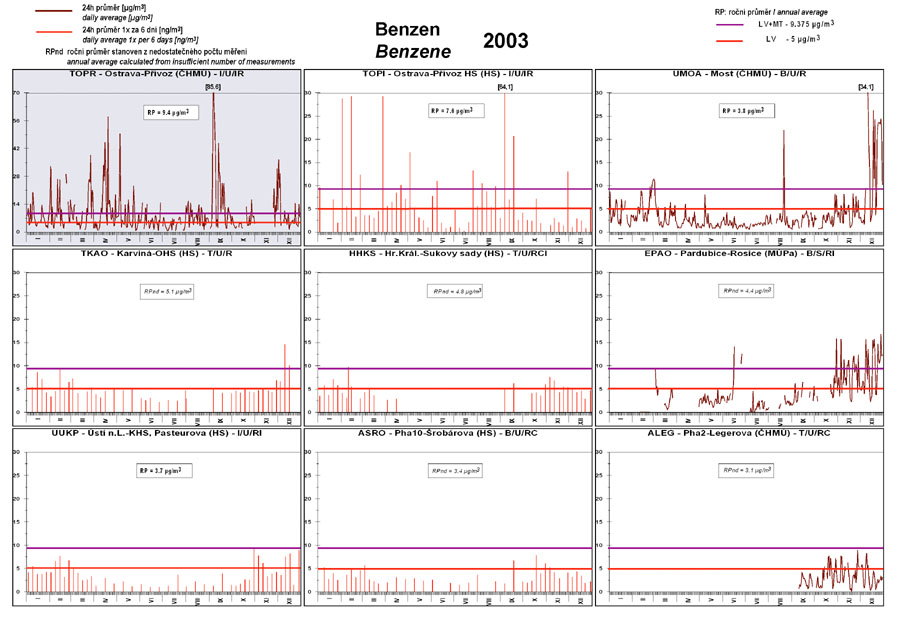
| Fig. 2.2.17 |
24-hour concentrations at the stations with the highest annual benzene
concentrations in 2003 |
| Fig. 2.2.18 |
26th highest values of maximum 8-hour moving average of ozone concentrations
(three-year average) in 1992–2003 at selected stations |
| Fig. 2.2.19 |
Field of the 26th highest maximum daily 8-hour moving average of ozone
concentration in three-year average, 2001–2003 |
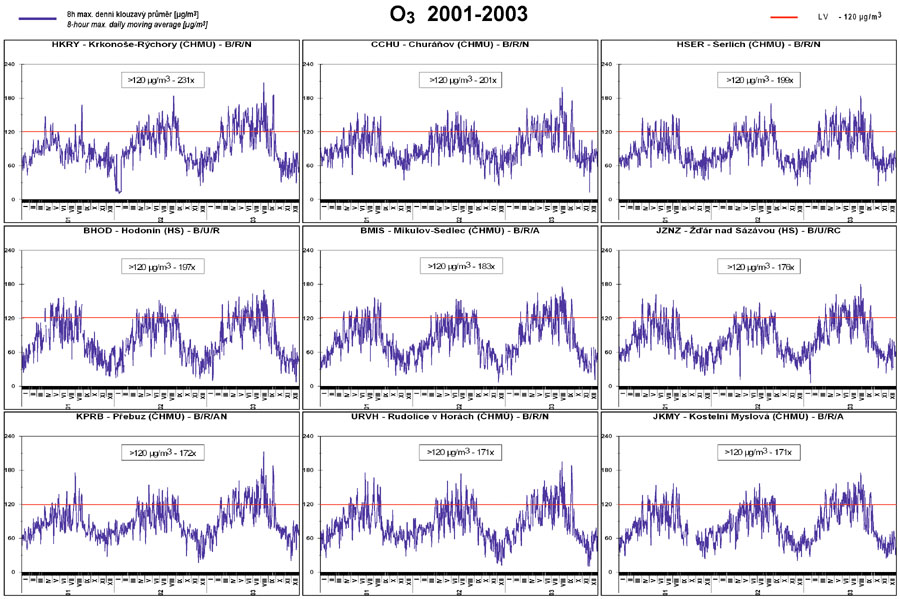
| Fig. 2.2.20 |
Stations with the highest values of maximum daily 8-hour moving average
concentrations of ozone in 2001-2003 |
| Fig. 2.2.21 |
Annual average concentrations of cadmium in the ambient air in 1992–2003 at
selected stations |
| Fig. 2.2.22 |
Field of annual average concentration of cadmium in the ambient air in 2003 |
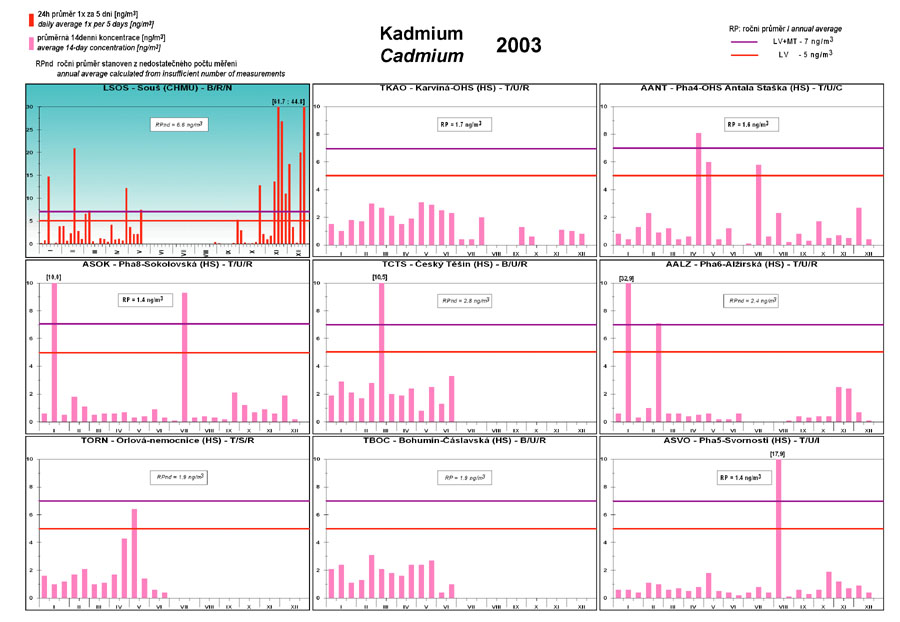
| Fig. 2.2.23 |
1/14-day average concentrations of cadmium in the ambient air at selected
stations in 2003 |
| Fig. 2.2.24 |
Annual average concentrations of arsenic in the ambient air in 1992–2003 at
selected stations |
| Fig. 2.2.25 |
Field of annual average concentration of arsenic in the ambient air in 2003 |
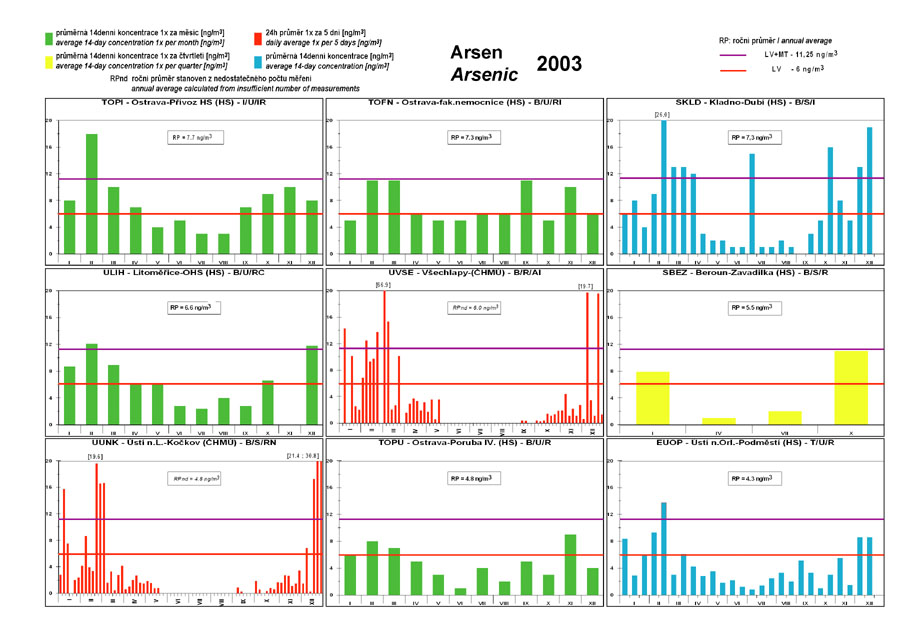
| Fig. 2.2.26 |
1/14-day average concentrations of arsenic in the ambient air at selected
stations in 2003 |
| Fig. 2.2.27 |
Annual average concentrations of nickel in the ambient air in 1992–2003 at
selected stations |
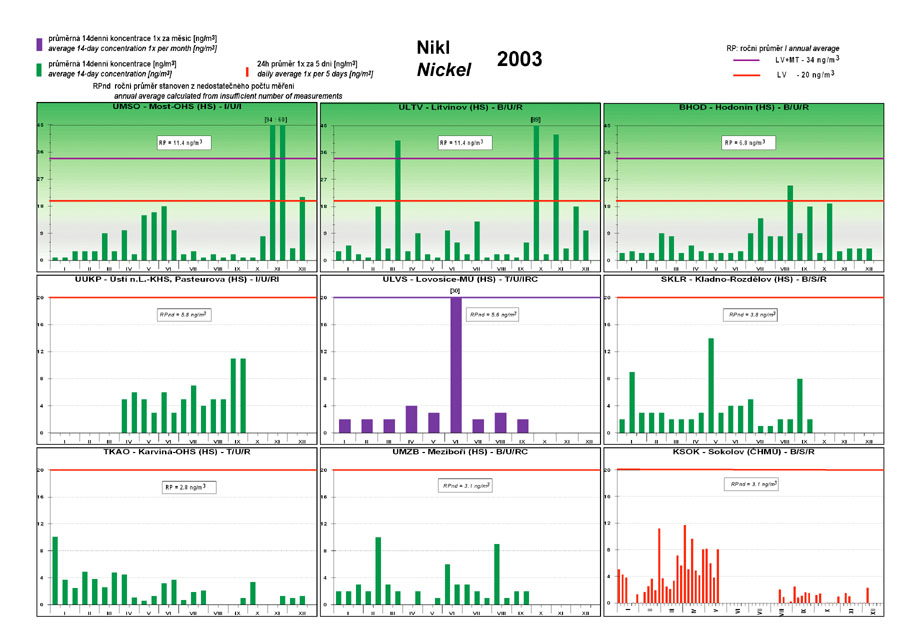
| Fig. 2.2.28 |
1/14-day average concentrations of nickel in the ambient air at selected
stations in 2003 |
| Fig. 2.2.29 |
Annual average concentrations of benzo(a)pyrene in 1997–2003 at selected
stations |
| Fig. 2.2.30 |
Field of annual average concentration of benzo(a)pyrene in the ambient air
in 2003 |
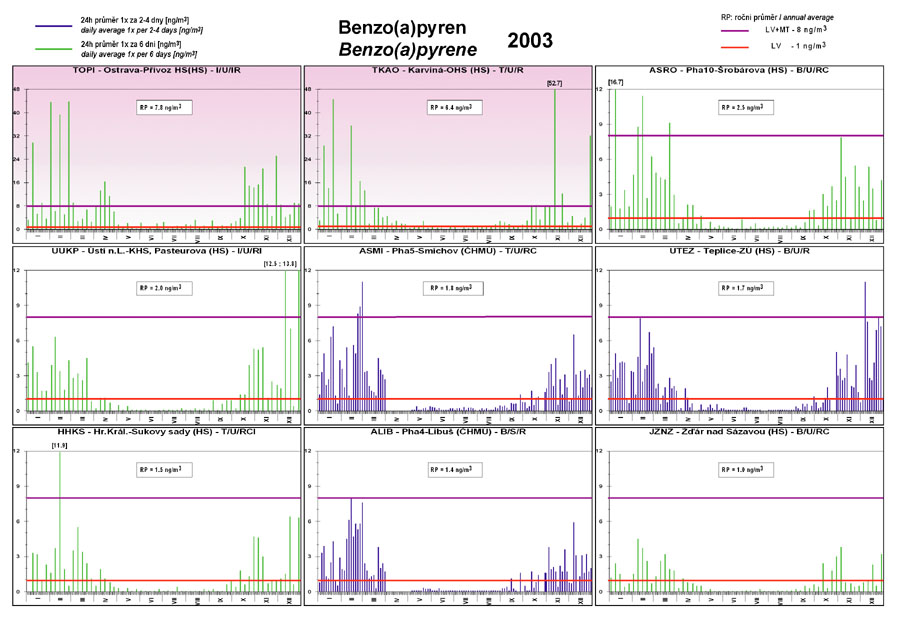
| Fig. 2.2.31 |
24-hour concentrations at the stations with the highest annual
concentrations of benzo(a)pyrene in 2003 |
| Fig. 2.2.32 |
Trends of SO2, PM10, NO2 and O3 annual characteristics in the Czech Republic,
1994–2003 |
| Fig. 2.2.33 |
Trends of SO2, PM10 and NO2 annual characteristics in agglomerations,
1994–2003 |
| Fig. 2.2.34 |
Areas/administrative units with deteriorated air quality with regard to
health protection limit values, ozone excluded, 2003 |
| Fig. 2.2.35 |
Areas/administrative units with deteriorated air quality with regard to
health protection limit values incl. ozone, 2003 |
| Fig. 2.2.36 |
Winter average concentrations of SO2 in 1992/1993–2003/2004 at selected
stations |
| Fig. 2.2.37 |
Field of average concentration of SO2 in the winter period 2003/2004 |
| Fig. 2.2.38 |
Annual average concentrations of NOx in 1992–2003 at selected stations |
| Fig. 2.2.39 |
Field of annual average concentration of NOx in 2003 |
| Fig. 2.2.40 |
AOT40 values of ozone in 1995–2003 at selected stations |
| Fig. 2.2.41 |
Field of AOT40 value of ozone, average of 5 years 1999 - 2003 |
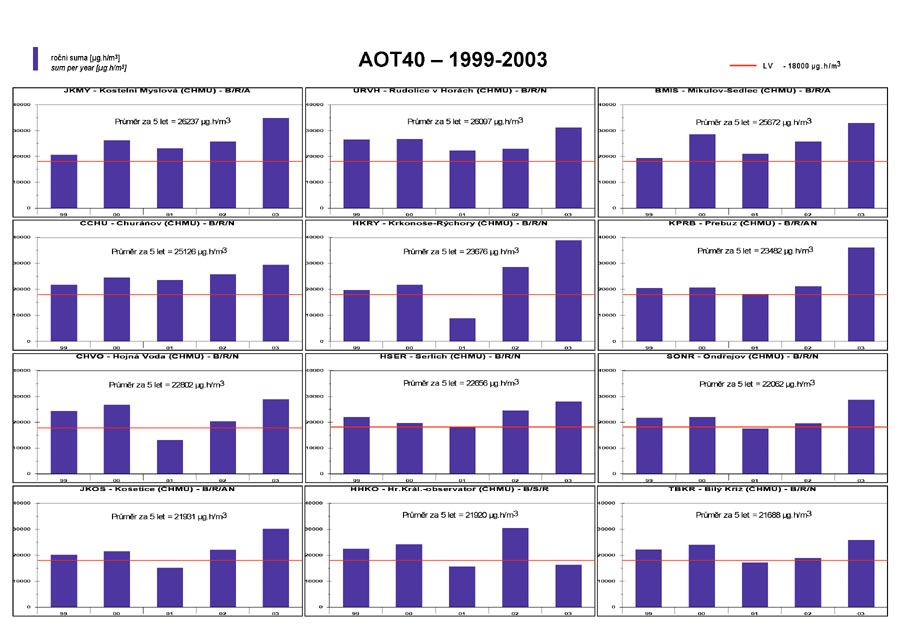
| Fig. 2.2.42 |
Stations with the highest AOT40 values in recent 5 years, 1999–2003 |
| Fig. 2.2.43 |
Areas with deteriorated air quality with regard to SO2 and NOx limit values
for the protection of ecosystems/vegetation, 2003 |
| Fig. 2.2.44 |
Areas with deteriorated air quality for ecosystems/vegetation, exceedence of
limit value AOT40, 2003 |
| Fig. 2.3.1 |
Course of maximum daily temperatures, their long-term average and daily
total precipitation at Prague-Libuš station. Occurrence of ozone
concentrations exceeding 180 μg.m-3 on the territory of the Czech Republic.
1. 4. 2003–30. 9. 2003 |
| Fig. 2.3.2 |
Maximum hourly concentrations of ground-level ozone on the territory of the
Czech Republic, 12 August 2003 |
| Fig. 2.3.3 |
Spatial distribution of maximum hourly concentrations of ground-level ozone
on the territory of the Czech Republic, 12 August 2003 |
| Fig. 2.3.4 |
Maximum hourly concentrations of ground-level ozone in Prague, 12 August 2003 |
| Fig. 2.3.5 |
Maximum hourly concentrations of ground-level ozone on the territory of the
Czech Republic, 13 August 2003 |
| Fig. 2.3.6 |
Spatial distribution of maximum hourly concentrations of ground-level ozone
on the territory of the Czech Republic, 13 August 2003 |
| Fig. 2.3.7 |
Maximum hourly concentrations of ground-level ozone in Prague, 13 August 2003 |
| Fig. 2.3.8 |
Maximum hourly concentrations of ground-level ozone on the territory of the
Czech Republic, 14 August 2003 |
| Fig. 2.3.9 |
Spatial distribution of maximum hourly concentrations of ground-level ozone
on the territory of the Czech Republic, 14 August 2003 |
| Fig. 2.3.10 |
Maximum hourly concentrations of ground-level ozone in Prague, 14 August 2003 |
| Fig. 2.3.11 |
Analysis of air temperatures at the level of 850 hPa, 10–15 August 2003 |
| Fig. 3.1 |
Station networks monitoring precipitation quality and atmospheric deposition, 2003 |
| Fig. 3.2 |
Fields of annual wet deposition of sulphur (SO42- - S), 2003 |
| Fig. 3.3 |
Fields of annual dry deposition of sulphur (SO2 - S), 2003 |
| Fig. 3.4 |
Fields of annual total deposition of sulphur, 2003 |
| Fig. 3.5 |
Fields of annual throughfall deposition of sulphur, 2003 |
| Fig. 3.6 |
Fields of annual wet deposition of nitrogen (NO3- - N), 2003 |
| Fig. 3.7 |
Fields of annual wet deposition of nitrogen (NH4+ - N), 2003 |
| Fig. 3.8 |
Fields of annual total wet deposition of nitrogen, 2003 |
| Fig. 3.9 |
Fields of annual dry deposition of nitrogen (NOx - N), 2003 |
| Fig. 3.10 |
Fields of annual total deposition of nitrogen, 2003 |
| Fig. 3.11 |
Fields of annual wet deposition of hydrogen ions, 2003 |
| Fig. 3.12 |
Fields of annual dry deposition of hydrogen ions corresponding to SO2 and
NOx deposition, 2003 |
| Fig. 3.13 |
Fields of annual total deposition of hydrogen ions, 2003 |
| Fig. 3.14 |
Fields of annual wet deposition of fluoride ions, 2003 |
| Fig. 3.15 |
Fields of annual wet deposition of chloride ions, 2003 |
| Fig. 3.16 |
Fields of annual wet deposition of lead ions, 2003 |
| Fig. 3.17 |
Fields of annual dry deposition of lead, 2003 |
| Fig. 3.18 |
Fields of annual wet deposition of cadmium ions, 2003
|
| Fig. 3.19 |
Fields of annual dry deposition of cadmium, 2003 |
| Fig. 3.20 |
Fields of annual wet deposition of nickel ions, 2003 |
| Fig. 3.21 |
Annual wet deposition at selected stations between 1991 and 2003, the Czech
Republic |
| Fig. 3.22 |
Annual deposition of sulphur and oxidated forms of nitrogen in the Czech
Republic, 1995–2003 |