|
|
AIR POLLUTION IN THE CZECH REPUBLIC IN 2003 Czech Hydrometeorological Institute - Air Quality Protection Division |
|
|
|
|
2.2 Air quality assessment pursuant to the Regulation of the Government of the Czech Republic No. 350/2002 Coll. The extent of air pollution is objectively determined by monitoring pollutantsí concentrations in the ground layer of atmosphere within the network of measuring stations. Within air quality assessment there are compared mainly the recorded air pollution levels with the respective limit values, or with admissible exceedence frequencies of these limits which should not be further exceeded after the date in compliance with the legislation. On 1 June 2002 Clean Air Act No. 86/2002 Coll., amended later by 521/2002 Coll., 92/2004 Coll. and 186/2004 Coll., came into force, and on 14 August 2002 the Government Order No. 350/2002 Coll. setting forth limit values and procedures of monitoring, assessment, evaluation and management of air quality came into force. The new legislation fully reflects the requirements of the European Union set by the ambient air quality directives. This part of the Yearbook presents air quality assessment in the year 2003 with regard to the requirements of the new Czech legislation. Pursuant to the Clean Air Act the assessment is aimed mainly at defining the areas with deteriorated air quality, with regard to health protection and the protection of ecosystems and vegetation respectively. Air quality assessment pursuant to the new legislation reassumes the results and mainly methods developed within the research project VaV740/2/00 ďEvaluation of the Czech Republic Readiness to Meet Air Quality Requirements of EU Directives and the LRTAP ConventionĒ [9], especially in its stage aimed at the classification of the territory reflecting the requirements set by the newly introduced national legislation. The evaluation was based on the standards and requirements on air quality assessment set by the Council Directive 96/62/EC [10] on ambient air quality assessment and management and the follow-up Directive 99/30/EC [11] relating to limit values for sulphur dioxide, nitrogen dioxide and oxides of nitrogen, PM10 and lead in ambient air, Directive 2000/69/EC [12] of December 2000, setting up the limit values for carbon monoxide and benzene, and finally on the Directive 2002/3/EC [13] setting up the limit values for ozone. The Government Order introduces also the limit value for ammonia, arsenic, cadmium, nickel, mercury, benzo(a)pyrene and dustfall. Dustfall assessment cannot be carried out for the lack of data. Similarly, the assessment of air pollution caused by benzene, benzo(a)pyrene and primarily ammonia and mercury has faced the same problem so far. The complete results of the solution of the project VaV/740/2/00 were uploaded on the CHMI websites. The new air quality directives require that the member states should divide their territories into zones and agglomerations while the zones are understood as basic units for air quality management. The directives specify namely the requirements for the assessment ‚Äď the classification of the zones with regard to air quality. The Clean Air Act covers this issue in par. 7 dealing with special air quality protection. Article 1 introduces the term ďareas with deteriorated air qualityĒ. These are areas with the exceedence of the values of one or more air pollution limits or of the target limit value for ozone, or the value of one or more limit values including the respective margins of tolerance. Special air quality protection is required in agglomerations, i.e. in inhabited areas with the population of at least 250 000, or the area with less inhabitants but where the density of population requires special measures on air quality protection and the necessity to assess and manage air quality in the area. Within the project VaV740/2/00 the agglomerations were proposed pursuant to the Directive 96/62/EC. The proposal is based on the number of inhabitants and on the results of the long-term air quality assessment (Table 2.2.1). The Prague and Brno agglomerations represent the areas where air pollution is connected mainly with high density of population, in the Ostrava agglomeration, covering the cities of Ostrava, Karvin√°, Hav√≠Ňôov, ńĆesk√Ĺ TńõŇ°√≠n and TŇôinec, and in the √öst√≠ nad Labem agglomeration, covering the belt of north-Bohemian industrial cities in the coal basin (√öst√≠ nad Labem, Dńõńć√≠n, Teplice, Most, Chomutov, Litv√≠nov, Kl√°Ň°terec nad OhŇô√≠ and KadaŇą) air pollution is influenced also by high concentration of industrial plants. Due to the delineation of agglomerations air quality assessment in these areas will be determined mainly on the basis of regular and quality measurements. In the areas not included into the category of deteriorated air quality, i. e. in the areas where no limit values are exceeded, it is necessary to ensure the maintenance of good air quality. This corresponds with one of the basic principles of the Directive 96/62/EC, which requires that the once reached complying air quality continues to be maintained in the future. For the areas with deteriorated air quality the Clean Air Act in its Article 6, par. 7 sets the obligation for the regional and local authorities to develop programs aimed at the improvement of air quality for those pollutants which show limit values and margins of tolerance exceedences (in case of ground-level ozone target air pollution limit values), with the aim to reach the limit values in the deadlines set in the implementing regulations. The definition of the areas in which air pollution limit values set by the Government Order are exceeded is a necessary prerequisite for the preparation of programs aimed at the improvement of air quality, or of the regulation rules at the regional and local levels in these areas. In accordance with the generally accepted interpretation in the member
countries, the areas delineation is primarily to be based on the administrative
division of the country to allow the areas, as administrative units, to meet the
requirements of the directives for air quality assessment, reporting to the
Commission, and air quality management. 2.2.1 Mapping air quality characteristics required by the legislation The adopted legislation takes over general approaches of air quality
assessment and potential exceedences of the set limit values in the zones from
the Framework Directive 96/62/EC for air quality management with the aim to
reach, in the set deadlines, air quality complying with the air pollution limit
values and target air pollution limit values. The Directive specifies that in
areas over the UAT, measurement is decisive for determining pollution levels.
Pollution levels must be determined for the whole zone rather than covering the
mere surroundings of the station. The problem of air quality assessment in zones
‚Äď particularly identifying and locating areas within the zone in which limit
values may be exceeded, based on station measurements ‚Äď therefore becomes a
problem of estimating (throughout the zone) the distribution of air quality; it
consists in how to generalise ďpointĒ measurements, given the particular density
of stations and an acceptable error of the estimate, to the entire zone under
review. The spatial coverage of measurements can be increased by validation
measurements. However, the ambient air quality directive and consequently, the
national legislation, do not stipulate measurements any longer as the only tool
for determining levels in a zone, and envisages ‚Äď depending on pollution levels
‚Äď the use of modelling techniques and expert estimates and their combinations.
An advantage of modelling is that in comparison with point measurements it
better reflects the coverage of the area under review; nevertheless, models are
generally regarded as less accurate than measurements. Under modelling mainly
causal dispersion and transport models are understood, including chemical
transformations of the pollutants. An important role is played also by empirical,
mathematical-statistical models of the estimate of time or spatial distribution
of air pollution characteristics. As part of regular air quality assessment, the Air Quality Information System has been using various combinations of measurements and modelling for creating fields of ambient air pollution characteristics, and these techniques are being further improved. One of the important preconditions for creating fields of concentrations is a
careful selection of the measuring stations included in the assessment, from the
perspective of their use, classification and representativeness. Linear
regression of the dependence of the two approaches (modelling and measurement)
was applied when producing final information for map compilation in the
assimilation of modelled and measured data, while a modified version of IDW,
with the stationís weight and determination of its representative surroundings
factored in, was applied to create the resulting fields. The basic approach to
determine the degree of representativeness is station classification. Background
stations (rural or urban background) with a high degree of representativeness (dozens
of kilometres) are stations affected only by remote sources, while to describe
local conditions also such stations exposed to traffic and industry are taken
into account the least area of representativeness of which is directly affected
by local sources. The details of the mapping procedures of the respective air pollution
characteristics for the pollutants set in the directives 99/30/EC (SO2,
suspended particles ‚Äď PM10 fraction, NO2 and NOx, lead), 2000/69/EC (CO and
benzene) and 2002/3/EC (ozone) were published in the reports on the above
project VaV740/2/00. Mapping procedures of air pollution characteristics of
further substances required by the new legislation (cadmium, arsenic, nickel,
mercury and benzo(a)pyrene), including further development of mapping air
pollution characteristics of PM10 and benzene were solved within the CHMI
project VaV/740/3/02 ďIntegrated air quality assessment and management with
regard to the daughter directives on heavy metals, PAHs, PM10 and benzeneĒ. 2.2.2 Air quality with regard to health protection limit values In accordance with the EU legislative documents on air quality the Czech legislation sets the limit values aimed at health protection derived from the WHO recommendation. The national legislation requires to monitor and assess the following pollutants, as substances manifesting evident harmful effects on the health of the population, with regard to the health protection limit values:
The survey of the limit values, margins of tolerance for the protection of health, and UAT and LAT according to the Government Ordershows the Table 2.2.2. These limit values, including the UAT and LAT have been set by the legislation as the levels for air quality assessment. The maps and charts presented below use the indication of the respective limit values as shown in Table 2.2.2. The following assessment of individual pollutants relevant for health protection is presented in the order corresponding with the above list. It is documented mainly by the tables showing the stations with the highest values of air pollution characteristics required by the legislation for the given pollutants. The shades of the background in the tables indicate:
If the number of stations where the limit value, or the limit value incl. the margin of tolerance, was exceeded, is lower than 10, 10 stations with the highest values of the respective air pollution characteristics are presented. Further, maps depicting the development of the respective characteristics in the period 1992‚Äď2003 are presented. The 2003 exceedence of the limit value increased by the margin of tolerance is marked with red names of the stations. If in 2003 any characteristic of the respective pollutant was exceeded, also maps depicting the spatial distribution of the characteristic are presented. These maps show also the stations classified according to their type and marked with colour symbols in correspondence with the classes of the levels measured at the presented stations. For the stations and air pollution characteristics, where the number of exceedences incl. the margin of tolerance was higher than it is allowed, the courses of 24-hour or hourly concentrations in 2003 are presented for the indication of the period of the year during which the limit values were exceeded. In 2003 this chapter is concluded by two graphs showing the trends of the
characteristics of selected pollutants in agglomerations and in the Czech
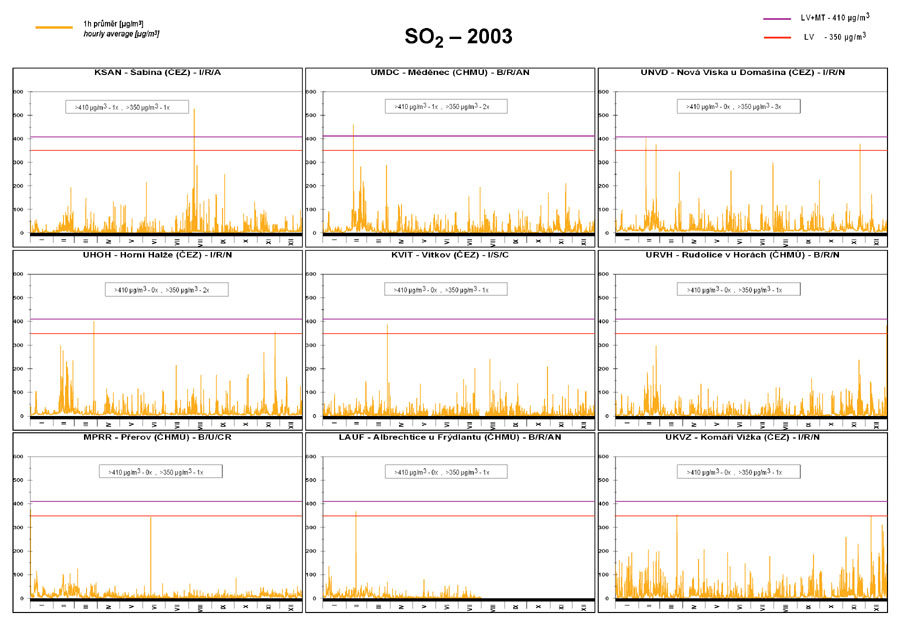
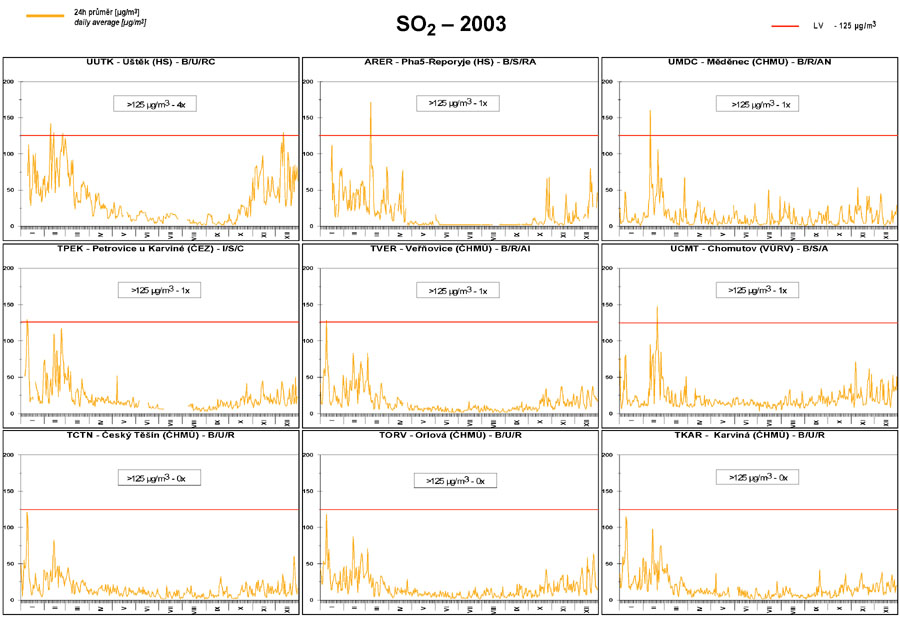
Republic in the period of 1994‚Äď2003. 2.2.2.1 Sulphur dioxide The 2003 situation of air pollution caused by SO2 with regard to the limit values set by the new legislation is documented by the Tables 2.2.3, 2.2.4 and Figs. 2.2.1, 2.2.2, 2.2.3, 2.2.4. It is evident from Figs. 2.2.1 and 2.2.4 that in 2003 the set limit value for 24-hour SO2 concentration 125 őľg.m-3 was exceeded more than 3x at the Public Health Service station √öŇ°tńõk. The annual SO2 limit value was not exceeded at any station in 2003. Similarly, no station reported the exceedence of the allowed number of exceedences of hourly SO2 concentrations (500 őľg.m-3). The highest number of exceedences of the hourly limit value was recorded at Nov√° V√≠ska u DomaŇ°√≠na (3x), Mńõdńõnec (2x) and Horn√≠ HalŇĺe (2x) stations. The map diagrams in Fig. 2.2.1 show the distinct improvement of air quality resulting from the significant decrease of SO2 concentrations documented by the marked decline of the 4th highest 24-hour SO2 concentration at all stations after the year 1997. In 2003 there occurred very slight increase in SO2 pollution in several areas of the Czech Republic caused probably by more intensive solid fuels burning. Figs. 2.2.3 and mainly 2.2.4 should, in compliance with the requirements of the Framework Directive, document the limit values exceedence episodes. Fig. 2.2.4 confirms the last yearís situation in the environs of the Public Health Service station √öŇ°tńõk. In 2003 the 24-hour concentrations exceeded the set limit value of 125 őľg.m-3 in 4 cases. Fig. 2.2.2, presenting the spatial distribution of the 4th highest 24-hour
SO2 concentrations, and the Tables 2.2.2 and
2.2.4 show that in 2003 the air
pollution caused by SO2 did not exceed, with the exception of the Public Health
Service station √öŇ°tńõk, where local influence can be expected, the limit values
for the protection of health. With the above exception the pollution caused by
SO2 is not the reason to list any part of the territory among the areas with
deteriorated air quality. Tab. 2.2.4 Stations with the highest numbers of exceedences of the 24-hour limit value (pLV) of SO2 Tab. 2.2.5 Stations with the highest values of annual average concentrations of SO2 Fig. 2.2.1 4th highest 24-hour concentrations and annual average concentrations of SO2 in 1992‚Äď2003 at selected stations
Fig. 2.2.2 Field of the 4th highest 24-hour concentration of SO2 in 2003
Fig. 2.2.3 Stations with the highest hourly concentrations of SO2 in 2003
Fig. 2.2.4 Stations with the highest 24-hour concentrations of SO2 in 2003
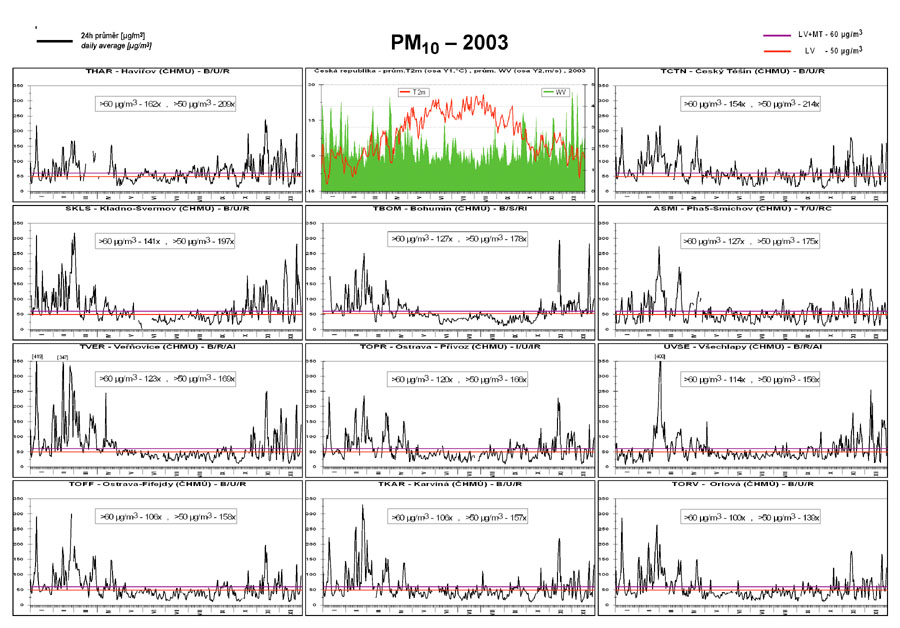
2.2.2.2 Suspended particles, PM10 fraction Air pollution caused by PM10, as shown in the Tables 2.2.6 and 2.2.7, similarly as in Fig. 2.2.5, remains one of the main problems of air quality assurance with regard to the requirements and deadlines of the new legislation and the respective EU directive. Fig. 2.2.5 shows the increasing trend of PM10 pollution at almost all stations in the Czech Republic which started in 2001. The limit value of 24-hour PM10 concentration increased by the margin of tolerance was exceeded more than 35x in 2003, and namely at the stations in the Moravian-Silesian Region: Hav√≠Ňôov, ńĆesk√Ĺ TńõŇ°√≠n, Bohum√≠n, VńõŇôŇąovice, Ostrava-PŇô√≠voz, Ostrava-Fifejdy, Karvin√° and Orlov√°, and at the stations in the following regions: Central Bohemian Region (Kladno-҆vermov and Mlad√° Boleslav); Prague Region (Sm√≠chov, n√°m. Republiky, Riegrovy sady and Pońćernick√°); √öst√≠ nad Labem Region (√öst√≠ n.L.-Mńõsto and Chomutov). Of the total number of 92 stations at which PM10 measurements are carried out, 68 stations reported exceedences of 24-hour PM10 limit value in more than is the tolerated number of exceedences, and 55 of them reported also exceedences of the limit value including the margins of tolerance. The annual PM10 limit value was exceeded at 41 stations, 30 of them exceeded also the margin of tolerance. The number of stations at which both above air pollution characteristics of PM10 fraction exceeded the limit values and the margin of tolerance increased in 2003. Figs. 2.2.6 and 2.2.7 show that PM10 limit value exceedences are significant for listing the basic administrative units among the areas with deteriorated air quality. Limit values for 24-hour PM10 concentrations were exceeded more than 35x mainly in Moravian-Silesian, √öst√≠ nad Labem, Central Bohemian and Olomouc Regions and in Prague also in 2003. Fig. 2.2.6 shows quite evidently that in the towns where the PM10 measurements are carried out the result concentrations of this pollutant are above the limit value. However, it can be admitted that in the towns without PM10 measurements the concentrations exceed the limit value as well. The model application is difficult in this case as the model calculations include only the emissions from primary sources. The significant share in PM10 pollution is contributed by secondary particles and re-suspended particles, not included in the emissions from the primary sources. The areas where PM10 concentrations exceed the respective limit values represent almost 11.5 % of the territory of the Czech Republic with more than 37 % of the total population. The shown values confirm the increasing trend in air pollution caused by PM10 which started in 2001 and was emphasized in the dry year of 2003 with very low precipitation. The courses of 24-hour concentrations in 2003 at the stations, where the
limit value including the margin of tolerance was exceeded, are shown in
Fig.
2.2.8. The selection of 11 stations with the greatest number of LV+ MT
exceedences includes 8 stations from the Moravian-Silesian Region. The figure
also shows the annual course of the average daily temperature in 2 meters above
the ground (T2m) and the average daily wind velocities (WV). In the 2003 results
there is a significant opposite seasonal course between PM10 concentration and
the temperature. Wind velocity above 3 m.s-1 also results in the decline of PM10
concentrations. Tab. 2.2.6 Stations with the highest numbers of exceedences of the 24-hour limit value of PM10 Tab. 2.2.7 Stations with the highest values of annual average concentrations of PM10 Fig. 2.2.5 36th highest 24-hour concentrations and annual average concentrations of PM10 in 1994‚Äď2003 at selected stations
Fig. 2.2.6 Field of the 36th highest 24-hour concentration of PM10 in 2003
Fig. 2.2.7 Field of annual average concentration of PM10 in 2003
Fig. 2.2.8 Stations with the highest exceedence of LV+MT for 24-hour concentrations of PM10 in 2003
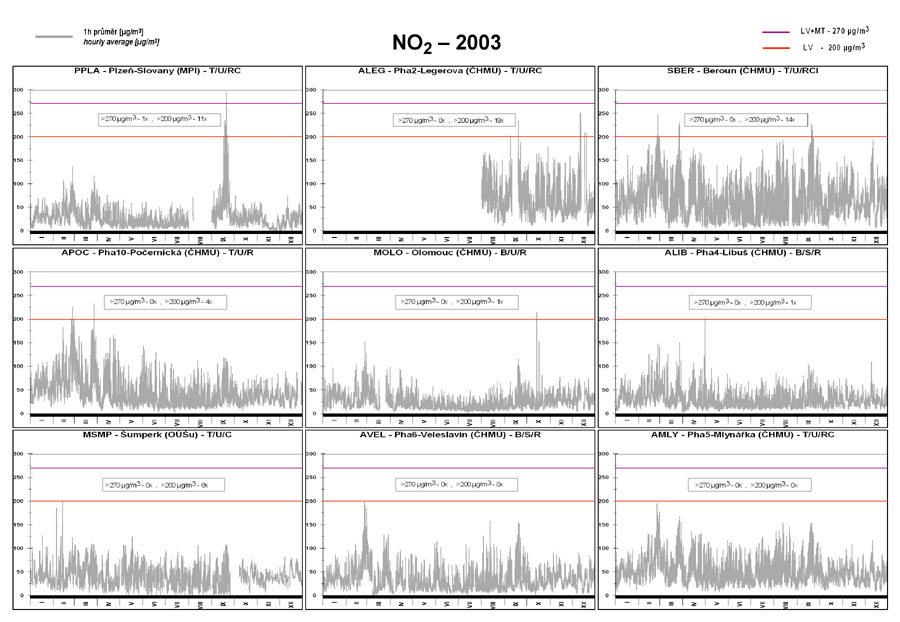
2.2.2.3 Nitrogen dioxide The exceedence of annual limit values for NO2 occurred only in limited number of localities exposed to traffic in agglomerations and large cities. Of the total number of 109 stations at which NO2 was monitored in 2003 the annual limit value of 40 őľg.m-3 was exceeded at the station in Beroun and at 7 stations in Prague (Mlyn√°Ňôka, VrŇ°ovice, Sm√≠chov, n√°m. Republiky, Pońćernick√°, Bran√≠k and Vysońćany) and at the ҆umperk station. The margin of tolerance was exceeded at the Beroun station. Hourly concentrations of NO2 (Table 2.2.8) do not exceed the allowed exceedence frequency at any station. In 2003 the highest value of the 19th maximum hourly NO2 concentration (296 őľg.m-3) was recorded at the station PlzeŇą-Slovany, Beroun (248 őľg.m-3) and Prague 10-Pońćernick√° (233 őľg.m-3). In 2003 the NO2 annual limit value and the margin of tolerance were exceeded at the Beroun station (63 őľg.m-3). The annual NO2 limit value is almost regularly exceeded mainly in Prague at the stations monitoring the effects of traffic on urban environment (Prague 5-Mlyn√°Ňôka, Prague 1-n√°m. Republiky, Prague 10-VrŇ°ovice, Prague 5-Sm√≠chov, Prague 10-Pońćernick√° and Prague 4-Bran√≠k, Table 2.2.9). At most stations presented in Fig. 2.2.9 both the annual average concentration and the 19th highest hourly NO2 concentration had a moderately declining trend until 2001. In 2002 this trend stopped and in 2003 there was a slight increase of NO2 pollution at most localities, more significant at the traffic stations. The slight increase of NO2 concentrations was caused by rising fuel sales, and, consequently, by higher traffic emissions. The field of annual average NO2 concentration (Fig. 2.2.10) shows that there was a slight percentage increase, especially in the interval 26‚Äď40 őľg.m-3. Fig. 2.2.11 presents the courses of hourly concentrations in 2003 showing the
limit exceedences in the respective part of the year. The AMS Prague 2-Legerova,
established in August 2003 as a traffic ďhotspotĒ station monitoring the
communication with heavy traffic, showed the exceedence of the limit value in 19
cases. Tab. 2.2.8 Stations with the highest values of the 19th and maximum hourly concentrations of NO2 Tab. 2.2.9 Stations with the highest values of annual average concentrations of NO2 Fig. 2.2.9 19th highest hourly concentrations and annual average concentrations of NO2 in 1992‚Äď2003 at selected stations
Fig. 2.2.10 Field of annual average concentration of NO2 in 2003
Fig. 2.2.11 Stations with the highest hourly concentrations of NO2 in 2003
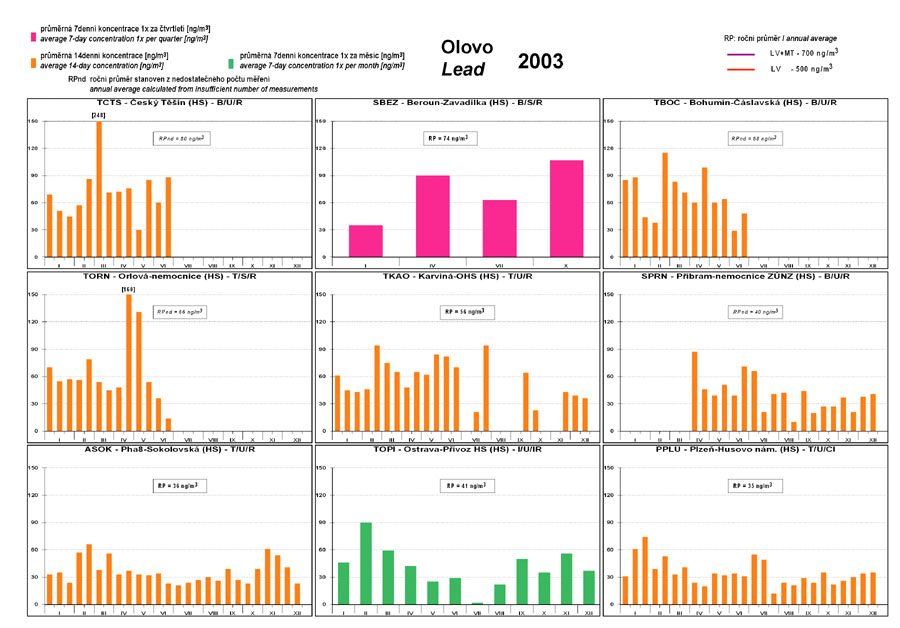
2.2.2.4 Lead Most lead contained in the atmosphere result from anthropogenic emissions caused by high-temperature processes, primarily the burning of fossil fuels, production of iron and steel and metallurgy of non-ferrous metals. Means of transport using leaded petrol represent a very significant source of anthropogenic emissions. In the natural processes lead is released through weathering of rocks and volcanic activity [14]. Airborne lead occurs in the form of fine particles with frequency particle size distribution characterized by the average aerodynamic diameter lower than 1 μm. The long-term exposure to lead results in harmful impacts on haem biosynthesis, nervous system and blood pressure in humans. The evidence for carcinogenic potential of lead and its compounds in humans is inadequate [14, 15]. None of the total number of 59 stations which submitted sufficient data for
the calculation of valid annual average in 2003 exceeded the set limit value.
The highest annual average concentration was reached at the station Beroun-Zavadilka,
and namely 73.8 ng.m-3. Table 2.2.10 shows that lead concentrations at all
stations are below the limit value and do not even reach the LAT (250 ng. m-3).
It is apparent from Fig. 2.2.12 that lead levels at the majority of stations do
not reach the limit value in the long terms. Courses of 7/14-day average
concentrations of lead at selected stations are presented Fig. 2.2.13. Fig. 2.2.12 Annual average concentrations of lead in the ambient air in 1992‚Äď2003 at selected stations
Fig. 2.2.13 7/14-day average concentrations of lead in the ambient air at selected stations in 2003
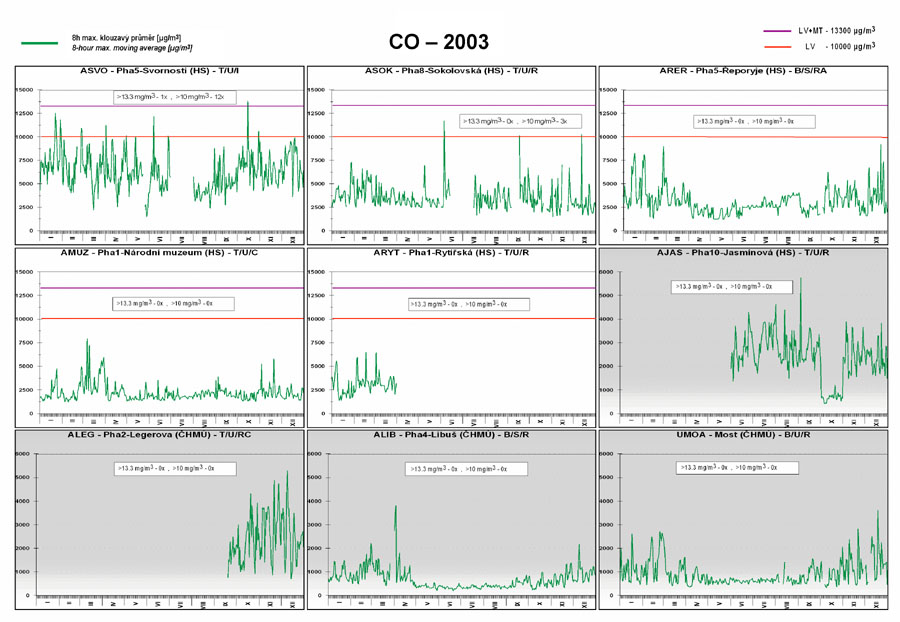
2.2.2.5 Carbon monoxide The insufficient burning of fossil fuels may be an anthropogenic source of air pollution caused by carbon monoxide. These processes occur mainly in transport and in stationary sources, namely household heating. In 2003, data for the calculation of the valid annual average of CO
concentration were obtained from 42 stations. Maximum 8-hour moving averages of
carbon monoxide (Table 2.2.11 and
Figs. 2.2.14 and 2.2.15) do not exceed the
limit values, with the exception of 2 Public Health Service stations: Prague
5-Svornosti, at which even the limit value incl. the margin of tolerance (LV+MT)
was exceeded, and Prague 8-Sokolovsk√°. With the exception of further two Public
Health Service stations the maximum daily 8-hour moving average at the remaining
stations did not reach the LAT. Fig. 2.2.14 Maximum 8-hour moving average concentrations of CO in 1994‚Äď2003 at selected stations
Fig. 2.2.15 Stations with the highest values of maximum 8-hour moving average concentrations of CO in 2003
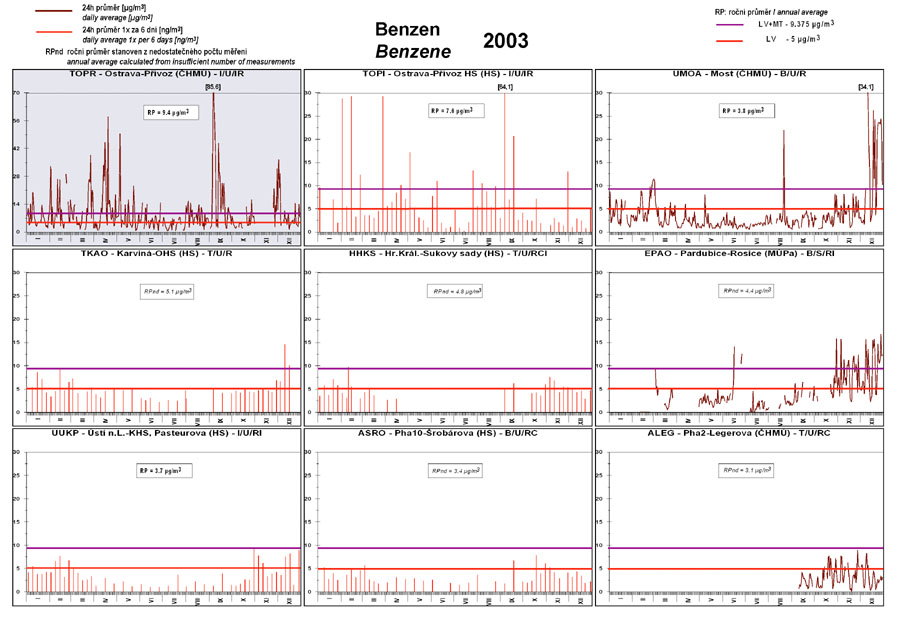
2.2.2.6 Benzene With the increasing intensity of road transport the monitoring of air pollution caused by aromatic hydrocarbons is becoming relevant. The decisive source of atmospheric emissions of aromatic hydrocarbons ‚Äď and namely of benzene and its alkyl derivates ‚Äď are above all exhaust gases of petrol motor vehicles. Another source are loss evaporative emissions produced during petrol handling, storing and distribution. Mobile sources emissions account for approx. 85 % of total aromatic hydrocarbons emissions, while the prevailing share is represented by exhaust emissions. It is estimated that the remaining 15 % of emissions come from stationary sources. Many of these are related to industries producing aromatic hydrocarbons and those industries that use these compounds to produce other chemicals. The obtained data illustrate that benzene level in petrol is about 1.5 % while diesel fuels contain relatively insignificant levels of benzene. Exhaust benzene is produced primarily by unburned benzene from fuels. Non-benzene aromatics in the fuels can cause 70 to 80 % of the exhaust benzene formed. Some benzene also forms from engine combustion of non-aromatic fuel hydrocarbons. The most significant adverse effects from exposure to benzene are haematotoxicity and carcinogenicity [16]. Recent assessment based on measurement results indicate that limit values of
benzene concentrations are exceeded in Ostrava (Fig. 2.2.16), mainly as the
result of emissions from coking plants. The situation of the year 2003 is
characterized in the Table 2.2.12. Of the total number of 17 stations monitoring
benzene concentrations in 2003 the limit value was exceeded only at two stations
in Ostrava (Ostrava-PŇô√≠voz and Ostrava-PŇô√≠voz-HS). The valid annual average was
calculated for six stations only due to the fact that the measurements pursuant
to the legislation were started only in 2003 at several stations. Fig. 2.2.16 Annual average concentrations of benzene in 1999‚Äď2003 at selected stations
Fig. 2.2.17 24-hour concentrations at the stations with the highest annual benzene concentrations in 2003
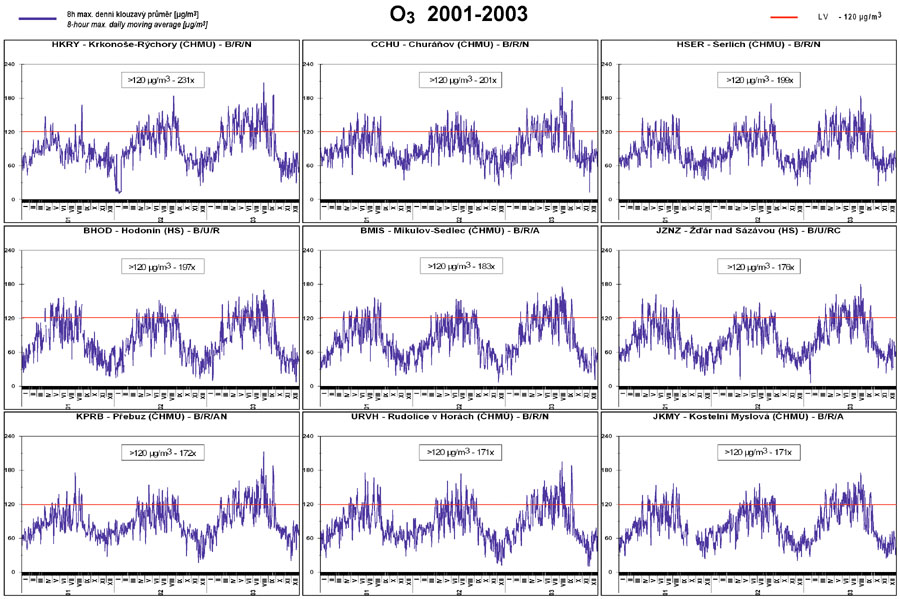
2.2.2.7 Ground-level ozone Ground-level ozone is formed under the influence of solar radiation during complex photochemical reactions mainly between nitrogen oxides, VOCs (mainly hydrocarbons) and other components of the atmosphere. Ground-level ozone is a secondary pollutant as its primary emitting from anthropogenic air pollution sources is not substantial. In 2003 the air pollution target value was exceeded at 43 stations, out of 53 stations which submitted valid data (Table 2.2.13). High ozone concentrations and limit exceedences at most station were recorded as a result of long period with high temperatures, intensive solar radiation and draught in the 2003 summer period. This exceptional situation was observed practically in the whole of Europe. Map diagram in Fig. 2.2.18 shows the 26th highest value of maximum 8-hour moving average of ozone concentrations (three-year average) in 1992‚Äď2003. The target air pollution limit value for the protection of health was exceeded in 94 % of the Czech RepublicĎs territory in 2003 (Fig. 2.2.19). Table 2.2.13 presents the stations with the highest values of maximum daily 8-hour moving average ozone concentrations in three-year average as required by the legislation. Besides, these values are shown also for the respective calendar years (2001, 2002 and 2003). The comparison of the values shows that the highest values were reached in 2003 (considering the meteorological conditions). Table 2.2.14 presents the number of hours of the ozone alert threshold exceedence (180 μg.m-3) at selected AIM stations in the period of 1992‚Äď2003. Fig. 2.2.18 26th highest values of maximum 8-hour moving average of ozone concentrations (three-year average) in 1992‚Äď2003 at selected stations
Fig. 2.2.19 Field of the 26th highest maximum daily 8-hour moving average of ozone concentration in three-year average, 2001‚Äď2003
Fig. 2.2.20 Stations with the highest values of maximum daily 8-hour moving average concentrations of ozone in 2001-2003
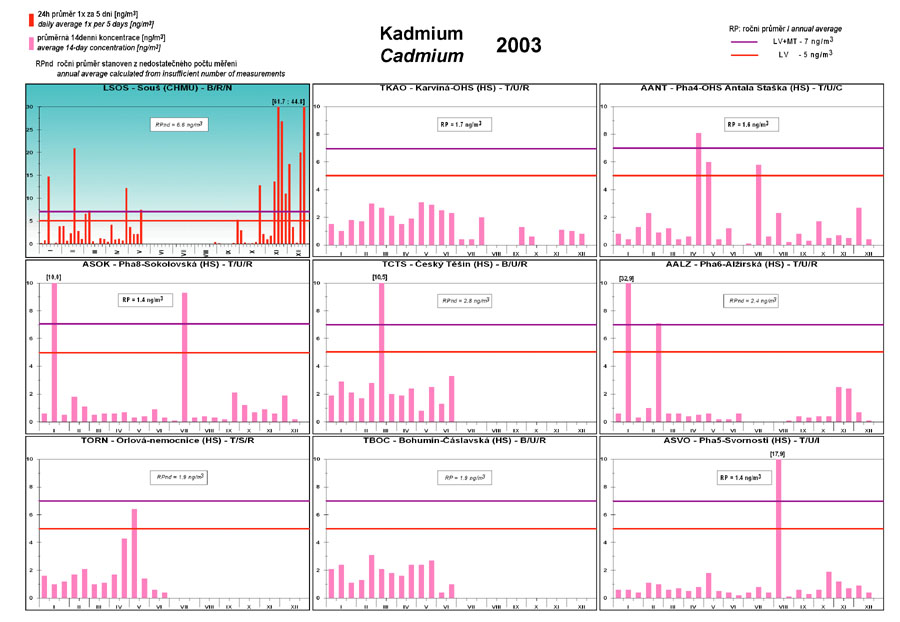
2.2.2.8 Cadmium Globally, the natural sources of cadmium represent about 10 % of which 50 % are caused by volcanic activity and 90 % by anthropogenic sources (mainly iron and steel production, metallurgy of non-ferrous metals, refuse incineration and fossil fuels combustion (brown coal, hard coal and heavy fuel oils) [17]. Emission from transport are less significant. Cadmium is bound mainly to the fine particles (aerodynamic diameter up to 2.5 μm), with higher risk of negative effects on human health. Almost all cadmium is bound to particles up to 10 μm, while the minimum amount of cadmium is found in particles with diameter above 10 μm. The kidney is the critical organ with respect to long-term exposure to cadmium. Its carcinogenic effects are evident in experimental animals and there has been limited evidence in humans so far [15, 17]. In 2003, the limit value 5 ng.m-3 as the annual average concentration was not exceeded at any station of the total number o 83 (16 CHMI and 67 Public Health Service, Fig. 2.2.21). The stations Tanvald and SouŇ° with long-term increased cadmium concentrations
did not submit sufficient data in 2003 for the calculation of the valid annual
average. The expertise estimate based on the measured data, however, shows high
probability of the limit value exceedence at SouŇ° also in 2003. The 2003 cadmium
concentration courses (daily or 14-day, depending on the measuring cycle at
selected stations) are shown in Fig. 2.2.23. The courses at the stations HS PŇô√≠bram, Ostrava-fak. nemocnice and Ostrava-Poruba IV are not included as their
values remained below the margin of detection during the whole monitored period. Fig. 2.2.21 Annual average concentrations of cadmium in the ambient air in 1992‚Äď2003 at selected stations
Fig. 2.2.22 Field of annual average concentration of cadmium in the ambient air in 2003
Fig. 2.2.23 1/14-day average concentrations of cadmium in the ambient air at selected stations in 2003
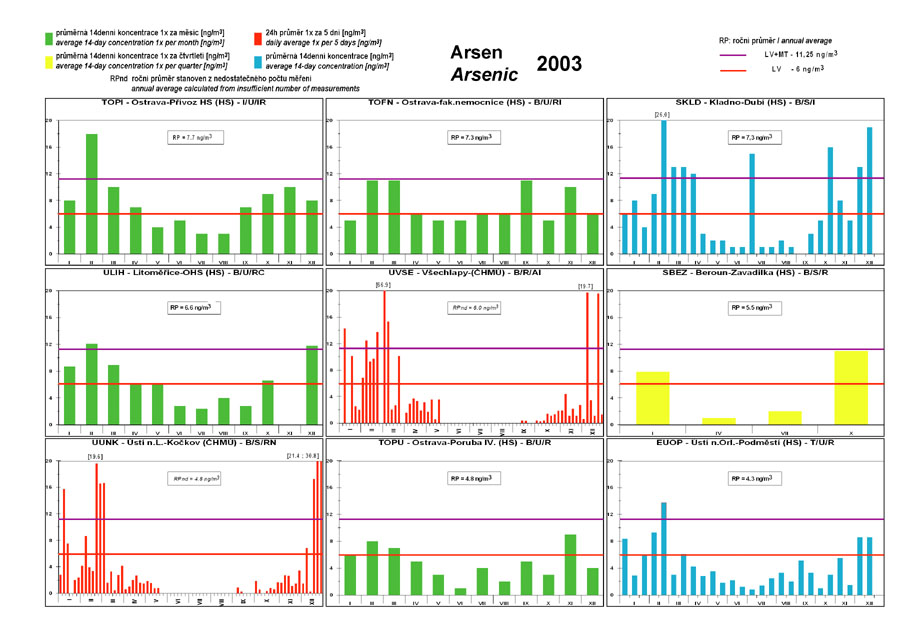
2.2.2.9 Arsenic Arsenic occurs in many forms of inorganic and organic compounds. The natural sources of arsenic represent about 25 % of the total emissions [17] and they include mainly volcanic activity; emissions released from vegetation are less significant. Anthropogenic sources include mainly combustion processes (brown coal, hard coal and heavy fuel oils), iron and steel industry and production of copper and zinc. Arsenic occurs largely in fine fractions (aerodynamic diameter up to 2.5 μm), which can be transported over long distances and can penetrate deeply into the respiratory system. Almost all arsenic is bound to particles with aerodynamic diameter up to 10 μm [17]. Inorganic arsenic can cause acute, subacute or chronic effects (local or affecting the whole organism). Lung cancer can be considered the critical effect following inhalation exposure [15, 17]. Of the total number of 83 (1 CHMI and 67 Public Health Service) stations which submitted valid data for 2003 the limit value was exceeded at four stations (Ostrava-pŇô√≠voz HS, Kladno-Dub√≠, Ostrava fak. nemocnice and LitomńõŇôice-OHS, see Table 2.2.16). The courses of short-term (1/14-day) average arsenic concentrations (Fig.
2.2.26) show, even more distinctively than in lead, the seasonal character of
the short-time arsenic concentrations in the ambient air and confirm the
significant arsenic contribution from the burning of fossil fuels, especially in
the environs of the presented stations. Fig. 2.2.24 Annual average concentrations of arsenic in the ambient air in 1992‚Äď2003 at selected stations
Fig. 2.2.25 Field of annual average concentration of arsenic in the ambient air in 2003
Fig. 2.2.26 1/14-day average concentrations of arsenic in the ambient air at selected stations in 2003
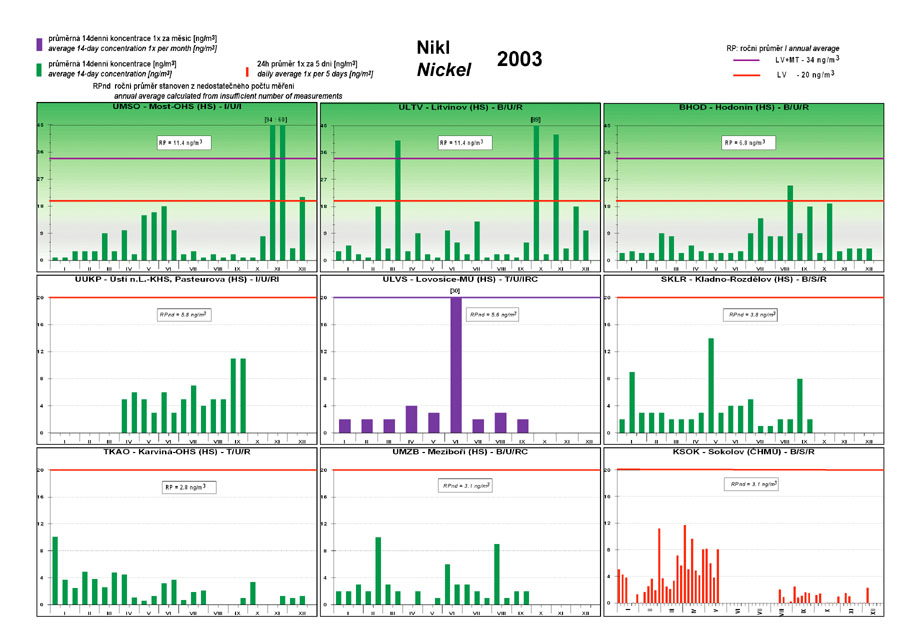
2.2.2.10 Nickel Nickel is the fifth most abundant element of the earth core, though in the earth crust its percentage share is lower. Globally, 26 % of nickel is released from natural sources (continental dust and volcanic activity). The main anthropogenic sources include combustion of heavy fuel oils, mining of nickel-containing ores and nickel refinement, refuse incineration and iron and steel production. Nickel occurs in the atmospheric aerosol in several chemical compounds which differ by its toxicity for human health and ecosystems. Nickel is found in particles with aerodynamic diameter ≥ 10 μm which quickly settle in the vicinity of the source. The size of the remaining nickel particles is < 10 μm and they can be transported over long distances [17]. The health effects include allergic dermatitis and there is evidence of nickel carcinogenicity for humans [15, 17]. None of the total number of 38 stations (5 CHMI and 33 HS) from which data for 2003 were obtained, exceeded the set limit value. The highest valid annual average concentration was measured at the station Most-OHS (11.4 ng.m-3). The reason of the major improvement of the situation as compared to the
preceding year, when 10 Public Health Service stations reported LV + MT
exceedences, can be explained by upgrading the control system of the quality of
measurements which resulted in better quality of the measured data at several
Public Health Service stations. Fig. 2.2.27 Annual average concentrations of nickel in the ambient air in 1992‚Äď2003 at selected stations
Fig. 2.2.28 1/14-day average concentrations of nickel in the ambient air at selected stations in 2003
2.2.2.11 Mercury Main anthropogenic sources of mercury include combustion of fossil fuels, chlor-alkali production, metallurgy, cement production and refuse incineration. Mercury and its compounds are used in paint industry, battery production, measuring and control instruments (thermometers) [18]. Globally, anthropogenic emissions represent about 40 % of the total emissions. The natural sources include mercury evasion from aquatic ecosystems and vegetation, volcanic activity and de-gassing from mercury-rich minerals. It is estimated that in Europe 60 % of mercury is emitted in the form of elemental vapour Hg0, 30 % as divalent mercury (Hg (II)), and only 10 % as particulate phase mercury (H(p)). Most emission from natural sources are in gaseous form Hg0 [18]. Studies of occupationally exposed humans have shown adverse effects on the central nervous system and kidneys at high mercury vapour levels [18]. The increased concentration in the ambient air results in higher atmospheric deposition on top water layers and, consequently, in higher methylmercury concentrations in freshwater fish and its accumulation in food chains. [15, 18]. In 2003 the CHMI ISKO database received data on mercury concentrations from
the CHMI station √öst√≠ nad Labem-mńõsto and from 5 Public Health Service stations.
These stations, however, have not the sufficient number of measurements for the
valid annual average (with the exception of the Karvin√°-OHS station). The annual
average mercury concentration in the ambient air at all these stations did not
even reach the lower assessment threshold (LAT).
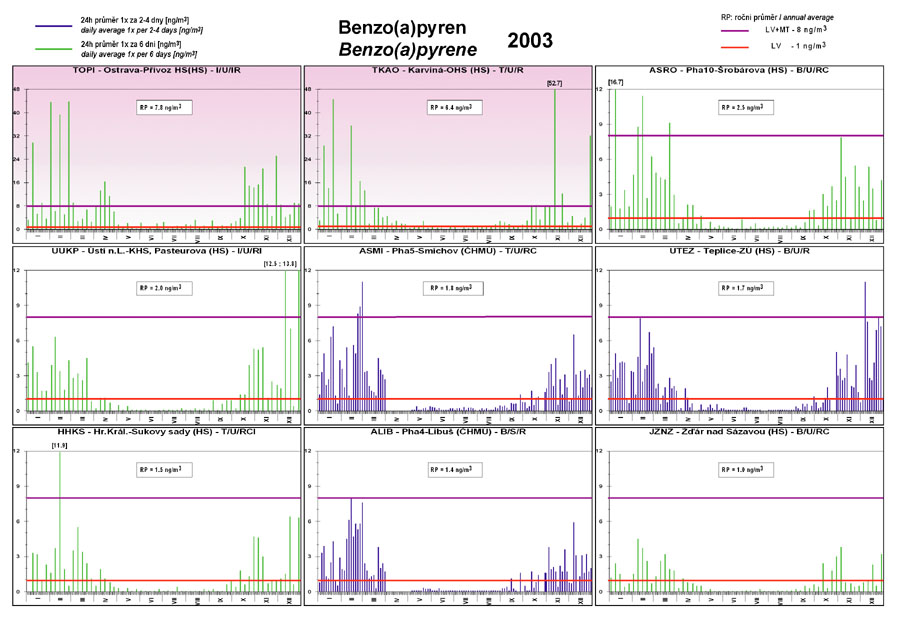
2.2.2.12 Benzo(a)pyrene The natural background level of benzo(a)pyrene is almost zero with the exception of wildfires [15]. The cause of the presence of this main representative of polyaromatic hydrocarbons (PAHs) in the ambient air is, similarly as in other PAHs the insufficient burning of fossil fuels both in stationary and mobile sources, and also some technologies, as coke and iron production. Stationary sources are represented mainly by local heating. Mobile sources are represented mainly by diesel motors. Benzo(a)pyrene as well as several other PAHs are classified as proven human carcinogens [15, 19]. In 2003 benzo(a)pyren was monitored at 13 stations (10 HS and 3 CHMI) of which 5 stations (in Ostrava, Karvin√°, Prague, √öst√≠ nad Labem, Hradec Kr√°lov√©) report regular and long-term exceedences of the set limit values (Fig. 2.2.29). There has been even an alarming increase of the annual average concentrations in several recent years. In 2003 the limit value was exceeded at 8 stations: in Ostrava, Karvin√°, Prague, √öst√≠ nad Labem, Teplice and Hradec Kr√°lov√©). The limit value of the annual concentration was reached at Public Health Service station in ŇĹńŹ√°r nad S√°zavou (Table 2.2.19). The field of annual average benzo(a)pyrene concentrations (Fig. 2.2.30) prepared with the use of combination of emission dispersion models and the measured concentrations illustrate the significant contribution of this component in the delineation of the areas with deteriorated air quality. The areas where the limit values were exceeded represent more than 3 % of the stateís territory with about 20 % of the population. However, it is necessary to consider that the estimates of the fields of
annual average benzo(a)pyrene concentrations bear the greatest uncertainties
which result both from insufficient measurement density and from uncertainties
given by dispersion modelling of PAHs emissions; PAHs emission inventories
represent the largest source of uncertainties. Fig. 2.2.29 Annual average concentrations of benzo(a)pyrene in 1997‚Äď2003 at selected stations
Fig. 2.2.30 Field of annual average concentration of benzo(a)pyrene in the ambient air in 2003
Fig. 2.2.31 24-hour concentrations at the stations with the highest annual concentrations of benzo(a)pyrene in 2003
2.2.2.13 Ammonia Major part of ammonia emitted in the ambient air is created by disintegration of nitrogenous organic materials from domestic animals breeding. The remaining amount us emitted through combustion processes or production of fertilizers. It is apparent that ammonia emissions in the ambient air are contributed by vehicles (formation of ammonia in catalytic convertors). Ammonia has irritating effects on eyes, skin and respiratory system. Chronic exposure to increased concentrations can cause headache and vomiting [20]. Quite significant are ammonia odour annoyance impacts on the population. Ammonia monitoring is so far limited to 2 stations only (1 Public Health Service and 1 CHMI station). The measured values remained well below the limit value. The highest daily value was measured at the station Lovosice-M√ö (40 μg.m-3) which is exactly the value of LAT. Fig. 2.2.32 shows the trends of SO2, PM10, NO2 and O3 annual air pollution characteristics in the Czech Republic for the period of 1994‚Äď2003 (PM10 since 1995). Up to the year 2000 the trend of air pollution caused by SO2, PM10 and NO2 was decreasing in the whole Czech Republic. In the SO2 and PM10 concentrations the decline was very steep up to the year 1999. In 2001 the decreasing trend was interrupted and, on the contrary, a slight increase of SO2 and NO2 concentrations and a significant increase of PM10 concentrations occurred. In O3 there is an apparent decreasing trend up to 1997. In 1998‚Äď2002 the O3 concentrations stagnated. In 2003 the measured values increased to the levels measured in 1994. Fig 2.2.33 shows the trends of SO2, PM10 and NO2 annual air pollution
characteristics in 1994‚Äď2003 (PM10 since 1996) for the following agglomerations:
Prague, Ústí n. L., Ostrava and Brno. Up to 1999 there was a significant
decreasing trend in SO2 and PM10 concentrations in the agglomerations, the NO2
concentrations decreased only slightly. In 2001 the decreasing trend was
interrupted and, on the contrary, the SO2 and NO2 concentrations slightly
increased and PM10 concentrations increased significantly, mainly in the Ostrava
agglomeration. The SO2 concentrations have not reached the limit value since
1998. Fig. 2.2.32 Trends of SO2, PM10, NO2 and O3 annual characteristics in the Czech Republic, 1994‚Äď2003
Fig. 2.2.33 Trends of SO2, PM10 and NO2 annual characteristics in agglomerations, 1994‚Äď2003
2.2.3 Areas with deteriorated air quality with regard to health protection To delineate zones and agglomerations with deteriorated air quality in line with the new Clean Air Act exceedences of annual average concentrations of SO2, PM10, NO2, lead, benzene, benzo(a)pyrene, cadmium, arsenic, nickel, mercury and ammonia were assessed for each station in accordance with the limit values and margins of tolerance set by the respective legislation. Frequencies of exceedence of daily limit values for PM10 and SO2 were calculated, as also those of exceedence of hourly limit values of SO2 and NO2 and frequencies of exceedence of 8-hour limit values of CO and ozone. The above mapping procedures were used for the preparation of the maps of
spatial distribution of the respective air pollution characteristics (Figs.
2.2.2, 2.2.6,
2.2.7, 2.2.10,
2.2.19, 2.2.22,
2.2.25 and 2.2. 30) presented in
the previous subchapters. Areas with the values of air pollution characteristics
higher than the respective limit values (areas marked in red or violet)
delineate the areas with deteriorated air quality. Table 2.2.21 brings the
overview of areas (listed according to regions and districts) in which the limit
value for the protection of health was exceeded in 2003 based on the results of
mapping air pollution characteristics distribution. The exceedence percentage in
the respective territory is also presented. Table 2.2.22 summarises the areas of exceedences of health protection limit values including the margins of tolerance
in 2003. The tables show the per cent of exceedence of the respective limit
values in the given territory for individual components and air pollution
characteristics and summarize the areas in which at least one limit value of the
given components was exceeded. The percentages of exceedences presented in the
overview in Table 2.2.21 correspond to the percentages of the territories of the
given administrative unit in which at least one air pollution limit value of the
set of limit values for the protection of health was exceeded. The map in
Fig.
2.2.34 depicts the delineation of areas/basic administrative units with
deteriorated air quality with regard to the limit values for the protection of
health, excluding ozone) in 2003. Table 2.2.23 shows the 2003 exceedence of the target limit value for ozone for the protection of health in the regions and districts of the Czech Republic and the share (%) of the respective territory. Ozone is presented separately, as it is evident that the measures aimed at the decrease of ozone concentrations exceeding the target limit value or the long-term air pollution targets, should be taken at the regional and national level. The areas with deteriorated air quality with regard to the target limit value for the protection of health are presented in the map (Fig. 2.2.19). The map in Fig. 2.2.35 presents the areas/administrative units with deteriorated air quality with regard to health protection limit values incl. ozone. Fig. 2.2.34 Areas/administrative units with deteriorated air quality with regard to health protection limit values, ozone excluded, 2003
Fig. 2.2.35 Areas/administrative units with deteriorated air quality with regard to health protection limit values incl. ozone, 2003
2.2.4 Air quality with regard to the limit values for the protection of ecosystems and vegetation Besides the limit values for the protection of health the new national
legislation introduces, in compliance with EU Directives, also the limit values
for the protection of ecosystems and vegetation. The survey of the limits is
presented in the Table 2.2.24. The above territories are highlighted in the maps and specified in the
legend. The maps do not cover the proposed (not declared yet) protected
landscape areas. 2.2.4.1 Sulphur dioxide The results of air pollution monitoring with regard to the limit value for the protection of ecosystems is shown in the Table 2.2.25 and in Figs. 2.2.36 and 2.2.37. Of the total number of 27 stations classified as rural ‚Äď EKO (stations in the EKO zone meet at least one of the above a), b), c) condition), which supplied data valid for the year 2003, only 1 station reported the exceedence of the limit value for annual average concentration. No EKO station reported the limit value exceedences for the 2003/2004 winter average concentration (Table 2.2.25). Fig. 2.2.36 demonstrates the significant improvement of air quality with regard to sulphur dioxide after 1997 in connection with coming into force of the Act No. 309/1991 Coll. and meeting the set emission limit values by the end of 1998. Most rural stations recorded slight decline in SO2 pollution in the 2003/2004 winter average. The map in Fig. 2.2.37 shows that in 2003 exceedences of the limit value
occurred only in the northern part of the Karvin√° district, which is not
included within the defined territories for the protection of ecosystems and
vegetation, further in very small parts of the KruŇ°n√© hory Mts. and ńĆesk√©
stŇôedohoŇô√≠ Mts., where the limit value exceedences do not reach even 0.01 % of
the area of the defined territories for the protection of ecosystems and
vegetation. Fig. 2.2.36 Winter average concentrations of SO2 in 1992/1993‚Äď2003/2004 at selected stations
Fig. 2.2.37 Field of average concentration of SO2 in the winter period 2003/2004
2.2.4.2 Nitrogen oxides Table 2.2.26 and Figs. 2.2.38 and 2.2.39 present the situation of ambient air pollution caused by NOx with regard to vegetation protection. In 2003 the annual NOx limit (30 őľg.m-3) was not exceeded at any station classified as rural ‚Äď EKO. In 2003 very slight increase of annual average NOx concentration occurred at most rural stations (Fig. 2.2.38). The slight increase in NOx concentrations in the Czech Republic was caused by higher emissions from transport. As it is evident from the map in Fig. 2.2.39, in very limited localites of
the territory defined by the Government Order on the protection of vegetation,
less than 0.4 % of the area of the defined territory recorded the exceedence of
the respective NOx limit values for the protection of ecosystems and vegetation.
The occasional exceedences occurred mainly in northern Bohemia and in the
Central Bohemian Region. Fig. 2.2.38 Annual average concentrations of NOx in 1992‚Äď2003 at selected stations
Fig. 2.2.39 Field of annual average concentration of NOx in 2003
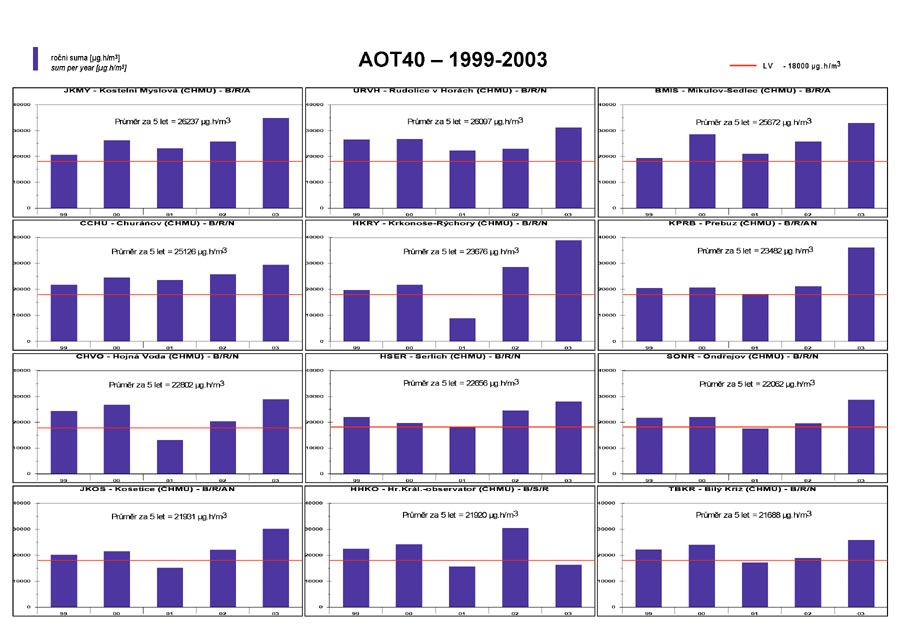
2.2.4.3 Ground-level ozone For the assessment of vegetation protection against ozone exceedences the national legislation uses, in compliance with the respective EU Directive, the exposure index AOT40 . The survey of stations with the highest values of AOT40 is given in Table 2.2.27. Of the total number of 30 rural and suburban stations for which the AOT40 calculation is relevant according to the legislation, the air pollution target for the protection of vegetation was exceeded at 19 stations in 2003. The target limit value for the protection of vegetation was exceeded at 9 stations operating on the territory defined by the Government Order as the territory on which the limit for the protection of vegetation is not to be exceeded (the stations have the EKO code in the last column of the table). The spatial distribution of ozone AOT40 in 2003 is shown in the map in Fig. 2.2.41. It is evident that in 58 % of the countryís territory, i.e. in 63.13 % of the territory in which, in compliance with the Government Order the limit value for vegetation protection is not to be exceeded, the AOT40 was exceeded in 2003. Tab. 2.2.27 Stations with the highest AOT40 values of ozone at rural and suburban stations Fig. 2.2.40 AOT40 values of ozone in 1995‚Äď2003 at selected stations, average of 5 years
Fig. 2.2.41 Field of AOT40 value of ozone, average of 5 years 1999 - 2003
Fig. 2.2.42 Stations with the highest AOT40 values in recent 5 years, 1999‚Äď2003
2.2.5 Areas with deteriorated air quality with regard to the protection of ecosystems and vegetation Based on the mapping of air pollution characteristics distribution for the year 2003 with regard to vegetation protection (Figs. 2.2.37 and 2.2.39) the distribution of air pollution limit values exceedences is shown for annual average concentrations of NOx and winter average SO2 concentrations for the protection of ecosystems and vegetation. The assessment of the respective limit values exceedences is carried out for the territory defined for the protection of ecosystems and vegetation in accordance with the Government Order No. 350/2002 Coll. The final designation of areas with deteriorated air quality with regard to the limit values for SO2 and NOx for the protection of ecosystems/vegetation pursuant to the Act No. 86/2002 Coll. for the year 2003 is shown in Fig. 2.2.43. Table 2.2.28 shows the shares of exceedence of the limit values for the
protection of ecosystems and vegetation for individual limit values for NOx, SO2
and ozone AOT40 for the territory defined by the new legislation. It is evident
that in 63 % of the territory defined as protected areas the target for limit valueozone AOT40 is exceeded, due to exceeding ozone concentrations (Fig.
2.2.44). Fig. 2.2.43 Areas with deteriorated air quality with regard to SO2 and NOx limit values for the protection of ecosystems/vegetation, 2003
Fig. 2.2.44 Areas with deteriorated air quality for ecosystems/vegetation, exceedence of limit value AOT40, 2003
2.2.6 Conclusions The adopted environmental legislative documents transposing the new EU directives on ambient air have become an important stimulus for further necessary improvement of ambient air quality in the Czech Republic. The air quality assessment procedures implemented within the transposition of the new EU directives represent undoubtedly the compact and elaborate, though rather complicated system of assessment which should enable to carry out comparable air quality assessment on all-European scale. The limit and threshold values set by the EU directives are deduced thoroughly from the updated recommendations of the World Health Organization, including the limit values for the protection of ecosystems and vegetation. The main consequence of the EU ambient air quality directives transposition is to implement the principle to maintain the state of air quality in those areas where it is good, and to take remedial measures in the form of programs aimed at the improvement of air quality, or the regulation rules for the areas with deteriorated ambient air quality. The carried out assessment for the year 2003 has taken into account the
requirements of the Government Order No. 350/2002. The following problems were
indicated with regard to meeting the deadlines set by the national legislation
on the protection of ambient air.
The exceedence of limit values for the suspended particles is a major problem in most European cities. The occurrence of suspended particles in ambient air is a rather complicated phenomenon and their actual concentration expressed in mass number is represented only partially by local emission of primary particles, especially by transport emission. Further contribution to the actual concentration is represented by reemission, and the remaining part by secondary inorganic and organic particles created by chemical transformation of gaseous components both of anthropogenic origin (SO2, NOx and non-methane volatile organic compounds), and by emission from the natural environment. Thus the problem of exceeded concentrations of suspended particles in European cities will have to be solved both within all-European cooperation, and at local or regional levels, mainly through measures aimed at local heating and by the reduction of traffic emission, including better street cleaning. Relatively high contribution of secondary particles show that significant decrease of PM10 concentrations will be possible by further decreasing of emission of the components causing the creation of the fraction of secondary particles in atmospheric aerosol. This demands mainly the decreasing of nitrogen oxides and VOC emissions in compliance with the requirement to meet the national emission ceilings, but in such a way that by the deadlines set by the Clean Air Act the air pollution limit values are met for PM10. Further decrease of emissions, mainly nitrogen oxides emissions but also of VOC emissions on a large scale, is the only way of possible decrease of the load caused by exceeding concentrations of ground-level ozone.
|