Updated: 2025-12-17 07:25 CET
| Locality: |
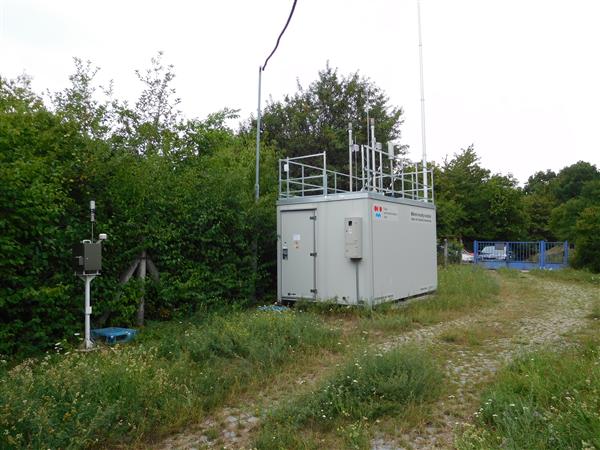
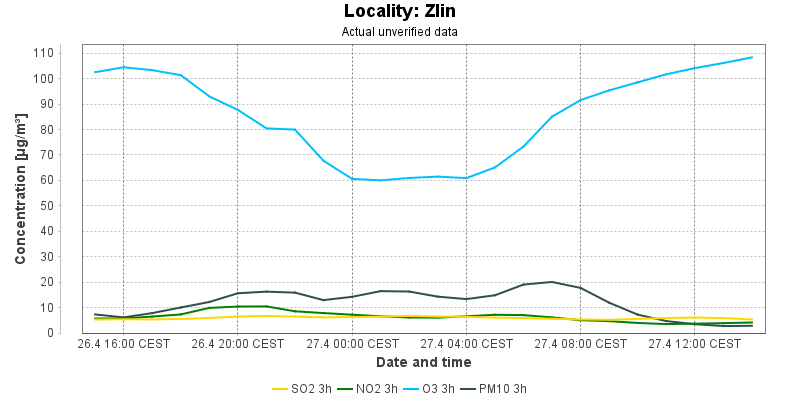
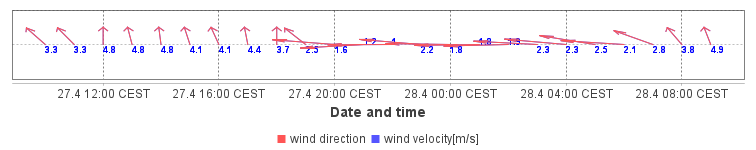
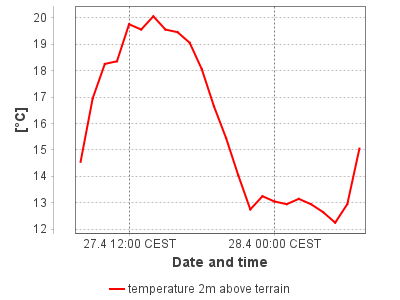
Zlin
|
|
| Code: |
ZZLNA |
| Type of measuring programme: |
Automated measuring program |
| Locality owner: |
Czech Hydrometeorological Institute |
| Abbreviation: |
B/S/RN |
| Coordinates: |
49° 13´ 58.463" North latitude 17° 40´ 1.831" East longitude |
| Altitude: |
258 m |
Actual measured level of air pollution
Actual unverified data
| 2025-12-16 05:00 - 08:00 CET |
1A
|
4.7 |
6.3 |
1.8 |
28.8 |
|
|
|
|
2.5 |
| 2025-12-16 06:00 - 09:00 CET |
1A
|
4.2 |
7.8 |
3.1 |
28.3 |
|
|
|
|
3.2 |
| 2025-12-16 07:00 - 10:00 CET |
1A
|
3.8 |
8.4 |
4.4 |
28.4 |
|
|
|
|
3.8 |
| 2025-12-16 08:00 - 11:00 CET |
1A
|
3.8 |
8.7 |
5.2 |
29.4 |
|
|
|
|
4.1 |
| 2025-12-16 09:00 - 12:00 CET |
1A
|
4.7 |
7.5 |
4.7 |
31.0 |
|
|
|
|
4.0 |
| 2025-12-16 10:00 - 13:00 CET |
1A
|
4.6 |
7.5 |
4.7 |
31.6 |
|
|
|
|
2.6 |
| 2025-12-16 11:00 - 14:00 CET |
1A
|
4.6 |
7.6 |
10.0 |
32.3 |
|
|
|
|
2.1 |
| 2025-12-16 12:00 - 15:00 CET |
1A
|
4.3 |
7.9 |
11.9 |
33.4 |
|
|
|
|
2.7 |
| 2025-12-16 13:00 - 16:00 CET |
1A
|
4.5 |
8.9 |
12.7 |
34.1 |
|
|
|
|
3.7 |
| 2025-12-16 14:00 - 17:00 CET |
1A
|
4.2 |
16.9 |
7.5 |
26.9 |
|
|
|
|
3.8 |
| 2025-12-16 15:00 - 18:00 CET |
1A
|
4.4 |
28.1 |
12.4 |
16.2 |
|
|
|
|
5.9 |
| 2025-12-16 16:00 - 19:00 CET |
1B
|
4.1 |
36.9 |
16.6 |
6.1 |
|
|
|
|
12.2 |
| 2025-12-16 17:00 - 20:00 CET |
1B
|
4.1 |
35.5 |
26.3 |
5.5 |
|
|
|
|
18.7 |
| 2025-12-16 18:00 - 21:00 CET |
1B
|
4.4 |
31.2 |
32.3 |
7.3 |
|
|
|
|
26.8 |
| 2025-12-16 19:00 - 22:00 CET |
1B
|
4.5 |
28.4 |
38.3 |
7.1 |
|
|
|
|
30.5 |
| 2025-12-16 20:00 - 23:00 CET |
1B
|
4.7 |
28.2 |
37.6 |
4.6 |
|
|
|
|
33.2 |
| 2025-12-16 21:00 - 00:00 CET |
1B
|
4.7 |
27.0 |
34.6 |
2.6 |
|
|
|
|
29.2 |
| 2025-12-16 22:00 - 01:00 CET |
1B
|
4.9 |
24.9 |
33.7 |
2.4 |
|
|
|
|
24.2 |
| 2025-12-16 23:00 - 02:00 CET |
1B
|
4.8 |
21.3 |
29.8 |
5.8 |
|
|
|
|
22.6 |
| 2025-12-17 00:00 - 03:00 CET |
1B
|
4.7 |
17.9 |
24.5 |
10.1 |
|
|
|
|
21.0 |
| 2025-12-17 01:00 - 04:00 CET |
1A
|
5.3 |
15.0 |
19.6 |
13.5 |
|
|
|
|
22.2 |
| 2025-12-17 02:00 - 05:00 CET |
1A
|
5.8 |
15.3 |
19.2 |
15.7 |
|
|
|
|
18.0 |
| 2025-12-17 03:00 - 06:00 CET |
1A
|
5.6 |
18.2 |
18.2 |
15.8 |
|
|
|
|
14.8 |
| 2025-12-17 04:00 - 07:00 CET |
1B
|
5.3 |
22.0 |
19.5 |
14.4 |
|
|
|
|
14.4 |
|
1A
|
≥ 0.00 and < 0.34 |
very good to good |
|
1B
|
≥ 0.34 and < 0.67 |
|
2A
|
≥ 0.67 and < 1.00 |
acceptable |
|
2B
|
≥ 1.00 and < 1.50 |
|
3A
|
≥ 1.50 and < 2.00 |
aggravated to bad |
|
3B
|
≥ 2.00 |
|
|
Component is not measured, index not determined |
|
|
Incomplete data |
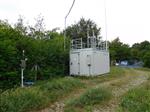
Map of station position
Map is on page with detailed information about locality