|
|
AIR POLLUTION IN THE CZECH REPUBLIC IN 2009 Czech Hydrometeorological Institute - Air Quality Protection Division |
|
|
|
|
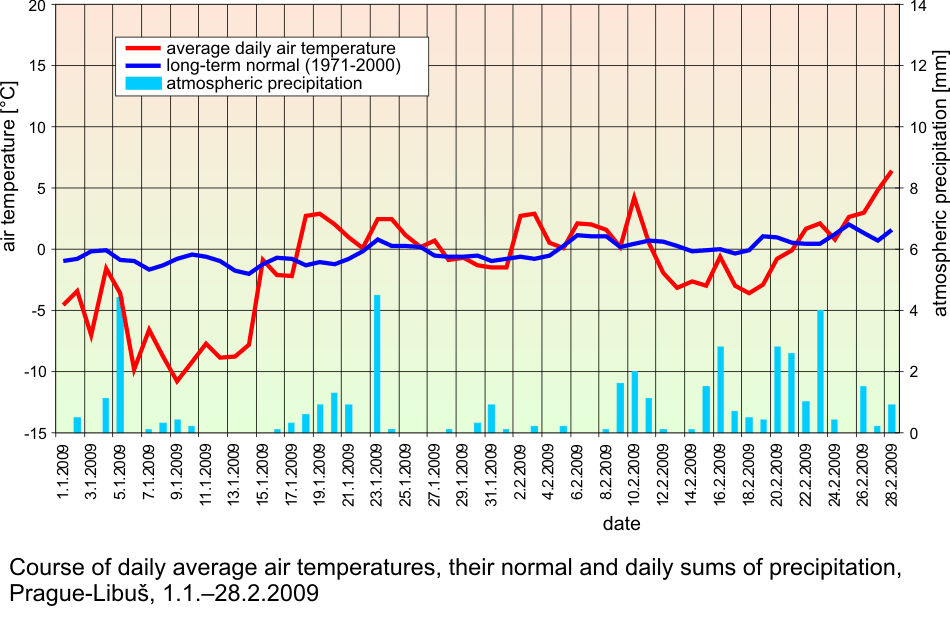
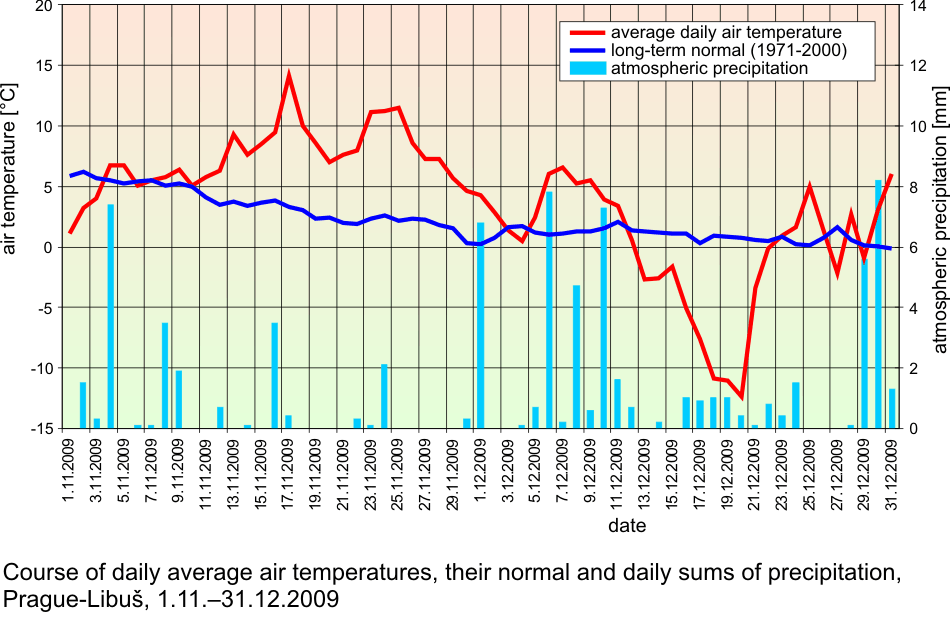
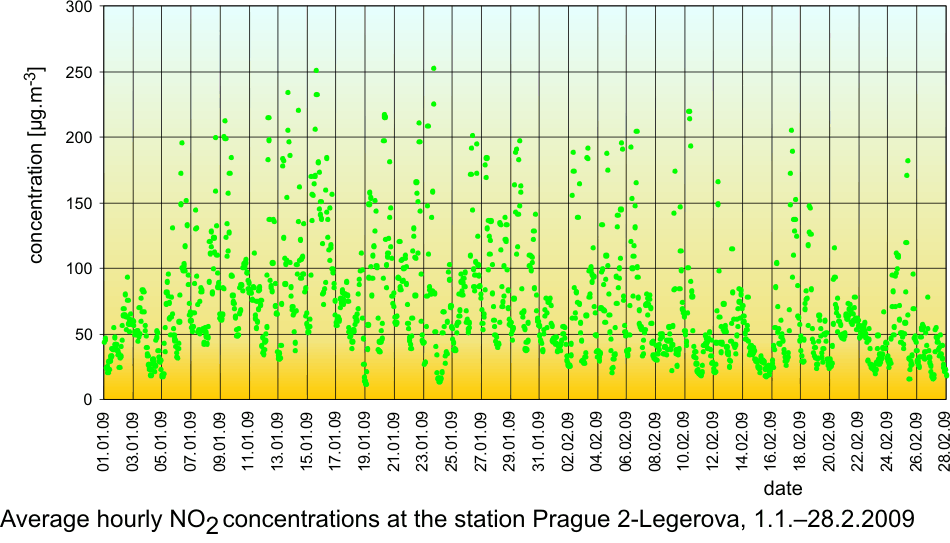
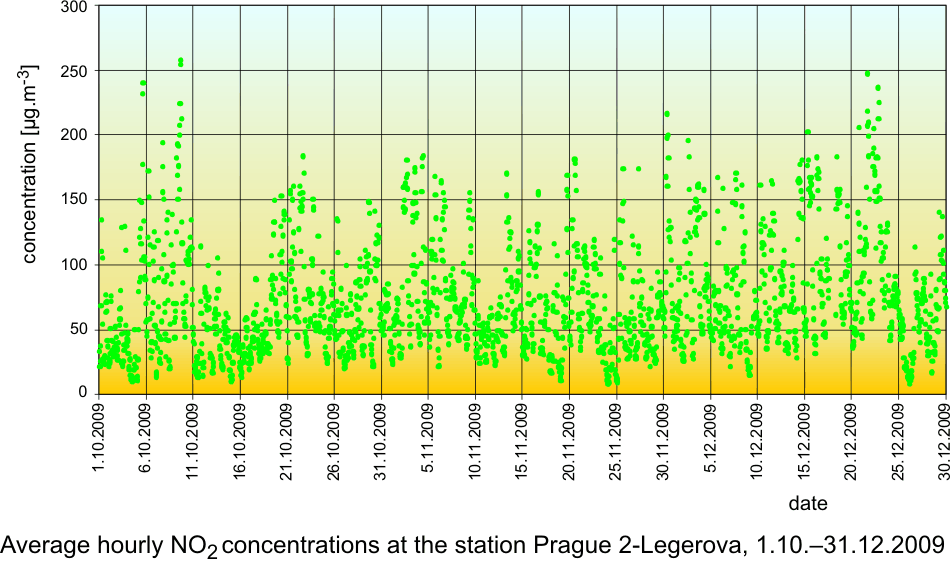
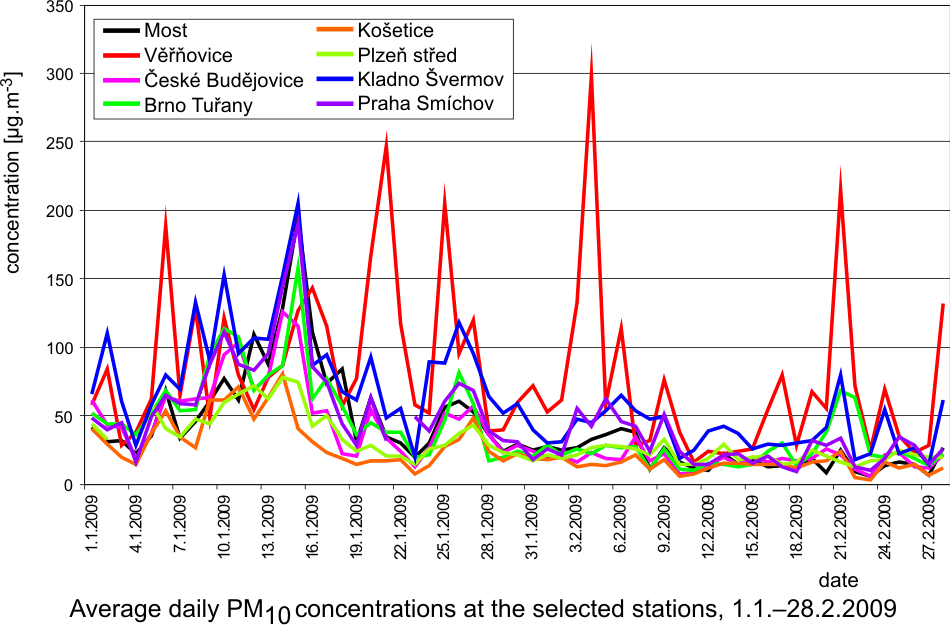
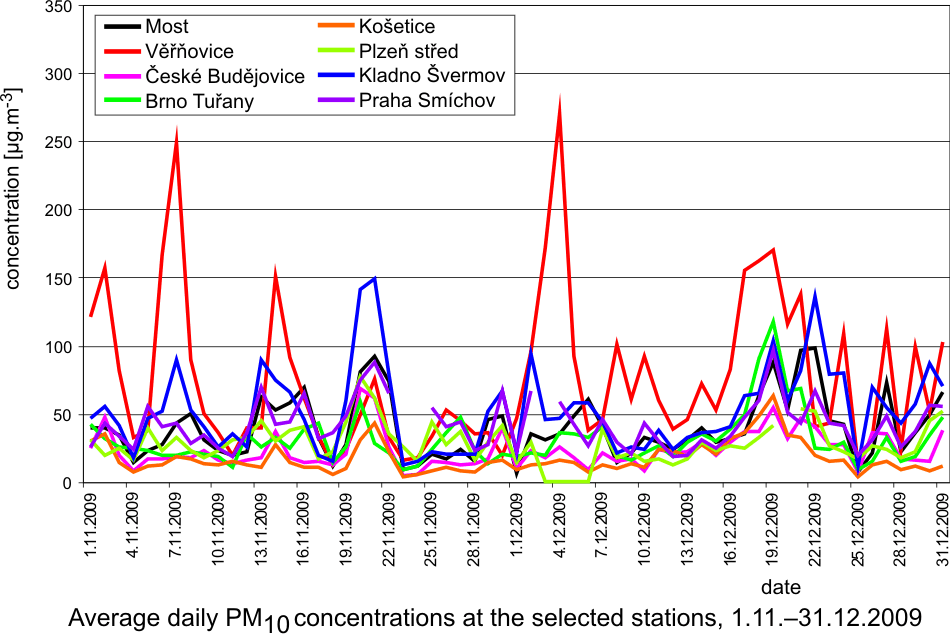
II.5 Evaluation of the smog regulation systems operation on the territory of the Czech Republic in 200 9The temperatures of the first two and the last two winter months of the year 2009 were slightly variable. In January 2009 the average monthly temperature -4.0 ░C was slightly subnormal with the deviation from the normal -1.2 ░C, November 2009 with the average monthly temperature 5.5 ░C was markedly above the normal, with the deviation +2.8 ░C. The months of February and December 2009 with average monthly temperatures 1.0 ░C ranged around the long-term normal. As concerns the monthly precipitation amounts, the highest values were recorded in February ŌĆō 61 mm and in December ŌĆō 58 mm, which represents 161░% and 122 % of the long-term normal respectively. The average precipitation in January and November 2009 amounted to 25 mm and 43 mm, which represents 60 % and 88 % of the long-term normal respectively. According to the results of the Prague-Libu┼Ī station the period from 1.1 to 17.1. 2009 was markedly below the normal, with maximum deviation from the normal -10.9 ░C on 9.1.2009; the beginning and the end of the period 18.1.ŌĆō10.2.2009 were slightly above the normal, with the deviations from the normal up to +3.8 ░C. The period from 11.2 to 21.2.2009 was slightly below normal, with the highest deviation from the normal -4.0 ░C on 19.2.2009. In the remaining days of February both the temperatures and the deviations increased, the maximum deviation from the normal +4.9 ░C was recorded on 28.2.2009. The average daily temperatures from 1.11. to 31.12.2009 can be divided into two periods, one with the markedly plus deviation and the other with the minus deviation from the long-term normal. The period from 12.11. to 1.12.2009 had markedly above-the-normal temperatures, the average daily temperature on 17.11. was 14.1 ░C and the deviation from the normal +10,8 ░C. Another period with markedly subnormal temperatures was between 12.12. and 22.12.2009; on 20.12. the average daily temperatures was -12.4 ░C and the deviation from the normal was -13.1 ░C. As regards the long-term normal of precipitation, the maximum amounts were recorded in December ŌĆō 53 mm, which is 215.4 %, and in February 2009 with the sum of 24.8 mm, i.e. 122.2 % of the long term normal. There follow further months, and namely January with 17 mm, i.e. 47.0 % and November with 22.3 mm, which represents 71.7░% of the long-term normal (Figs. II.5.1 and II.5.2). Anticyclonic situations in JanuaryŌĆōFebruary and NovemberŌĆōDecember 2009 occurred in 16.7░% of cases and their relative frequency for the above months was unsteady and ranged between 0 and 29.0 %. The highest relative frequency of the occurrence of anticyclonic situations (29.0 %) was in January 2009, in February 2009 there was no such situation. In November 2009 the anticyclonic situations were recorded in 23.3 % and in December 2009 in 12.9 % of cases. Very high occurrence of cyclonic situations in February and December 2009 resulted in above-the-normal precipitation amounts in the mentioned months. From 1.1. to 28.2.2009 and from 1.11. to 31.12. 2009 concentrations of SO2 exceeding 250 ╬╝g.m-3 were recorded in the territory of the Czech Republic in 11 cases, 9 of them in January 2009. There were no episodes lasting for continuous 3 hours and more, only one-hour exceedances were recorded. The most frequent exceedance of this limit value was recorded in the Kru┼Īn├® hory Mts., due to the impacts of smoke plumes from power stations with the terrain in the mountain ridges. The highest SO2 concentration was measured on 13.1.2009 at the station Rudolice v Hor├Īch (675 ╬╝g.m-3). From 1.1. to 28.2.2009 and from 1.11. to 31.12. 2009 there were recorded concentrations of NO2 above 200 ╬╝g.m-3 for 3 subsequent hours and more only at the station Prague 2-Legerova, and namely on 4 days: 15.1.2009 from 13:00ŌĆō17:00 with the maximum value 251 ╬╝g.m-3, on 10.2.2009 from 06:00ŌĆō08:00 with the maximum value 220 ╬╝g.m-3, on 9.10.2009 from 13:00ŌĆō17:00 with the maximum value 258 ╬╝g.m-3 and on 21.12.2009 from 14:00ŌĆō17:00 with the maximum value 248 ╬╝g.m-3 (Figs. II.5.3 and II.5.4). The 1-hour limit value was exceeded also at the station Uhersk├® Hradi┼Īt─ø. In all cases the NO2 concentrations decreased very quickly, the expected significant increase did not occur, and, consequently, the conditions for the announcement of the SRS signals were not fulfilled. The major problem in ambient air duality throughout the Czech Republic is caused by the occurrence of high concentrations of PM10 fraction of particles. In the period of 9.1.ŌĆō16.1.2009 the air quality in the whole territory of the Czech Republic deteriorated, the worst situation was on 14 and 15 January, when the limit value was exceeded at 54 measuring stations, which is 61 % of the total number. The greatest number of stations with exceedances was recorded in the Ostrava area, Prague, Central Bohemian Region and ├Üst├Ł nad Labem Region. The analysis of the occurrence of the anticyclonic character of the weather and the mightiness of vertical air temperature inversion during the noon show that the worst dispersion conditions occurred from 7.1. to 17.1.2009. The graphs in Figs. II.5.5 and II.5.6 show clearly that the situation in the Moravian-Silesian Region is critical because the concentrations are very high and they are recorded more frequently than in other parts of the Czech Republic. The development of synoptic situation from 8.1. to
15.1.2009 Occurrence of tropospheric ozone from 1.4. to 30.9. 2009 The increased ozone concentrations can be expected with the
occurrence of high air temperatures, when the weather is clear or somewhat clear
with low wind velocities. Between 1.4. and 30.9.2008, according to the records
of the station Prague-Libu┼Ī, there occurred 3 periods during which the afternoon
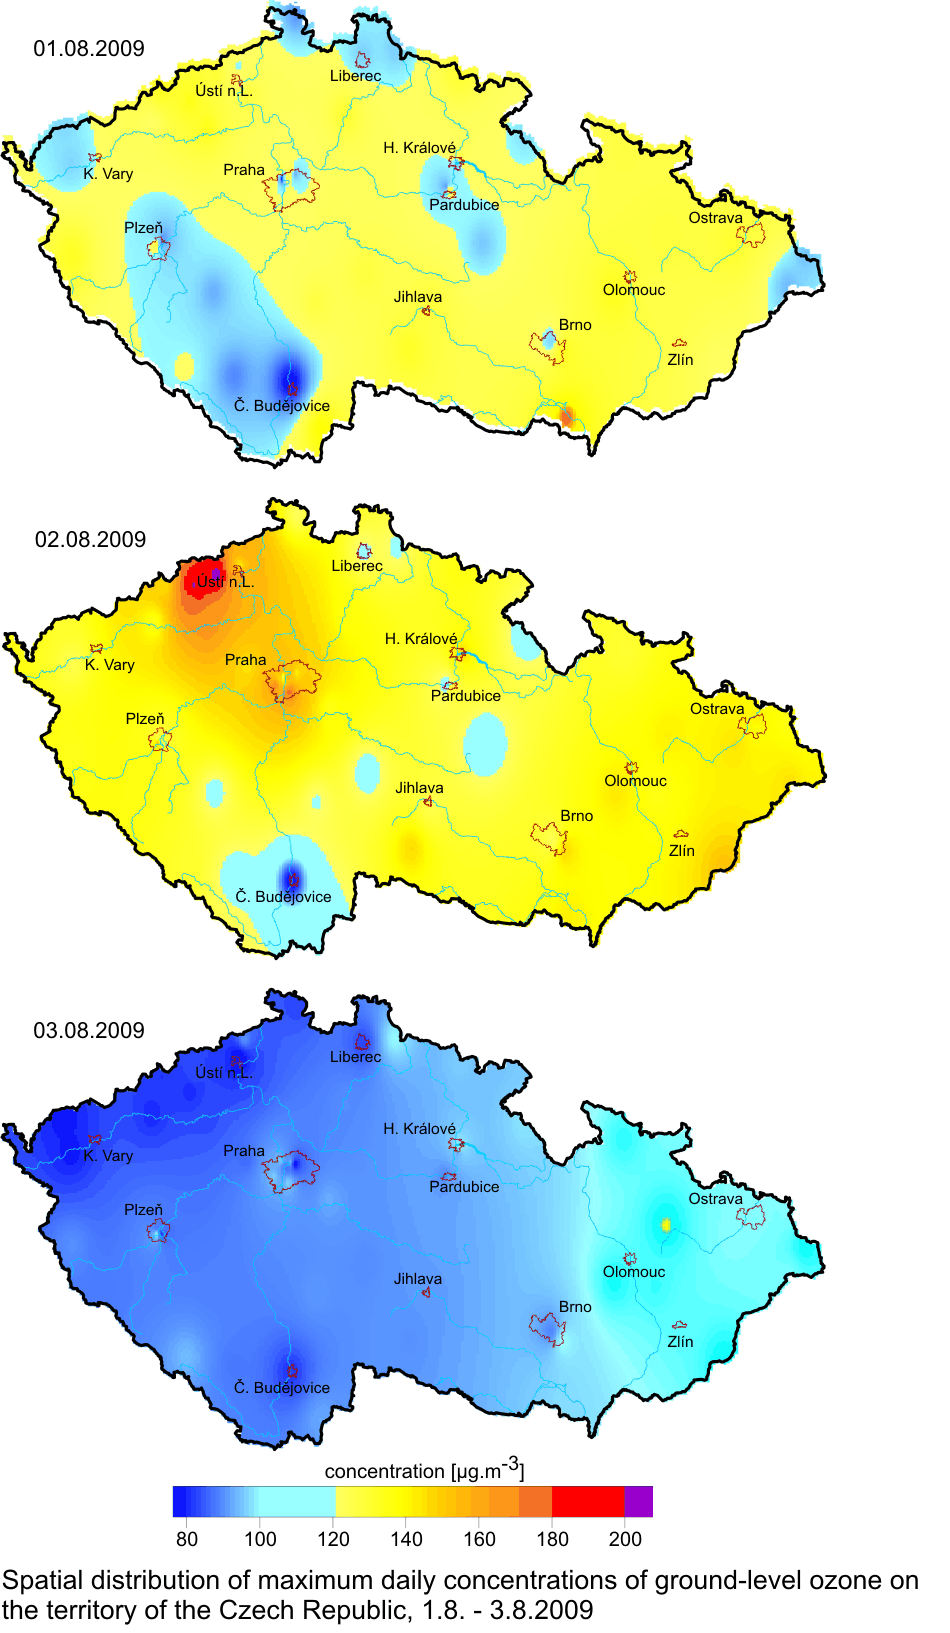
temperatures exceeded 30 ░C for two subsequent days. The analysis of the occurrence of the highest average hourly concentrations of tropospheric ozone in the territory of the Czech Republic from April to September 2009 shows that the highest values (201ŌĆō207 ╬╝g.m-3) were measured in August in the ├Üst├Ł nad Labem Region, followed by July with the concentrations around 170 ╬╝g.m-3 in the Zl├Łn Region and the Moravian-Silesian Region, May with 169 ╬╝g.m-3 in the ├Üst├Ł nad Labem Region, April with 153 ╬╝g.m-3 in the Olomouc Region. In the remaining months, in June in the Hradec Kr├Īlov├® Region and in September in the Plze┼ł Region, the values reached 148 ╬╝g.m-3. It can be concluded that in 2009 the highest and most frequent concentrations of troposheric ozone were recorded in the ├Üst├Ł nad Labem Region. One-day episode of concentrations exceeding the alert
threshold value 180 ╬╝g.m-3 was recorded on 2 August 2009, when this
value was exceeded for subsequent 3 hours at the stations Lom and Teplice, with
the maximum concentration 207 ╬╝g.m-3. The mentioned day was
characterized first by the influx of warm air from the south-east, but mainly by
the weakening flow in the whole mixing layer (in the morning and late morning
hours was very weak, the average velocity at the level 0ŌĆō500 m above the terrain
was 6.7 km.h-1. Under such conditions there occurred a great
accumulation of ozone precursors in the given locality and therefore the O3
concentrations at the stations of northern Bohemia increased in the average by
27 ╬╝g.m-3 with regard to the previous day, and namely at the stations
Teplice (by 65 ╬╝g.m-3) and Lom (by 75 ╬╝g.m-3) which
represents the extreme increase. The station Prague-Libu┼Ī recorded the increase
by 53 ╬╝g.m-3 (Fig. II.5.8). Synoptic situation and the weather from1 to 3 August 2009 On 1.8.2009 the weather in the whole Czech Republic was clear, with the exception of north-eastern Moravia with local cloudy weather. Maximum afternoon temperatures reached 26.9░░C. In the morning of the following day the weather in Bohemia was almost clear, in the afternoon gradually cloudy from the west, temporarily overcast with showers. In Moravia, the weather was almost clear for the whole day, in the evening and during the night cloudy, temporarily overcast with showers. The maximum afternoon temperatures in Bohemia reached 30.1 ░C, in Moravia 31.0 ░C. The average daily precipitation amount in Bohemia was 17.6 mm, in Moravia 5.3 mm. On 3 August the whole territory had almost clear to cloudy weather, temporarily overcast with showers or local rain. The maximum afternoon temperatures reached 22.6 ░C in Bohemia and 25.7 ░C in Moravia. The average daily precipitation amount in Bohemia was 6.7 mm, in Moravia 1.2 mm. During this period the stations Lom and Teplice in the ├Üst├Ł and Labem Region registered the concentrations exceeding 180 ╬╝g.m-3 for three hours, however they decreased very quickly. In connection with the expected transition of the cold front lower values of ozone concentrations were predicted for the following day, without the exceedance of the alert threshold limit. The conditions for the announcement of the warning signal were not fulfilled. Tab. II.5.2 The overview of O3 concentrations above 180 ╬╝g.m-3 lasting 3 hours and more Fig. II.5.1 Average daily air temperature, its long-term normal and daily sum of precipitation, Prague-Libu┼Ī, 1.1.ŌĆō28.2.2009
Fig. II.5.2 Average daily air temperature, its long-term normal and daily sum of precipitation, Prague-Libu┼Ī, 1.11.ŌĆō31.12.2009
Fig. II.5.3 Average hourly NO2 concentrations at the station Prague 2-Legerova, 1.1.ŌĆō28.2.2009
Fig. II.5.4 Average hourly NO2 concentrations at the station Prague 2-Legerova, 1.10.ŌĆō31.12.2009
Fig. II.5.5 Average daily PM10 concentrations at selected stations, 1.1.ŌĆō28.2.2009
Fig. II.5.6 Average daily PM10 concentrations at selected stations, 1.11.ŌĆō31.12.2009
Fig. II.5.7 Course of maximum daily air temperatures, their normals and daily sums of precipitation at the station Prague-Libu┼Ī. Occurrence of ozone concentrations exceeding 180 ╬╝g.m-3 in the territory of the Czech Republic, 1.4.ŌĆō30.9.2009
Fig. II.5.8 Spatial distribution of maximum daily concentrations of ground-level ozone in the territory of the Czech Republic, 1.8.ŌĆō3.8.2009
|