II.4.1 Agglomerations
With regard to the Communication of the Air Quality Protection Division of
the Ministry of Environment on delineating zones and agglomerations within the
territory of the Czech Republic, air quality assessment in the proposed
agglomerations (Prague, Brno and the Moravian-Silesian Region) has been treated
with more attention since 2005. In addition to the above agglomerations, special
attention is paid in the Yearbook also to the zone أڑstأ nad Labem Region due to
the recorded above-the-limit concentrations.
II.4.1.1 Prague
The Capital City of Prague is the area in which a lot of people are exposed
to ambient air pollution. Most of the limit values exceedances are connected
with significant traffic loads ensuing from the fact that the main routes lead
directly through the city centre. In 2006 air pollution concentrations were
measured at 23 localities in the territory of Prague (15 CHMI, 8 Zأڑ).
In 2006 the PM10 particles concentrations were monitored in Prague in 15 CHMI
localities and in 5 Zأڑ localities. The most frequent exceedances of 24-hour PM10
limit value (50 خ¼g.m-3) were recorded in the following localities: Prague 2-Legerova
(164x), Prague 8-Karlأn (95x) and Prague 9-Vysoؤچany (82x). Of the total number
of 16 localities with valid annual average 15 stations recorded 24-hour PM10
limit value exceedances. The annual PM10 limit value (40 خ¼g.m-3) was exceeded in
the following localities: Prague 2-Legerova (61 خ¼g.m-3), Prague 9-Vysoؤچany (42
خ¼g.m-3), Prague 8-Karlأn (41 خ¼g.m-3) and Prague 5-Smأchov (40.3 خ¼g.m-3).
The PM2.5 particles concentrations were measured in 5 CHMI localities in 2006.
In spite of the fact the PM2.5 air pollution limit value is not yet set, the
comparison of the measured concentrations with the proposed limit value (25
خ¼g.m-3, annual average) is very interesting. The average annual concentrations
in Prague localities were as follows: Prague 9-Vysoؤچany 28.3 خ¼g.m-3, Prague
5-Smأchov 27.2 خ¼g.m-3, Prague 5-Mlynأ،إ™ka 21.9 خ¼g.m-3 and Prague 8-Karlأn 18.5
خ¼g.m-3. It is quite evident that if the proposed limit value for PM2.5 fraction
was valid, it would be exceeded at two Prague stations.
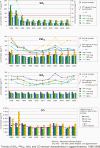
The graphs in Fig. II.4.1.1 show the development of courses of PM10
concentrations at selected AMS in Prague with regard to the temperature and wind
velocity for the winter periods 2004/2005, 2005/02006 and 2006/2007.
In the given periods the average winter PM10 concentration exceeded the value 40
خ¼g.m-3 at several AMS. More than 35 exceedances of the 24-hour air pollution
limit value were recorded at the AMS Mlynأ،إ™ka and Smأchov in all periods. The
both above air pollution characteristics show the marked decreasing trend at the
AMS Smأchov and Kobylisy; on the contrary, at AMS Vrإ،ovice the increasing trend
was recorded. The maximum measured 24-hour concentrations reached the highest
values during the winter period 2005/2006, when the lowest average temperature
was measured as well.
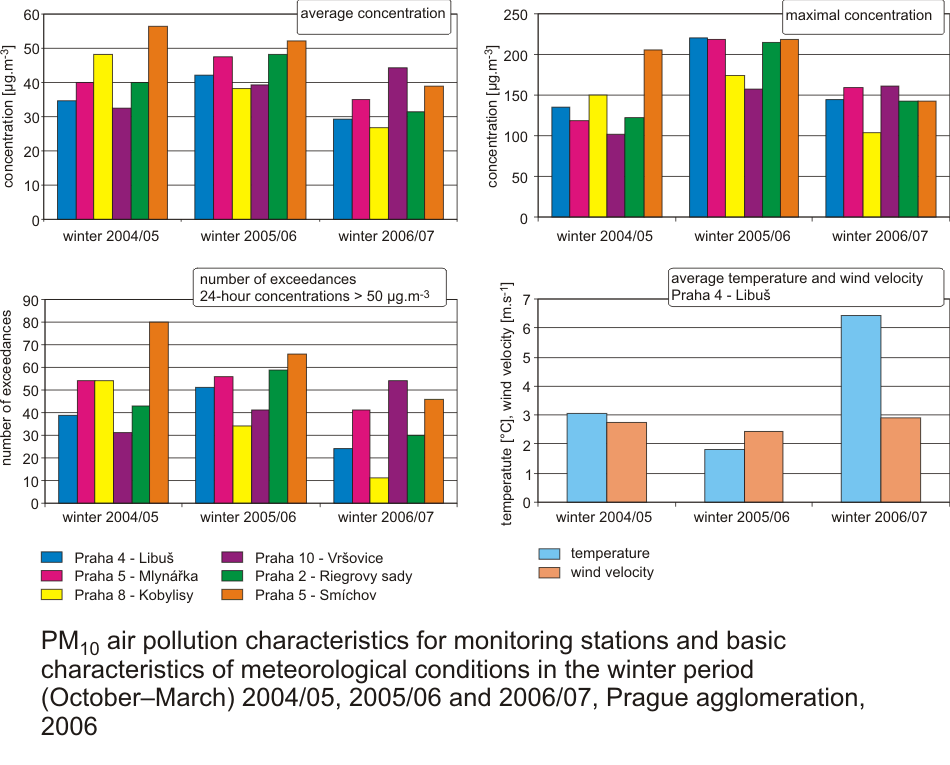
NO2 concentrations were measured in 15 localities in Prague in 2006. The AIM
station Prague 2-Legerova exceeded the hourly limit value 200 خ¼g.m-3 but not the
hourly limit value plus the margin of tolerance (200+40 خ¼g.m-3). The value of
200 خ¼g.m-3 was exceeded 126x, the value of 240 خ¼g.m-3 was exceeded 8x. The
hourly NO2 concentration 200 خ¼g.m-3 was exceeded also at AMS station Prague
9-Vysoؤچany (3x) and Prague 10-Vrإ،ovice (1x); consequently, the tolerated number
of exceedances was not reached.
The annual air pollution limit value plus the margin of tolerance for NO2 (40+8
خ¼g.m-3) was markedly exceeded at the AMS Prague 2-Legerova (74 خ¼g.m-3) and also
in the following Zأڑ localities: Svornosti in Prague 5 (73 خ¼g.m-3) and Sokolovskأ،
in Prague 8 (60 خ¼g.m-3).
Another problem is caused by above-the-limit benzo(a)pyrene concentrations which,
similarly as in the previous year, exceeded the target value at all (3) stations
which measured it in Prague, and namely Prague 10-إ robأ،rova, Prague 5-Smأchov,
Prague 4-Libuإ،.
The results of the measured concentrations of PM10, NO2 and benzo(a)pyrene
suggest the serious need to find the solution for the traffic situation within
the agglomeration.
The exceedances of the target value for the ground-level ozone was also recorded.
It was exceeded in 3 of 7 localities in Prague, which have carried out the
measurements in the recent three years at least for the period of one year (pursuant
to the definition of the target value in the Government Order).
Fig. II.4.1.1 PM10 air pollution characteristics for monitoring stations and
basic characteristics of meteorological conditions in the winter period (October–March)
2004/05, 2005/06 and 2006/07, Prague agglomeration, 2006
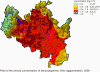
Fig. II.4.1.2 Field of the annual concentration of NO2, Prague agglomeration,
2006
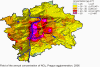
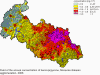
Fig. II.4.1.3 Field of the annual concentration of benzo(a)pyrene, Prague
agglomeration, 2006
II.4.1.2 Brno
In the Brno agglomeration, similarly as in the Prague agglomeration, the most
serious air pollution problems are caused by high density of population
connected with ever increasing intensity of traffic. This results mainly in the
increased PM10 (PM2.5) particles and benzo(a)pyrene concentrations in the
ambient air.
The ISKO database receives the measured concentrations from 4 CHMI stations,
from 3 Zأڑ stations, and since 2006 also from 5 stations of the Statutory City of
Brno.
PM10 concentrations were measured in 7 localities in 2006. The exceedance of
the PM10 24-hour limit value was recorded at AMS Brno-stإ™ed which is located in
the city centre in the immediate vicinity of the crossroad of two frequented
communications. The tolerated number of exceedance of the value 50 خ¼g.m-3 is 35x
in total; the measurements at this station, however, recorded 109 cases of
exceedance, i.e. almost one third of the days in the given year. The limit value
was further exceeded in the localities Brno-Tuإ™any (69x), Brno-Lأ،ny (63x) and
Brno-Kroftova (54x). The locality Brno-Kroftova is also influenced by traffic.
The localities Brno-stإ™ed and Brno-Kroftova also exceeded the PM10 annual limit
value.
The only locality in Brno measuring the PM2.5 fraction concentration in 2006,
and namely Brno-Tuإ™any, would exceed the proposed limit value, as it recorded
the annual average 27.6 خ¼g.m-3.
The NO2 annual limit value plus the margin of tolerance was exceeded in the
locality Brno-Svatoplukova, the locality Brno-stإ™ed recorded only the limit
value exceedance. The hourly limit value was not exceeded at any station.
In 2006 also the target limit value for benzo(a)pyrene was exceeded in the
locality Brno-Kroftova, which as one of the two stations in Brno measured this
pollutant.
The concentrations of ground-level ozone were measured in 3 localities in 2006
of which two (Brno-Tuإ™any and Brno-Zvonaإ™ka) exceeded the target limit value for
ground-level ozone. The deadline for achieving this limit value is 31.12.2009.
The expanding of the areas with deteriorated air quality within the Brno
agglomeration and the South Moravian Region
Recently the extent of the areas with deteriorated air quality has been
markedly increasing, both within the Brno agglomeration and the zone South
Moravian Region. In 2004 the share of the areas with deteriorated air quality
was approx. 4 % of the whole territory of the South Moravian Region, in 2005 and
2006 they covered already about 2/3 of the territory of this region. The
increase was caused mainly by a large number of localities with exceedances of
the 24-hour PM10 limit value, both in urban localities and in the background
localities without industrial and traffic impacts.
The increase of exceedances of limit values in 2005 and 2006, and consequently
the extent of the areas with deteriorated air quality, can be explained by very
unfavourable dispersion conditions, mainly due to temperature inversions. Very
strong temperature inversion influenced the dispersion conditions in the second
half of January and in early February of the year 2006 when all stations
recorded exceedances of the valid limit values for approx. 20 days. The maximum
values of 24-hour PM10 concentrations measured in Brno ranged around 200 خ¼g.m-3.
With regard to the unfavourable meteorological conditions the number of
exceedances of the 24-hour PM10 concentration approached the tolerated 35
exceedances as early as in late February 2006. The number of days with
exceedances of the limit value (50 خ¼g.m-3) for the PM10 24-hour concentration in
the winter period (October–March), starting from the year 2000, is shown in the
following table. To illustrate the situation, the selected localities are both
background: Mikulov-Sedlec in the South Moravian Region, and Brno-Tuإ™any in the
Brno agglomeration.
Tab. II.4.1.1 Number of days with exceedances of the limit value (50 خ¼g.m-3)
for the PM10 24-hour concentration in the winter period (October–March)
The table illustrates, that the winter 2005/2006 was really extraordinary.
The number of days with exceedances of the value 50 خ¼g.m-3 in the locality
Mikulov-Sedlec was more than double in comparison with any of the previous
winter periods. In the locality Brno-Tuإ™any the double number of days with
exceedances was not achieved, nevertheless this locality had also the highest
number of exceedances of the concentration 50 خ¼g.m-3 in the winter period
2005/2006.
Significant difference is evident in comparison of the winter periods
2005/2006 and 2006/2007. The following graphs for the localities Mikulov-Sedlec
and Brno-Tuإ™any compare the two winter periods, both with regard to the
exceedance of the concentration 50 خ¼g.m-3 (bar graph) and average monthly
concentrations (line graph).
The presented graphs (Fig. II.4.1.4) show that mainly January 2006 was an
extraordinary month (e.g. the station Mikulov-Sedlec recorded 19 exceedances in
January 2006 and 1 exceedance in January 2007), and the air quality was worse
also in the remaining months of the winter period 2005/2006. There was one
exception , and namely the month of December in the locality Brno-Tuإ™any, where
the air quality was worse in December 2006 than in December 2005.
Fig. II.4.1.4 24-hour PM10 concentrations and numbers of exceedances of limit
value in winter period (October–March) 2005/06 and 2006/07
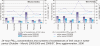
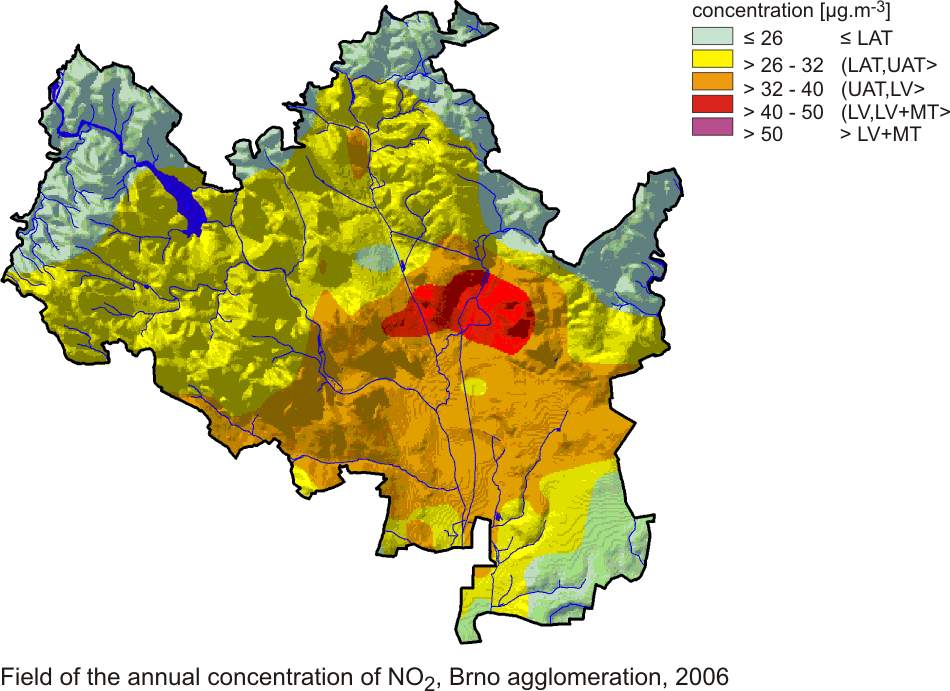
Fig. II.4.1.5 Field of the annual concentration of NO2, Brno agglomeration, 2006
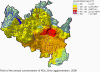
Fig. II.4.1.6 Field of the annual concentration of benzo(a)pyrene, Brno
agglomeration, 2006
II.4.1.3 The Moravian-Silesian Region
The ambient air pollution in the agglomeration Moravian-Silesian Region is
connected, in addition to high population density, also with high concentration
of industry, and namely in the following cities: Ostrava, Karvinأ،, Havأإ™ov,
ؤŒeskأ½ Tؤ›إ،أn and Tإ™inec.
In 2006 PM10 concentrations were monitored in 25 localities (19 CHMI, 5 Zأڑ and 1
Mأڑ Tإ™inec) in the agglomeration Moravian-Silesian Region. The exceedance of the
PM10 24-hour limit value was reached most frequently at the stations in the
districts Karvinأ، and Ostrava-mؤ›sto, then in several parts of the districts
Frأ½dek-Mأstek, Novأ½ Jiؤچأn and Opava. The highest number of exceedances of the
value of 50 خ¼g.m-3 was recorded in the following localities: ؤŒeskأ½ Tؤ›إ،أn (186x),
Ostrava-Bartovice (172x), Bohumأn (169x), Ostrava-Pإ™أvoz (149x), Karvinأ، (145x),
Ostrava-ؤŒeskobratrskأ، (144x), Vؤ›إ™إˆovice (143x), Orlovأ، (141x), Havأإ™ov (135x),
Karvinأ،-Zأڑ (126x), Ostrava-Fifejdy (112x) and Ostrava-Pإ™أvoz Zأڑ (110x). In total,
23 localities with the valid annual average exceeded the PM10 24-hour limit
value.
The exceedances of the PM10 annual limit value (40 خ¼g.m-3) were recorded also
mostly in the above districts. The highest annual average was recorded at the
following localities: (Vؤ›إ™إˆovice (64 خ¼g.m-3), Ostrava-Bartovice (64 خ¼g.m-3),
Bohumأn (63 خ¼g.m-3), ؤŒeskأ½ Tؤ›إ،أn (61 خ¼g.m-3), Orlovأ، (58 خ¼g.m-3), Karvinأ، (57
خ¼g.m-3), Ostrava-Pإ™أvoz (56 خ¼g.m-3), Havأإ™ov (55 خ¼g.m-3), Ostrava-ؤŒeskobratrskأ،
(54 خ¼g.m-3), Karvinأ،-Zأڑ (48 خ¼g.m-3) and Ostrava-Fifejdy (47 خ¼g.m-3). The limit
value for annual average was exceeded in 18 localities in this region.
The localities which measured PM2.5 fraction in 2006 in the Moravian-Silesian
Region rank among the top localities as for the highest measured concentrations
within the Czech Republic. In the locality Vؤ›إ™novice the annual average amounted
to 50.4 خ¼g.m-3, in Ostrava-Pإ™أvoz 44 خ¼g.m-3, in Ostrava-Zأ،bإ™eh 35.1 خ¼g.m-3 and
in Ostrava-Poruba 31.4 خ¼g.m-3. It is evident that all localities would markedly
exceed the proposed limit value.
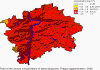
NO2 concentrations were measured in total in 27 localities in 2006 (20 CHMI, 4
Zأڑ, 2 ؤŒEZ and 1 Mأڑ Tإ™inec). The AMS Ostrava-ؤŒeskobratrskأ، (hot spot) recorded
the NO2 annual limit value exceedance; the limit value plus the margin of
tolerance was not exceeded.
The highest benzo(a)pyrene concentrations in the Czech Republic in 2006 occurred
again in the Moravian-Silesian Region (locality Ostrava-Bartovice). The above-the-limit
concentrations were measured in all 6 localities which measured this pollutant
in 2006.
Another problem is caused by the high benzene concentrations which, similarly as
in the previous year, exceeded the limit value (as the only ones in the Czech
Republic) in both localities with the highest industrial loads, i.e.
Ostrava-Pإ™أvoz (Zأڑ and CHMI). In 2006 benzene concentrations were monitored in 7
localities of the Moravian-Silesian Region.
In 5 localities (of the total number of 7) the target limit values for ground-level
ozone was exceeded as well, mainly in localities with lower traffic loads, and
namely: ؤŒervenأ،, Bأlأ½ kإ™أإ¾, Tإ™inec Kosmos, Ostrava-Fifejdy and Karvinأ،.
The target value for arsenic was also exceeded at 2 localities with the highest
air pollution loads (Ostrava-Bartovice and Ostrava-Mariأ،nskأ© Hory). Arsenic
concentrations were monitored in 11 localities in the Moravian-Silesian Region
in 2006.
The following text presents the detailed description of unfavourable situation
of January 2006 which resulted in significant increase of air pollution
concentrations in the Moravian-Silesian Region.
Unfavourable air pollution situation in the Moravian-Silesian agglomeration
in January 2006
In the first week of January 2006 the territory of the Czech Republic was
influenced by the extending anticyclone with the centre above north-eastern
Europe and by the abating relatively strong precipitation from December 2005/January
2006 which caused the continuous and relatively rich snow cover in the whole
territory of northern Moravian and Silesia. The minimum temperatures ranged
between –1 and –6 °C, the maximum temperatures very slightly exceeded 0 °C (not
at all stations). At the end of the week the centre of the anticyclone moved
moderately to the west above the Baltic area and southern Scandinavia. This was
connected with lower precipitation and lower cloudiness which consequently,
resulted in significant decrease of minimum daily temperatures. On 7 January the
minimum morning temperatures ranged between –10 and –15 °C in lower altitudes,
while in higher altitudes, due to the strengthening inversion character of the
whole situation, the temperatures ranged around only –8 °C. The velocity of
ground-level airflow decreased, especially in lower altitudes (average wind
velocity measured at the stations in 10 m above the ground did not exceed 2
m.s-1 in most cases). The situation lasted for several following days. Beginning
from 11 January the influence of the anticyclone gradually weakened, the
inversion character of the weather ceased and the velocity of airflow increased.
Significant change of meteorological situation occurred as late as 16 January,
when the influence of the anticyclone weakened and individual frontal systems
began to enter central Europe from the north-west; they brought the change of
character of airflow and precipitation.
The deteriorating dispersion conditions of the ambient air had their most
significant impact on the increase of PM10 suspended particles concentrations.
In early January the PM10 concentrations remained below, or only slightly
exceeded the 24-hour limit value 50 خ¼g.m-3, on 7 and 8 January, however, most of
the stations in both regions recorded much higher concentrations. On 8 January
the values ranged between 110 and 408 خ¼g.m-3 (with the maximum at the station
Orlovأ،). The persisting and initially more significant character of inversion
situation resulted in further significant increase of concentrations during the
following days. The worst air pollution situation occurred on Tuesday, 9 January,
when the 24-hour PM10 concentrations ranged between 125 and 732 خ¼g.m-3, with the
highest values reached in the environs of Karvinأ،, Bohumأn and Orlovأ،.
With the weakening influence of the anticyclone the PM10 concentrations
gradually decreased beginning from 11 January. The marked decrease of PM10
concentrations was recorded after the change of meteorological situation in the
week from Monday 16 January when the influence of the anticyclone weakened and
the several-day episode of unfavourable air pollution situation came to an end.
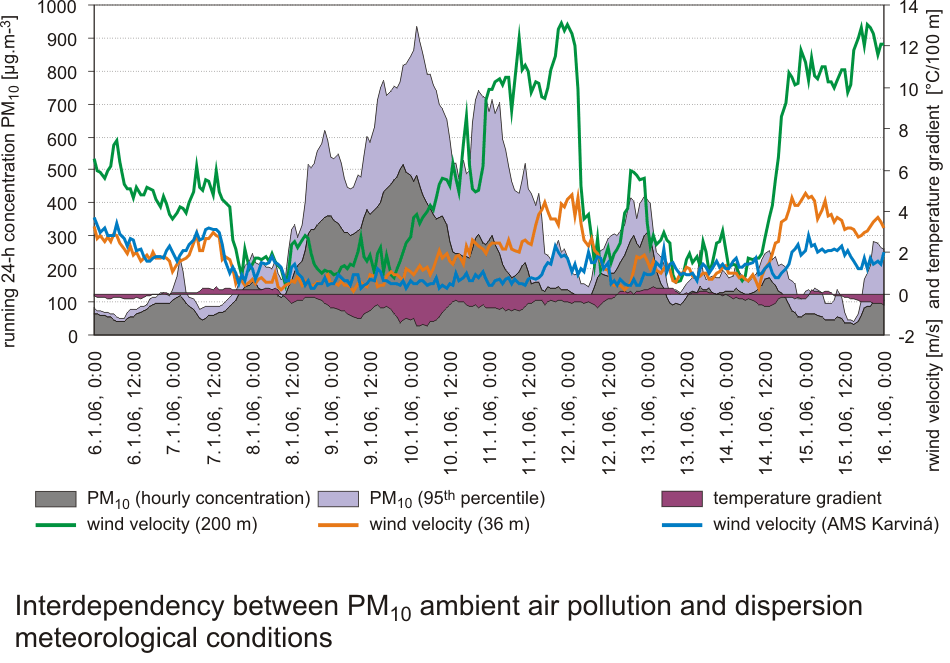
The described situation demonstrates quite clearly the dominant influence of
current meteorological dispersion conditions on air quality. Fig.
II.4.1.7 shows
the dependence between air pollution caused by PM10 and the meteorological
conditions. (Data on wind velocity in the elevation 200 m and 36 m come from
Ostrava, in the elevation 10 m from the AMS Karvinأ،. Vertical temperature
gradient of air was determined between the meteorological stations Moإ،nov (251 m
a.s.l.) and Lysأ، hora (1324 m a.s.l.). Vertical temperature gradient of air
quantifies the change of temperature with the change of the elevation. It is
expressed in °C per 100 m of height and it is negative during the increasing
temperature with the elevation, i.e. temperature inversion.)
With the decline of wind velocity and increasing inversion (characterized by
the temperature gradient of air in the figure) the PM10 concentrations increased
beginning from 7 January. With the increasing wind velocity between 10 and 11
January the concentrations decreased, however, due to the remaining inversion
they were high, and they increased again after the wind velocity reduced. The
decisive decline in PM10 concentrations occurred as soon as the airflow
increased and, simultaneously, the temperature inversion disappeared. Fig.
II.4.1.8 shows the course of average 24-hour PM10 concentrations during the
studied period.
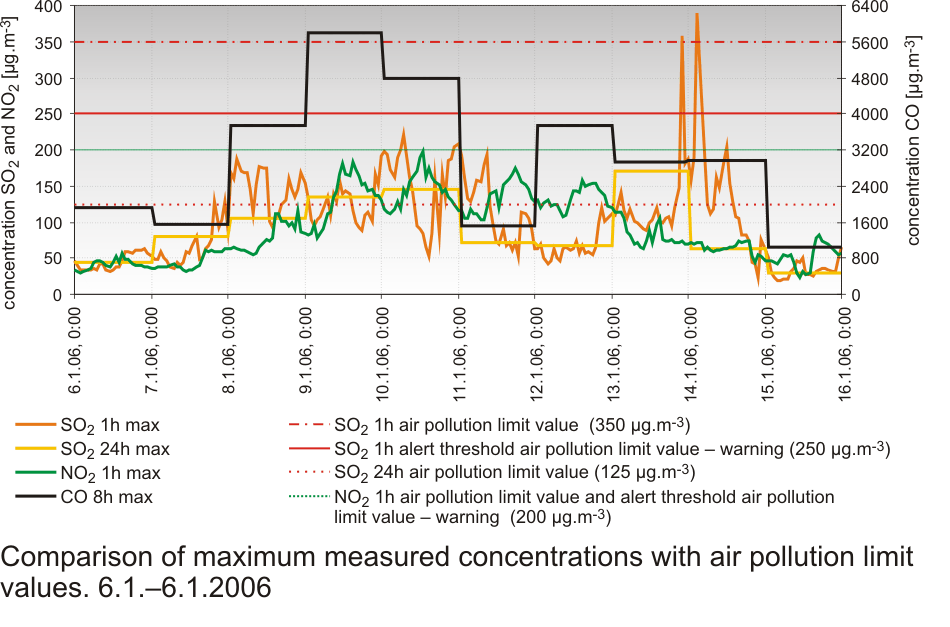
Of course, during the unfavourable situation, the dispersion conditions
deteriorated for all pollutants in the ambient air, not only for suspended
particles. In spite of the fact that PM10 concentrations exceeded the 24-hour
air pollution limit value (50 μg.m-3) in manifold levels, other pollutants
recorded only slight exceedances at several stations only or not at all (see Fig.
II.4.1.9).
The value of the 1-hour limit value (350 خ¼g.m-3) for SO2 was exceeded only for
two hours, and namely at the AMS station Ostrava-Zأ،bإ™eh with the maximum value
389 خ¼g.m-3; all the remaining values at all AMS did not reach even 2/3 of the
limit value, with the exception of two values.
The value of the 24-hour limit value (125 خ¼g.m-3) for SO2 was exceeded only on 9
and 10 January at the AMS Vؤ›إ™novice and on 13 January at the AMS Ostrava-Zأ،bإ™eh
and Ostrava-Poruba (the maximum value of 171 خ¼g.m-3).
The value of the 1-hour limit value of 200 خ¼g.m-3 for NO2 was not exceeded at
any AMS; the highest measured concentration was 197 خ¼g.m-3.
The value of the 8-hour limit value of 10,000 خ¼g.m-3 for CO was not exceeded at
any AMS; even the traffic AMS Ostrava-ؤŒeskobratrskأ،, which usually has the
highest values, reported 5,802 خ¼g.m-3 as its highest measured value.
Pursuant to the valid legislation (Decree No. 553/2002 Coll., as amended) the
conditions for the issuing of neither the signal for the information of the
public nor the regulation were fulfilled, i.e. the smog situation did not occur.
The unfavourable air pollution situation in January 2006 showed again that the
long lasting unfavourable dispersion conditions for the pollutants in the
ambient air result in the increased concentrations of PM10 suspended particles
amounting up to manifold levels of the daily limit value. During the January
2006 situation even higher values were measured in comparison with those in
similar situation of February 2005.
Another unfavourable air pollution situation with high concentrations of
suspended particles started after the income of very cold air on 22 January,
again in connection with the massive anticyclone. The increased concentrations
lasted until 6 February, the highest concentrations were measured between 23 and
29 January. At most stations, however, the maximum PM10 concentrations during
this situation, did not reach the levels of the episode described above in
detail.
The concentrations of suspended particles increased also in other areas of the
Czech Republic in the described periods.
The relation between air pollution concentrations and meteorological
conditions and air pollution in the Ostrava city caused by PM10 particles during
the three recent winter periods
The level of air pollution in the respective area and period is significantly
influenced by meteorological dispersion conditions. This can be demonstrated
e.g. by the assessment of air pollution in the Ostrava city during the three
recent winter periods. Very slight character of the latest winter months
(December 2006–February 2007) resulted in the relatively favourable situation
during the whole period.
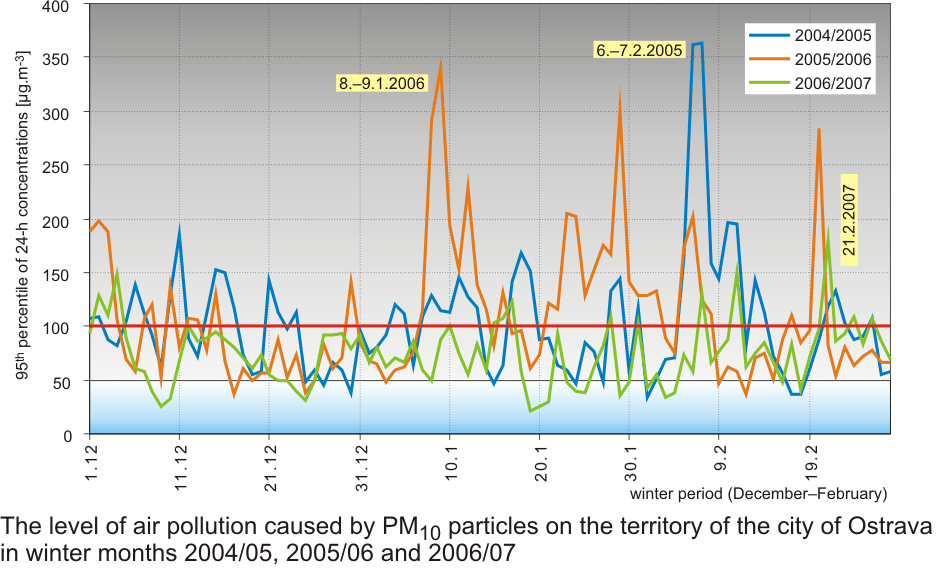
The level of air pollution caused by PM10 suspended particles in the territory
of Ostrava city during the three recent winter periods is shown in Fig.
II.4.1.10, in which 95th percentiles from all daily PM10 concentrations measured
on the given days in the territory of the Ostrava city are plotted. To
illustrate the situation, unfavourable air pollution episodes of February 2005
and of January 2006 are marked, and for comparison the day with the highest air
pollution levels in the latest winter period is also marked.
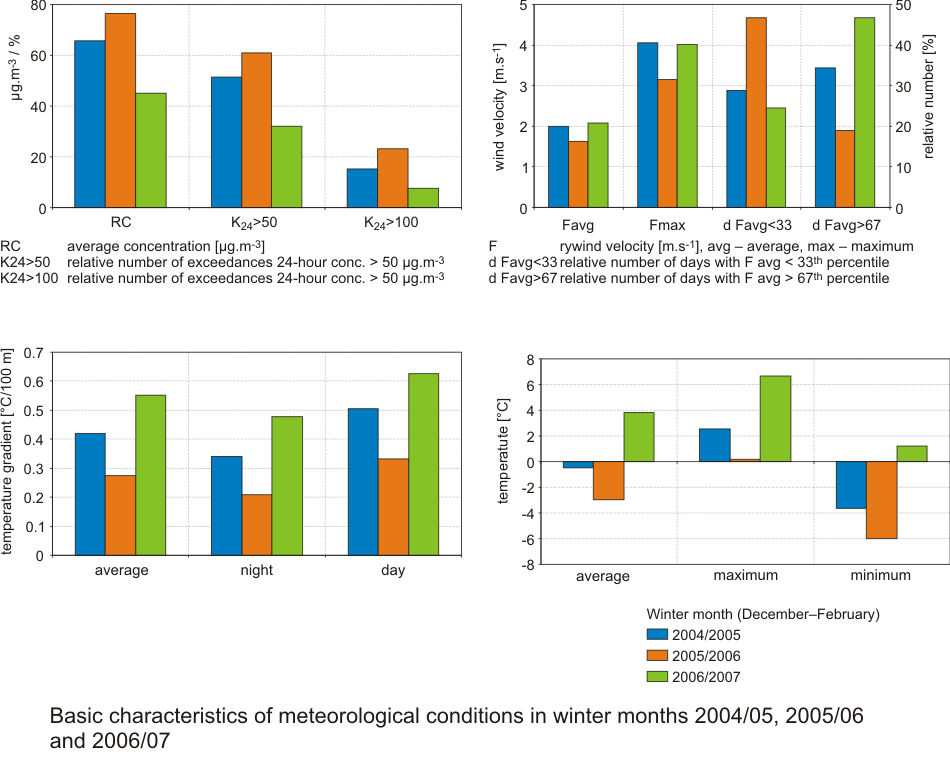
The first graph in Fig. II.4.1.11 shows the basic characteristics of the
level of air pollution caused by PM10 in Ostrava during the three recent winter
periods: the average concentrations and relative frequencies of the measured
daily concentrations higher than 50 and 100 μg.m-3 as the percentage of all
concentrations measured at the stations in Ostrava in the given winter period.
It is evident that the worst air pollution situation occurred in the winter
period 2005/2006; the period 2006/2007was relatively most favourable.
Further graphs in Fig. II.4.1.11 show the basic characteristics of
meteorological dispersion conditions in the assessed recent three winter periods.
The results show quite clearly that air pollution situation reflects the
meteorological dispersion conditions. In the winter period 2005/2006 all
assessed characteristics testify to the most unfavourable meteorological
dispersion conditions, and on the contrary, the winter period 2006/2007 had the
most favourable dispersion conditions: winter season 2005/2006 had the lowest
average and maximum daily wind velocity and the highest number of days with low
winter velocity. On the contrary, the number of days with higher wind velocity
was the lowest. The thermal stratification (the assessments used the average
values of the temperature pseudogradient between the stations Moإ،nov and Lysأ،
hora calculated from daily average, minimum and maximum temperatures) was most
stable in the winter period 2005/2006, and most unstable, again, in the latest
period 2006/2007. The latest winter period 2006/2007 was the warmest winter of
the assessed periods, and 2005/2006 was definitely the coldest one.
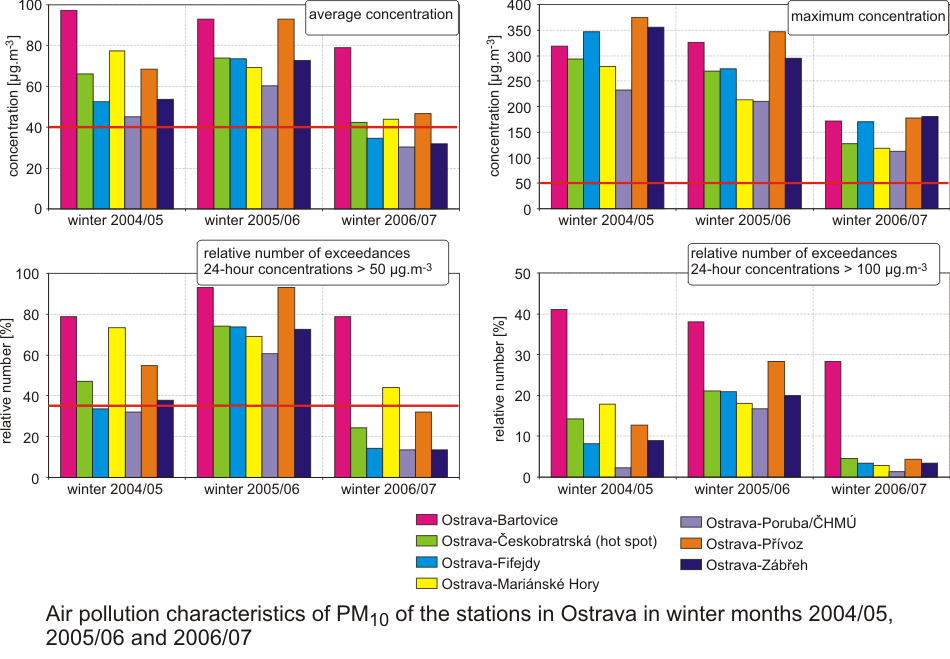
The graphs in Fig. II.4.1.12 show the PM10 air pollution characteristics for
individual stations in Ostrava. The assessed results correspond with the
presented conclusions at most stations, with the exception of the Zأڑ station
Ostrava-Bartovice. This station is located, with regard to the prevailing winds
in the Ostrava area, in the leeward side of the large source Mittal Steel
Ostrava Co. and whereas the average concentrations for the winter period
2006/2007 recorded at stations in Ostrava ranged between 50 and 60 % of the
average concentrations for 2004/2005–2005/2006, station Ostrava-Bartovice
reached 83 %. The relative frequency of daily concentrations higher than the
value of the daily limit decreased to 24–62 % at the stations in Ostrava in the
winter period 2006/2007 as compared with the previous winter periods. In
Bartovice, however, it decreased only to 92 %. The results confirm the local
influence of the monitored locality, independent of general dispersion
conditions in the given region.
Fig. II.4.1.7 Interdependency between PM10 ambient air pollution and
dispersion meteorological conditions
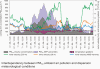
Fig. II.4.1.8 Average 24-hour PM10 concentrations, Moravian-Silesian
agglomeration, 6.1.–15.1.2006

Fig. II.4.1.9 Comparison of maximum measured concentrations with air pollution
limit values. 6.1.–6.1.2006

Fig. II.4.1.10 The level of air pollution caused by PM10 particles on the
territory of the city of Ostrava in winter months 2004/05, 2005/06 and 2006/07
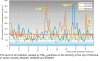
Fig. II.4.1.11 Basic characteristics of meteorological conditions in winter
months 2004/05, 2005/06 and 2006/07
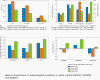
Fig. II.4.1.12 Air pollution characteristics of the stations in Ostrava in
winter months 2004/05, 2005/06 and 2006/07
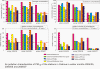
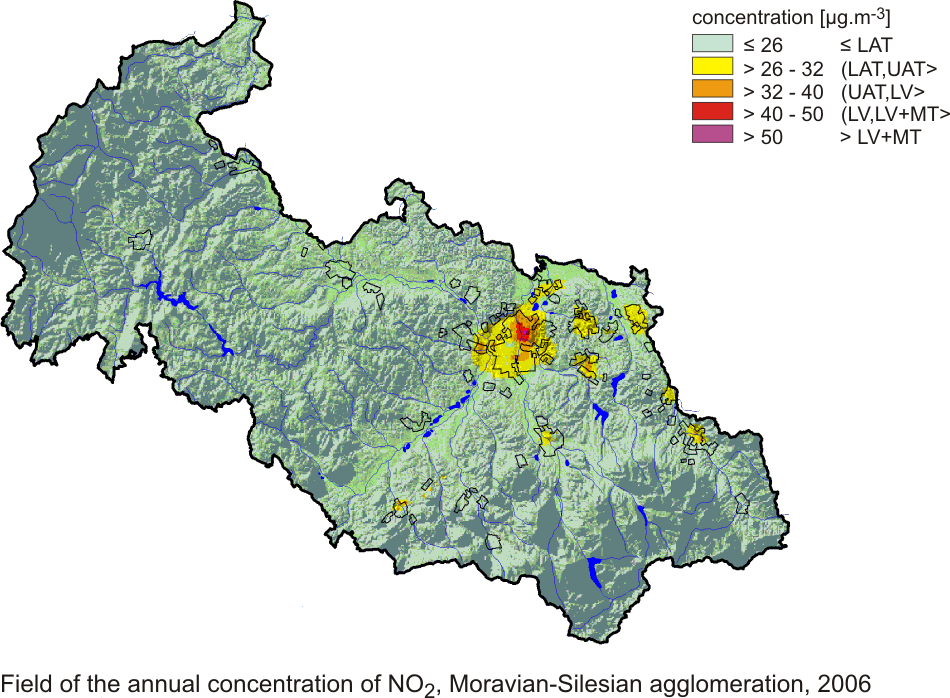
Fig. II.4.1.13 Field of the annual concentration of NO2, Moravian-Silesian
agglomeration, 2006
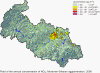
Fig. II.4.1.14 Field of the annual concentration of benzo(a)pyrene,
Moravian-Silesian agglomeration, 2006
II.4.1.4 Other areas with air pollution loads with higher density of
population
The أڑstأ nad Labem Zone
The أڑstأ nad Labem Region is defined as a zone. This area has high population
density and is highly industrialized, and thus a number of pollutants have above-the-limit
concentrations.
In 2006, PM10 concentrations were measured in 26 localities (18 CHMI, 7 Zأڑ, 1
Sإ ZE إ½atec) in the أڑstأ nad Labem Region. The exceedances of the 24-hour limit
value for PM10 occurred mostly in the أڑstأ nad Labem, Teplice and Most districts.
The highest numbers of exceedances of the value 50 خ¼g.m-3 were recorded in the
following localities: أڑstأ n.L.-Vإ،eboإ™ickأ، (117x), أڑstأ n.L.-mؤ›sto (87x),
Teplice (82x), Most (81x), Lom (79x), Dؤ›ؤچأn (74x), إ½atec (69x), Litomؤ›إ™ice (65x)
and Lovosice-Mأڑ (62x). In total, 15 localities in the أڑstأ nad Labem Region
exceeded the PM10 24-hour limit value. The exceedance of the PM10 annual limit
value was recorded at the following stations: أڑstأ n.L.-Vإ،eboإ™ickأ، (46 خ¼g.m-3),
أڑstأ n.L.-mؤ›sto (44 خ¼g.m-3), Teplice (43 خ¼g.m-3), Most (41 خ¼g.m-3) and Lom (40.4
خ¼g.m-3).
The annual average PM2.5 concentration in the locality Teplice reached the value
of 26.8 خ¼g.m-3 and 25.6 خ¼g.m-3 in Most. The proposed limit value was thus
exceeded in both localities. The annual average concentration reached 23.7
خ¼g.m-3 in Lom and 22.9 خ¼g.m-3.in أڑstأ n.L.-Koؤچkov.
In 2006 NO2 concentrations were monitored in 36 localities in the أڑstأ nad Labem
Region (19 CHMI + 17 of other organizations). The station أڑstأ n.L.-Vإ،eboإ™ickأ،
and Zأڑ station Dؤ›ؤچأn, which are significantly influenced by traffic, exceeded
the annual limit value of NO2 but not the limit value plus the margin of
tolerance.
24-hour limit value for SO2 was exceeded in 2 localities: أڑإ،tؤ›k (8x) and
Kostomlaty pod Mileإ،ovkou (4x). The hourly SO2 limit value was not exceeded.
Occasionally the exceedances of hourly concentration 350 خ¼g.m-3 or, in other
localities, of 24-hour average concentration 125 خ¼g.m-3 occurred, in most cases
at the stations operated by ؤŒEZ. The number of exceedances, however, remained
within the tolerated range.
The target value for benzo(a)pyrene was exceeded at all 4 localities in the أڑstأ
nad Labem Region which measured this pollutant in 2006 (Teplice, أڑstأ nad Labem-Zأڑ,
Pasteurova, Most, أڑstأ n. L.-Koؤچkov)
The target value for ground-level ozone was markedly exceeded similarly as in
other parts of the Czech Republic, and mainly at the stations with lower traffic
loads. The exceedances were recorded in 6 localities of the total number of 12
localities.
Increased PM10 concentrations in the north-western Bohemia
The episodes of unfavourable dispersion conditions, which occurred at the
beginning of the year 2006 as well as in the previous years, were accompanied in
north-western Bohemia by the increased PM10 concentration in the ambient air.
Due to the exceedances of the PM10 limit values the large part of the territory
of the أڑstأ nad Labem Region is listed among the areas with deteriorated air
quality.
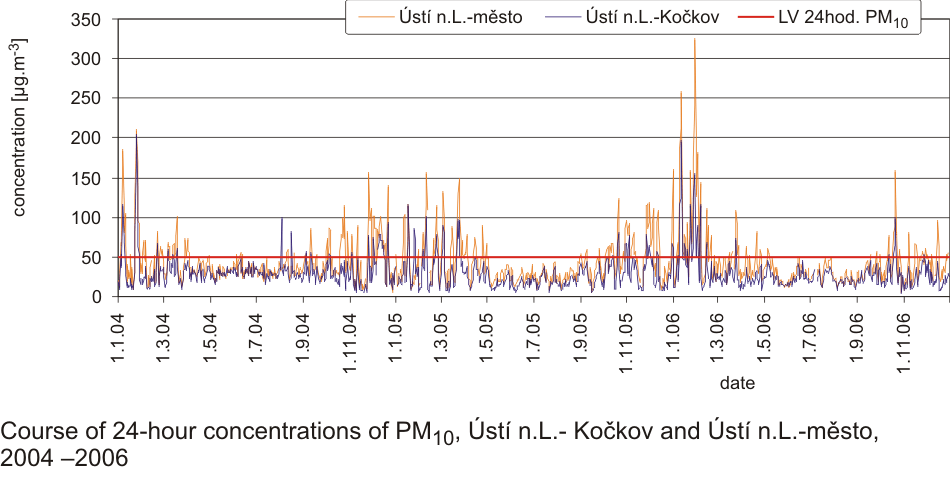
The following tables and figures present the examples and courses of the
increased PM10 concentrations in the localities أڑstأ n. L.-mؤ›sto (urban
background) and أڑstأ n.L.-Koؤچkov (suburban background), The situation was
similar also at other measuring stations in the foothills of the Kruإ،nأ© hory Mts.
It can be seen from the Table II.4.1.2 and Fig. II.4.1.15 that the situations
when the PM10 concentrations were exceeding the 24-hour limit value (50 μg.m-3)
for several subsequent days, were relatively frequent in أڑstأ nad Labem during
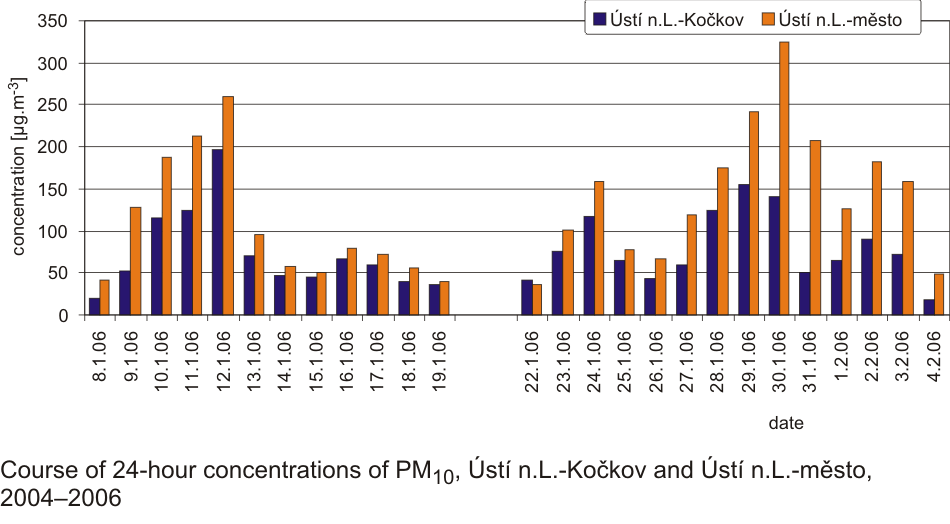
the monitored period. Fig. II.4.1.16 presents the selected episodes with the
occurrence of the highest concentrations, during which the measured levels of
the PM10 24-hour limit value (50 μg.m-3) were multiple for several days, and the
average daily PM10 concentration reached on at least 4 days the value of 100 μg.m-3
and on at least one day it was not lower than 150 μg.m-3.
Tab.II.4.1.2 The assessment of the measured PM10 concentrations, localities
أڑstأ n.L.-mؤ›sto and أڑstأ n.L.-Koؤچkov, 2004–2006
Fig. II.4.1.15 Course of 24-hour concentrations of PM10, أڑstأ n.L.- Koؤچkov
and أڑstأ n.L.-mؤ›sto, 2004–2006
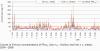
Fig. II.4.1.16 Average 24-hour concentration of PM10, أڑstأ n.L.-Koؤچkov and أڑstأ
n.L.-mؤ›sto, 8.1.–19.1.2006 and 22.1.–4.2.2006
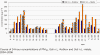
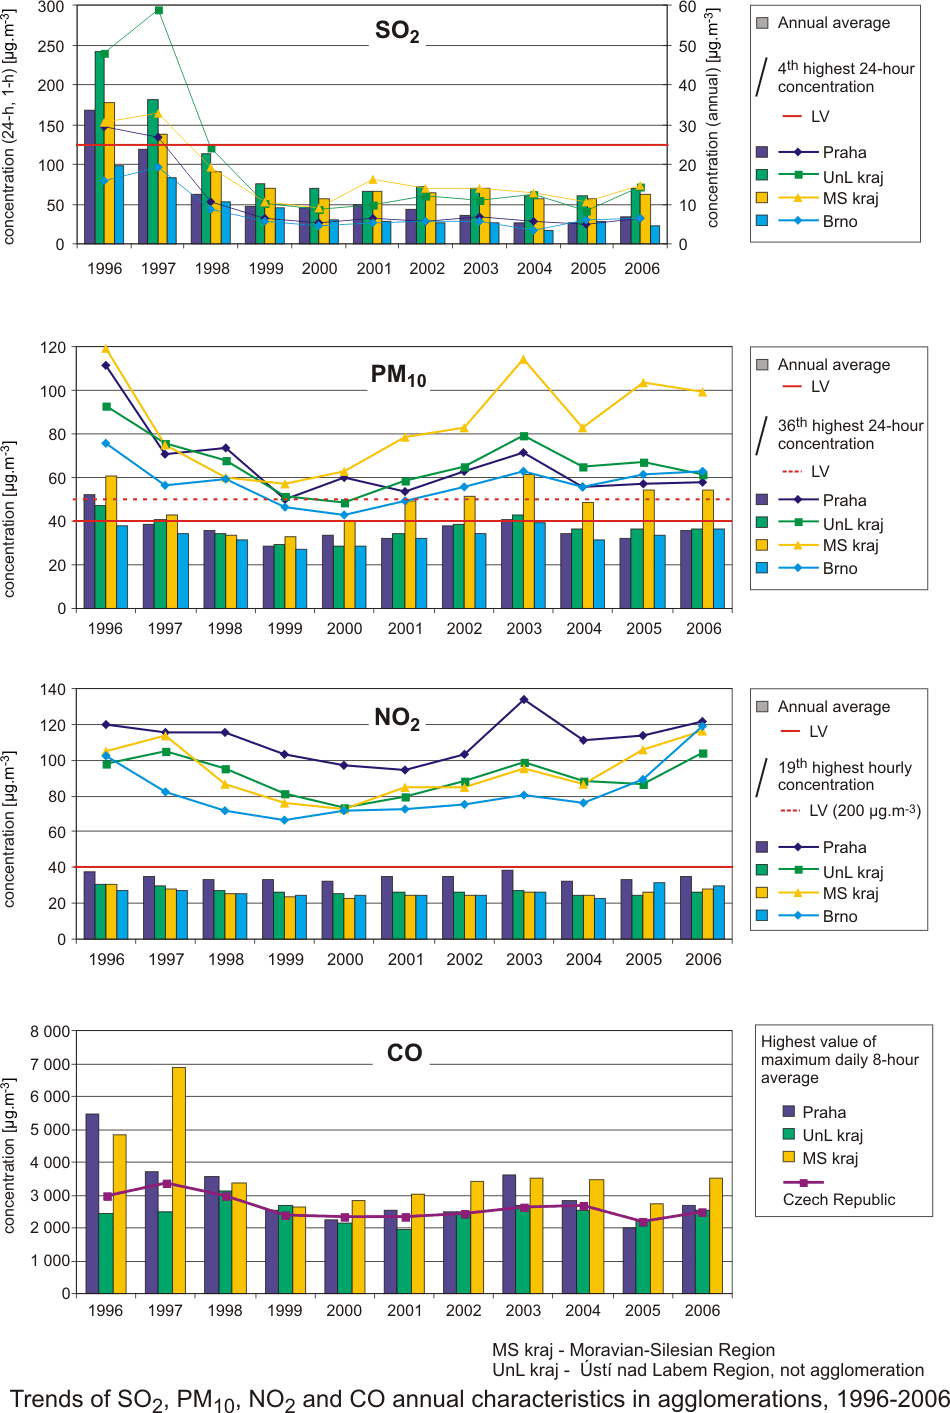
4.1.5 Trends of annual air pollution characteristics of SO2, PM10 and NO2 for
the period 1996–2006
Fig II.4.1.17 shows the trends of SO2, PM10, NO2 and CO annual air pollution
characteristics in 1996–2006 for the following agglomerations: Prague, Brno and
Moravian-Silesian Region and for the zone أڑstأ nad Labem Region.
Up to 1999 there was a significant decreasing trend in SO2 and PM10
concentrations in the agglomerations, the NO2 concentrations decreased only
slightly. In 2001 the decreasing trend was interrupted and, on the contrary, the
SO2 and NO2 concentrations slightly increased; PM10 concentrations increased
significantly, mainly in the Ostrava agglomeration. In 2004, on the contrary,
concentrations of all pollutants monitored in the agglomerations decreased, and
SO2 concentrations slightly increased in the أڑstأ nad Labem Region. Since 2005
NO2 air pollution has returned to the increasing trend, which was confirmed in
2006. As concerns PM10, there has been a similar characteristic increasing trend
since 2005, with the steepest progress in the Moravian-Silesian Region. In 2006,
however, this trend continued only in the Prague and Brno agglomerations. In the
أڑstأ nad Labem Region and in the Moravian-Silesian Region, on the contrary,
slight decrease of 24-hour PM10 concentrations and stagnation of annual PM10
concentrations were recorded. In 2006 the prevailing decreasing trend in air
pollution caused by SO2 was interrupted. SO2 concentrations recorded a slight
increase in the agglomerations, and they stagnated in Brno. CO concentrations
have remained at similar level since 1999. The highest average concentrations
have been regularly measured in the Moravian-Silesian Region since 2000.
Fig. II.4.1.17 Trends of SO2, PM10, NO2 and CO annual characteristics in
agglomerations, 1996–2006