|
|
AIR POLLUTION IN THE CZECH REPUBLIC IN 2001 Czech Hydrometeorological Institute - Air Quality Protection Division |
|
|
|
|
2. AMBIENT AIR POLLUTION LEVELS IN THE CZECH REPUBLIC
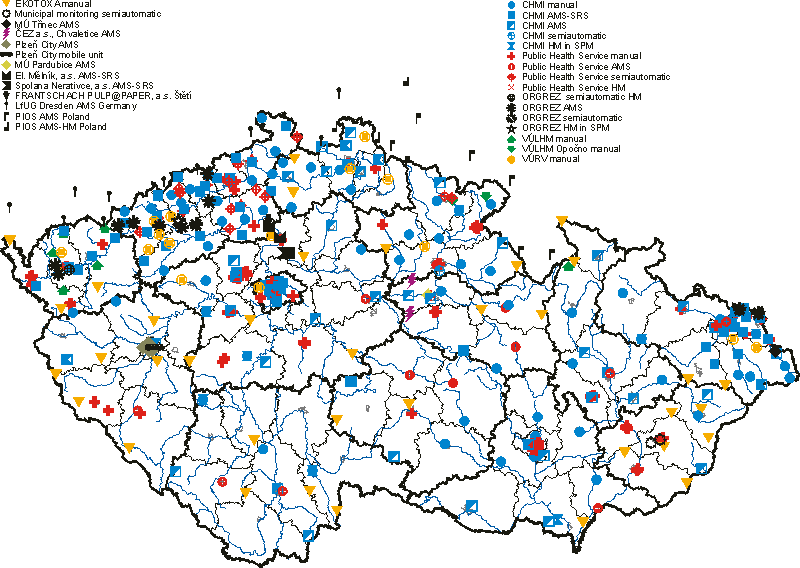
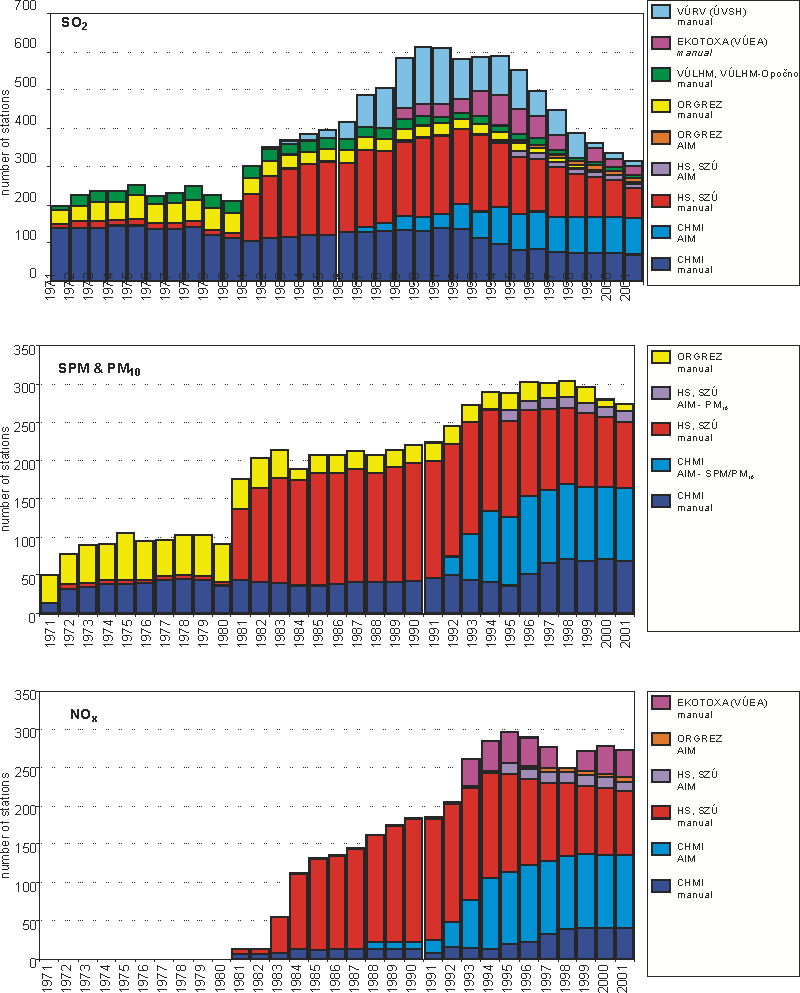
2.1 NETWORKS OF AMBIENT AIR QUALITY MONITORING STATIONS The ambient air pollution situation has been assessed based on the data archived in the ISKO air pollution database. In addition to the data from CHMI networks, several other organisations that play an important role in air pollution monitoring in the Czech Republic have also been contributing to the ISKO database for a number of years. As it was stated in the Preface, since 1996, the data for the German part of the Black Triangle has been included and presented in the air pollution ISKO database, and the data for the Poland part of the Black Triangle has been included since 1997. Table 2.1.1 provides a clear view of the numbers of measuring sites in individual regions according to the new territorial administrative units of the Czech Republic, broken down by organisations/branches operating the respective monitoring network. Usually one type of measuring station (one measuring programme) is only installed per site. Several sites, particularly the CHMI ones, operate more than one type of station, for example those at Libuš, Košetice, Bílý Kříž and some other sites at which both automatic (AIM – Automated Air Pollution Monitoring) and hand-operated stations have been installed, as also those intended for the monitoring of heavy metals in SPM and other purposes. The registration of stations together with the type of their measurements are both updated on an annual basis. In addition to the number of registered stations and the number of registered measurements, the number of �active� stations is also mentioned, calculated on the basis of the actual reception of data from these stations by the ISKO air pollution database in any given year. Table 2.1.2 lists the numbers of air pollution monitoring sites broken down by regions at which basic pollutants, incl. meteorological parameters, are monitored automatically, broken down by CHMI networks and networks of other organizations listed in the explanatory notes. At AIM stations the pollutants are measured by continual analysers and the measured concentrations are as 30 min averages transmitted in real time via switched lines or via radio transmission for further processing. Table 2.1.3 lists the numbers of sites in individual regions at which the listed pollutants are monitored by manual or semiautomatic methods, broken down by CHMI networks and networks of other organizations listed in the explanatory notes. The semiautomatic methods include the measurements with the use of continual analysers with subsequent off line processing. Table 2.1.4 presents the total numbers of stations in the regions measuring the pollutants not presented in Tables 2.1.2. and 2.1.3, broken down by organizations. Network density in each of the Czech Republic�s regions and in the Black Triangle, and monitoring organisations� involvement are illustrated in Fig. 2.1.1. The graph in Fig. 2.1.2 illustrates how the measurement of principal air pollutants has developed since 1971, using the data archived in ISKO database for the organisations and network types listed. The production of maps of air pollution characteristics presented in this Yearbook was guided by the classification of the measuring stations carried out within the research project VaV740/2/00 �Evaluation of the Czech Republic Readiness to Meet Air Quality Requirements of EU Directives and the LRTAP Convention� [3]. This classification is based on the Council Decision 97/101/EC on exchange of information (EoI) [4] and Criteria for EUROAIRNET [5]. The requirements of the Council Decision 97/101/EC are obligatory both for the EU Member States and for the associated countries. The complete EoI classification (Table 2.1.5) consisting of 3 fundamental letters divided by strokes is presented only in those stations at which it was officially affirmed by an expert team in accordance with local criteria. In some cases incomplete classification is presented (1–2 letters only) derived from the purpose of the station establishment. The correct application of this classification during the production of maps of fields of pollutants is bound to the recommended area of representativeness (radius of area) for the various station types:
Further details on station networks, the measurement methods used, on the detection limits of different methods used, and the detailed updated list of stations broken by territorial units and further specific data can be found in the summary Tabular Survey [2]. The degree of usability of the data supplied by the institutions that contributed to the ISKO database in the year under review (i.e. data capture) is listed in Tables 2.1.6, 2.1.7, 2.1.8 and 2.1.9. For the parameters assessed these tables compare the number of those stations in the networks reviewed, which meet the criteria for the validity of annual characteristics (see the numerator), and the total number of stations measuring the respective parameter (see the denominator). This proportion of valid data from the annual file, submitted for the given parameter by the respective organization/network, is expressed as percentage (see the number below the fraction). Data validity is based on the longest-lasting continuous failure in a year (NSV) and the minimum required percentage (MP) of valid data within the annual data file. Being the basic parameters of the criterion of comprehensiveness and uniformity of the data entered into the annual characteristics computations, the longest-lasting continuous failure in a year – expressed as a certain number of days – and the required minimum percentage of valid data are evaluated during the annual data processing, and stored as part of the annual data file for each station and for each parameter measured at that station, and are presented in the Tabular Surveys. The annual air pollution characteristic is regarded as valid if the longest-lasting continuous failure NSV < 20 and the minimum percentage of valid data MP > 66 %. Tab. 2.1.1 Air pollution monitoring sites, based on the owner and the regions, Czech Republic, 2001 Tab. 2.1.5 Exchange of Information (EoI) station classification Tab. 2.1.6 Percentage of valid data from the stations with continuous measurement Tab. 2.1.7 Percentage of valid data from the stations with manual measurement Tab. 2.1.8 Percentage of valid data from the stations measuring meteorological parameters Tab. 2.1.9 Percentage of data from other measurements
Fig. 2.1.1 Major station networks of ambient air quality monitoring, 2001
Fig. 2.1.2 Monitoring of principal pollutants in selected organisations - development
|