IV. AIR QUALITY IN THE CZECH REPUBLIC
IV.1 SUSPENDED PARTICLES
Air pollution by the PM10 and PM2.5 fractions of suspended particles remains one of the main problems of air quality assurance in the Czech Republic. Exceedances of limit values for PM10 and PM2.5 are still a significant reason for including municipalities among areas where limit values are exceeded. Since 2008, the monitoring of particles of the fine PM1 fraction gradually started at certain localities.
IV.1.1 Air pollution caused by suspended particles in the year 2014
Suspended particles of PM10 fraction
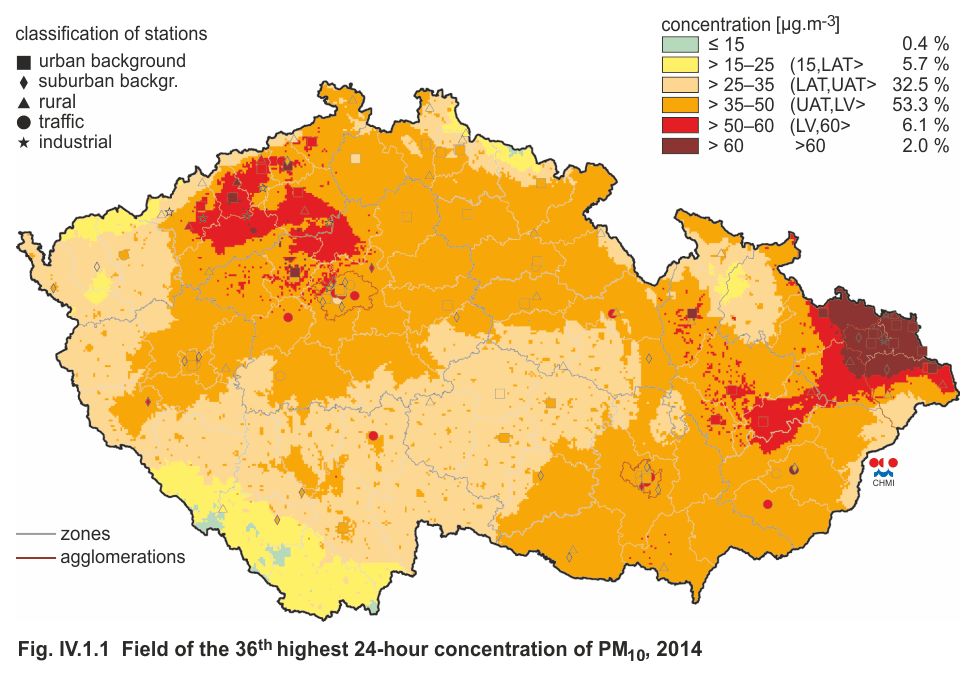
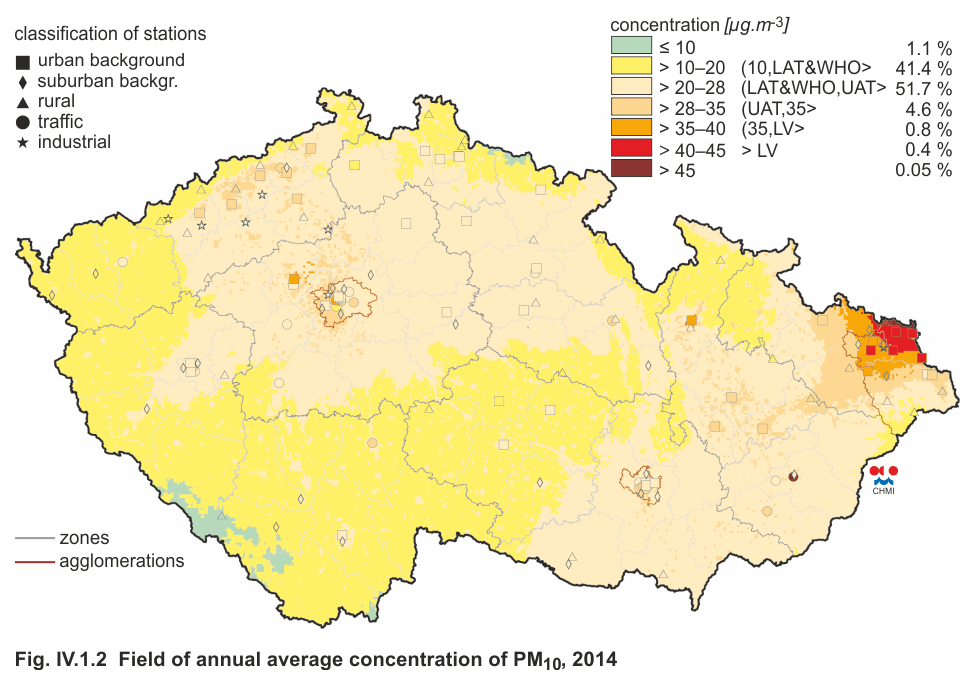
The limit value for 24-hour concentrations of PM10 was exceeded in 2014 in 8.1 % of the territory of the Czech Republic inhabited by approximately 24.4 % of the population, and the limit value for the annual average concentration of PM10 was exceeded in 0.45 % of the territory inhabited by approximately 2.2 % of the population (Figs. IV.1.1 and IV.1.2).
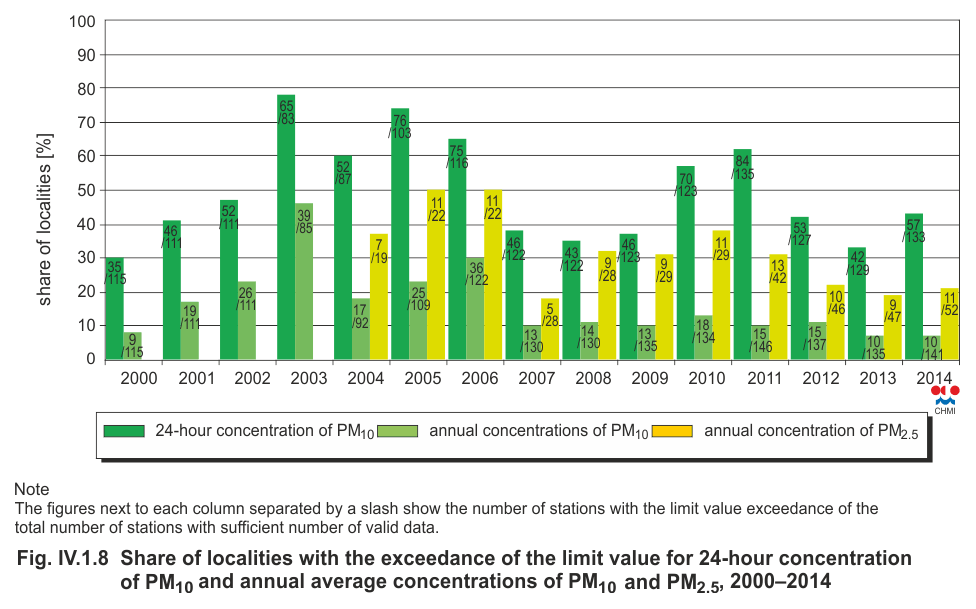
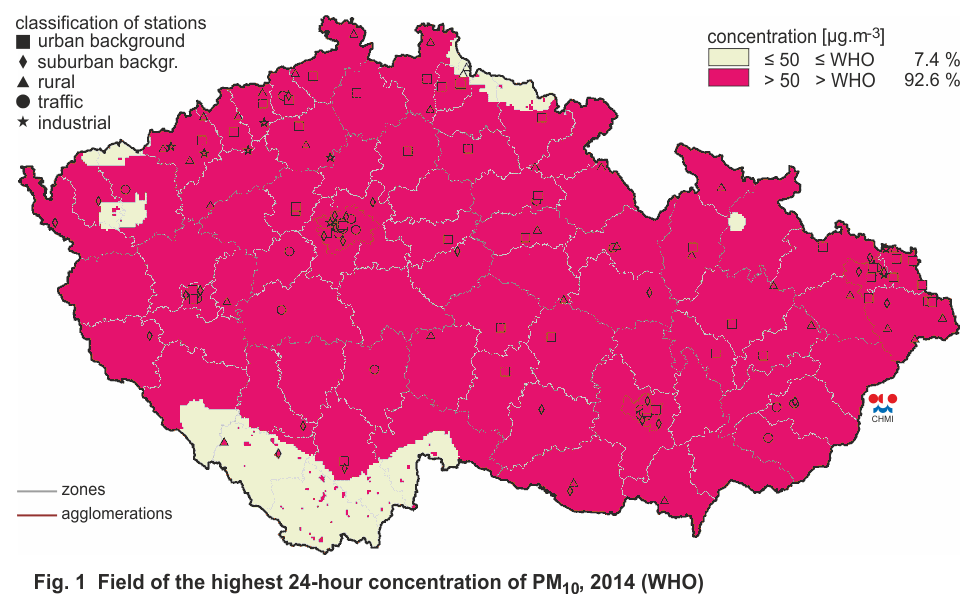
The exceedance of the 24-hour limit value for PM10 was recorded in 2014 at 42.9 % of stations (i.e. 57 stations out of the total number of 133 with sufficient data for the evaluation). In 2013 the daily limit value was exceeded at 32.6 % of stations (42 stations of 129; Fig. IV.1.8). In 2014 there was a percentage increase of the share of localities where the 24-hour limit for PM10 was exceeded. Consequently, the territory with the exceeded daily limit value for PM10 increased from 5.7 % of the Czech territory inhabited by about 15.9 of the population, to the already mentioned 8.1 % of the territory inhabited by approximately 24.4 % of the population. The mentioned increase of the area where the 24-hour limit was exceeded especially concerned the Ústí nad Labem region and the central Bohemia region. The recommended 24-hour value of PM10 set for the protection of human health by the WHO was exceeded in almost the entire area of the Czech Republic (93 %; Fig. 1, Annex IV).
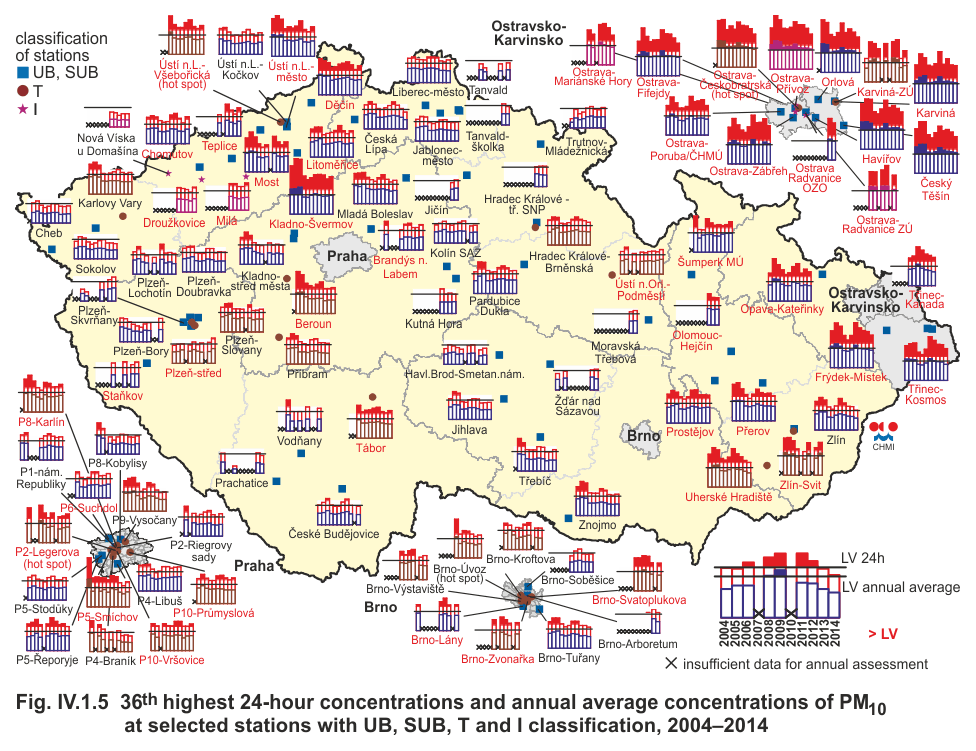
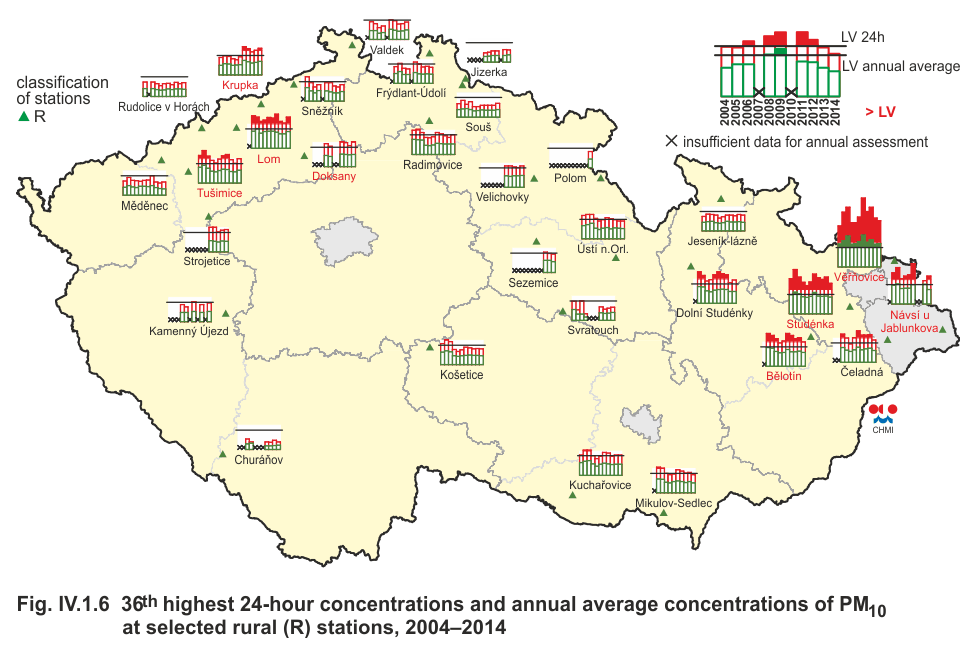
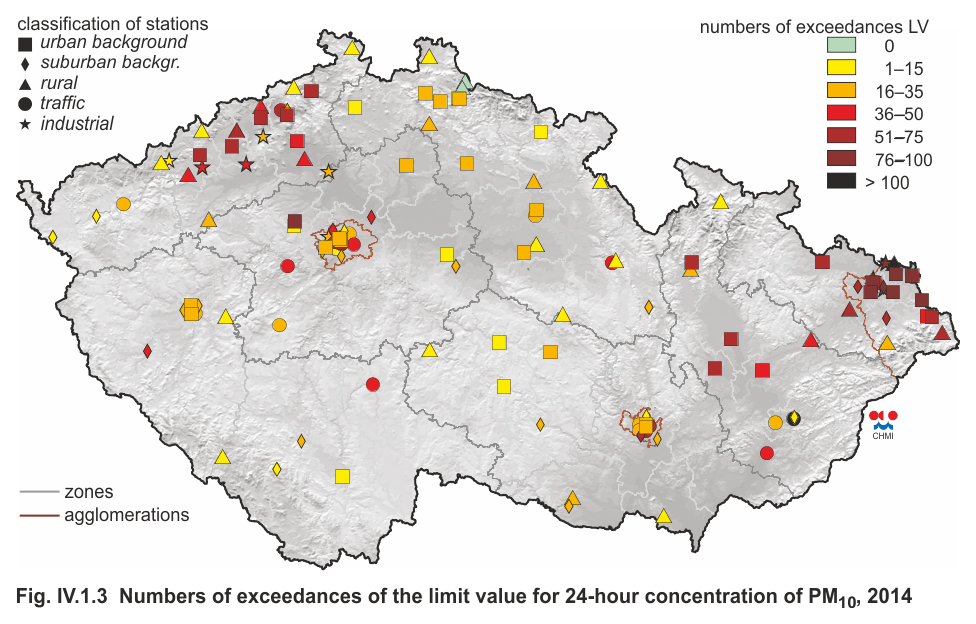
The most affected continuous area was, similarly as in the previous years (Figs. IV.1.5 and IV.1.6), the agglomeration of O/K/F-M, where the daily limit value for PM10 was exceeded in 2014 at almost all stations. However, the daily limit value for PM10 was exceeded in all zones and agglomerations in at least one locality with the exception of the South-eastern zone (Fig. IV.1.3, Table XIII.1). In the agglomerations of Prague and Brno, exceedances of the limit value in 2014 were connected primarily with traffic loads; in the O/K/F-M agglomeration and other zones, however, exceedances also occurred at urban, suburban and rural background stations.
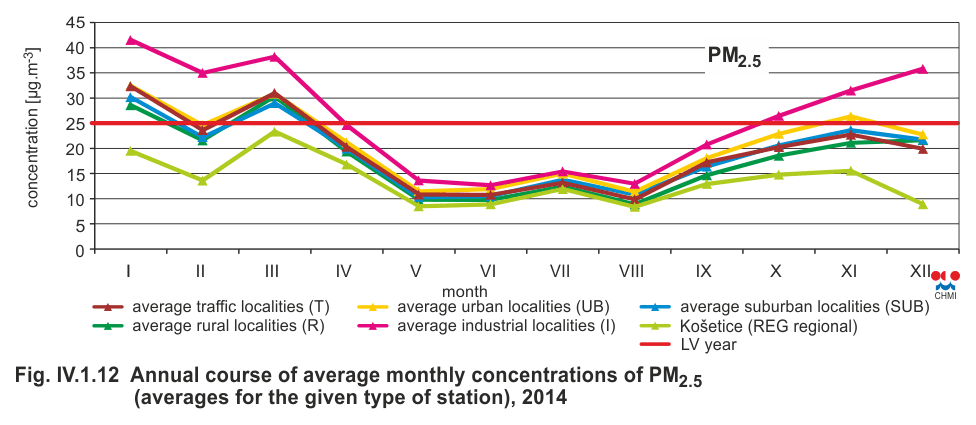
In 2014 the annual limit value for PM10 was exceeded at 7.1 % of stations, i.e. at 10 stations out of the total number of 141 stations in the Czech Republic with sufficient data for the evaluation. All the exceedances were recorded only at nine stations in the agglomeration of O/K/F-M and one station in the Central Moravia zone (Tables XIII.2 and XIII.5, Fig. IV.1.12). In 2013 exceedances of the annual limit value were recorded at 7.4 % of stations (10 stations of 136; Fig. IV.1.8). In 2014 the territory where the annual limit value was exceeded decreased to 0.45 % with approx. 2.2 % of inhabitants from 0.7 % of the territory with approx. 4.8 % of inhabitants in 2013.
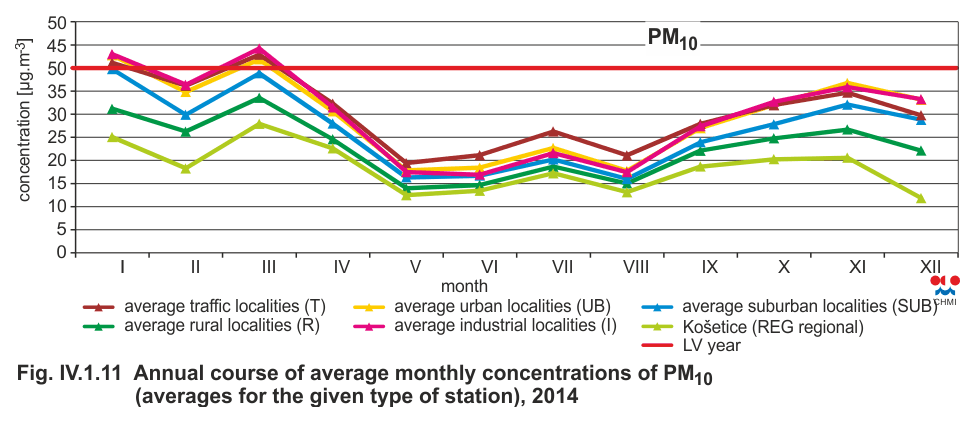
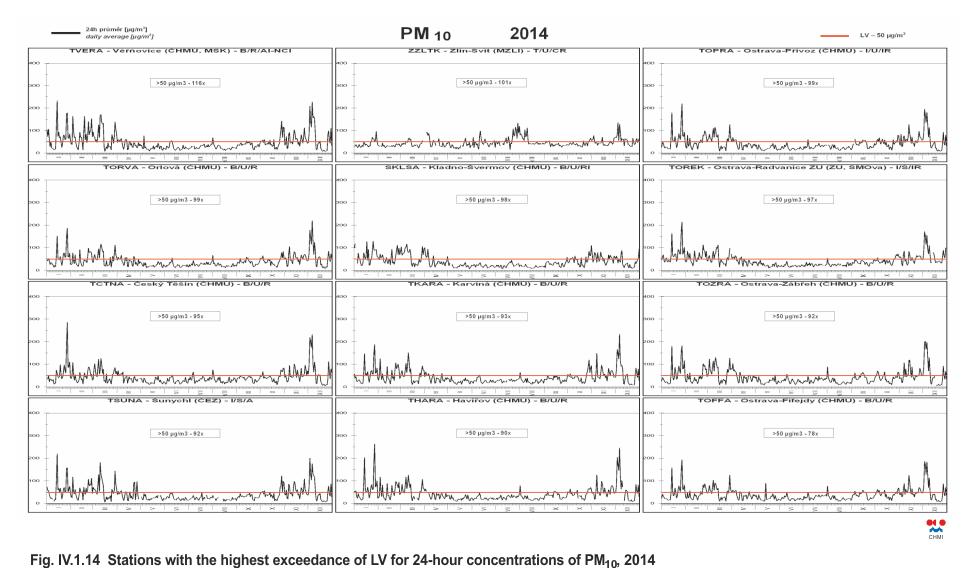
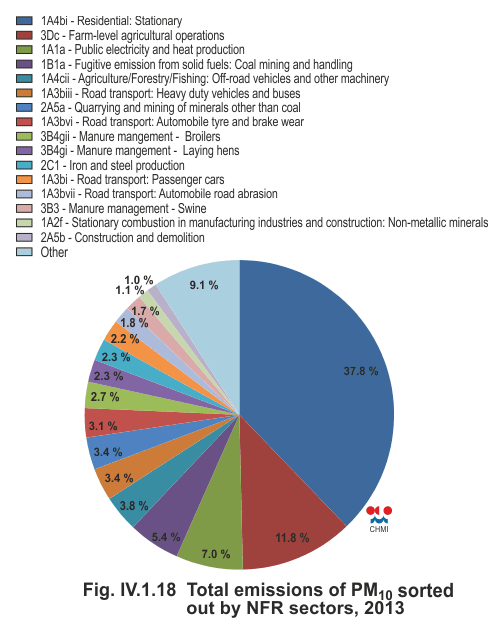
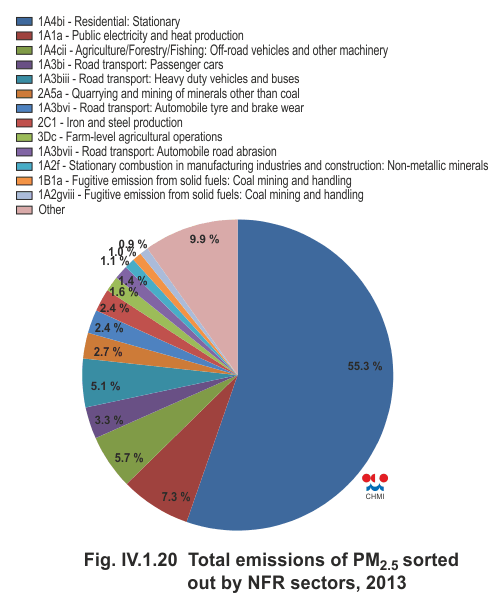
The concentrations of PM10 show a clear annual course with the highest concentrations in the cold months of the year (Figs. IV.1.11 and IV.1.14). Higher concentrations of PM10 in the ambient air during the cold part of the year are connected both with higher emissions of particles from seasonal heat sources (e.g. in the Czech Republic, local heating contributes to emissions of PM10 and PM2.5 by 38 % and 55 %, respectively – Figs. IV.1.18 and. IV.1.20), and with deteriorated dispersion conditions, which are more frequent in winter months.
In 2014, compared to the previous year, more favourable meteorological and dispersion conditions influenced the overall moderate decrease in concentrations of PM10 and PM2.5. However, the decrease of ambient levels was smaller than could be expected based on these favourable conditions. The year 2014 thus became the warmest since 1961, when averages for the territory of the Czech Republic were first provided. Temperatures in most months of the year 2014 were above normal or even strongly above normal; only the months of May and June were normal temperature-wise, and August was subnormal. Precipitation-wise, the year 2014 was normal (see Chapter III for more details).
Between 22 and 25 May 2014, measurements of both PM10 and PM2.5 at most localities were in some cases provably influenced by long-distance transport of dust from the Sahara desert. Only at the Pardubice -Dukla station on 23 May did the maximum 24-hour concentration of PM10 exceed the limit value (Annex II).
Suspended particles of PM2.5 fraction
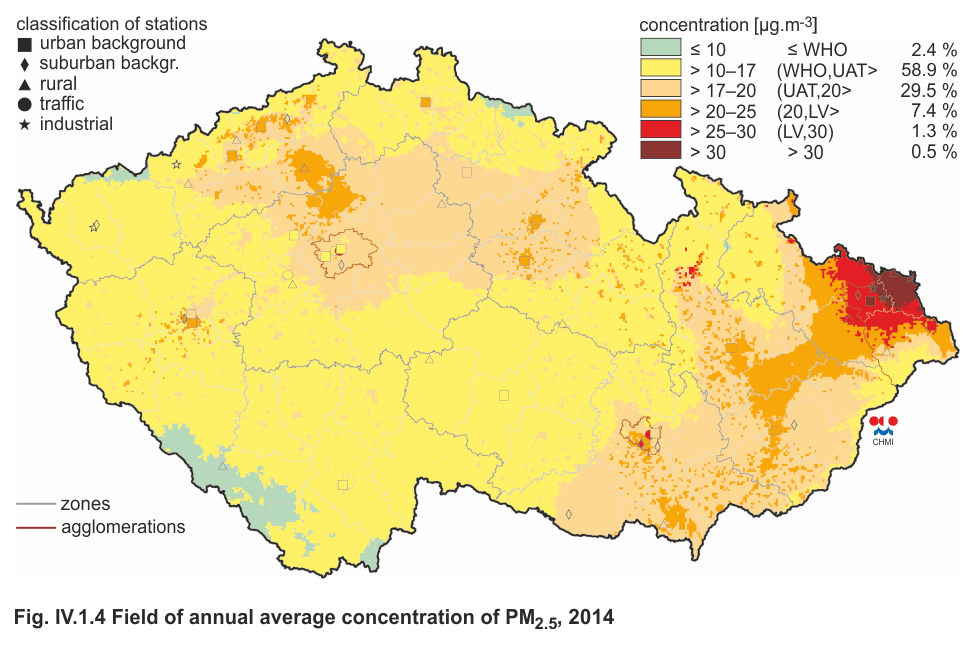
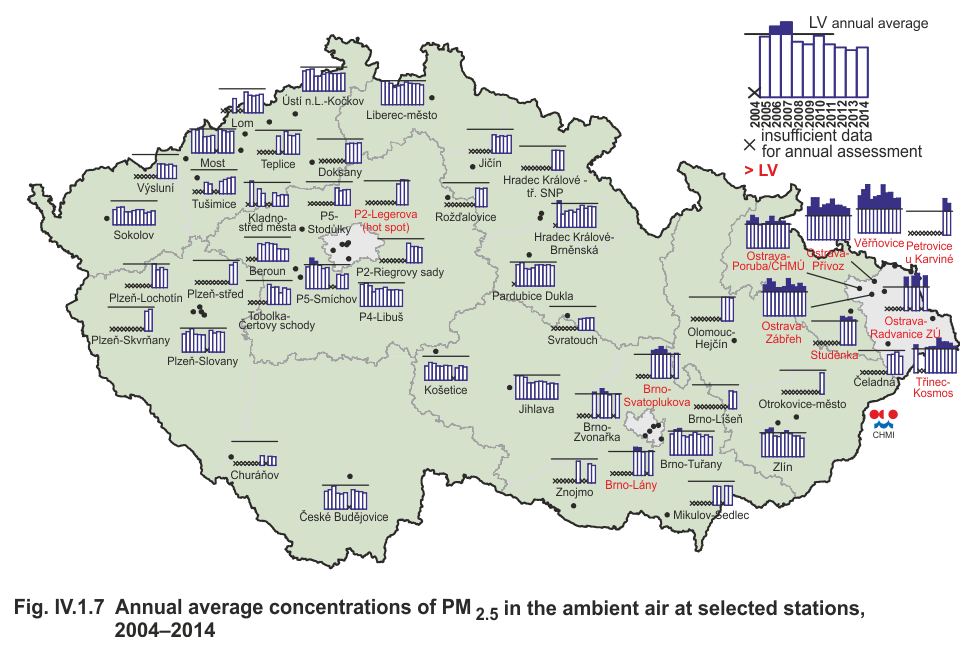
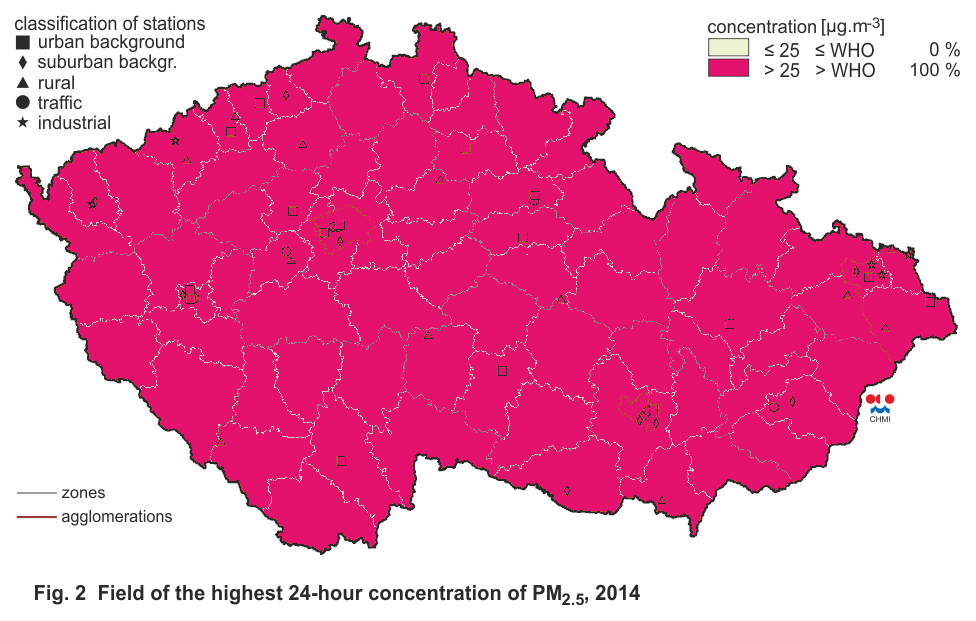
The level of air pollution caused by PM2.5 in 2014 did not change significantly compared to the previous year. The annual limit value for PM2.5 was exceeded in 1.8 % of the Czech territory inhabited by approximately 8.6 % of the population (Fig. IV.1.4). In 2013 a slightly larger part of the Czech territory (2.4 %) where the limit value was exceeded was inhabited by approximately 9.6 % of the population. Exceedances of the limit in 2014 were recorded at seven stations in the agglomeration of O/K/F-M, at two stations in the agglomeration of Brno, at one station in the agglomeration of Prague and at one station in the Moravia-Silesia zone (Table XIII.3, Fig. IV.1.7). Exceedances were therefore recorded at 11 of the total number of 52 stations (i.e. exceedances at 21 % of stations); in 2013 exceedances were recorded at nine stations out of 47 (exceeded at 19 % of stations; Fig. IV.1.10). The recommended 24-hour value of PM2.5 set for the protection of human health by the WHO was exceeded in the whole area of the Czech Republic (Fig. 2, Annex IV).
Extensive air pollution caused by PM2.5 occurs mainly during the cold part of the year (Fig. IV.1.12); higher concentrations in the cold part of the year are, similarly to those of PM10, caused by emissions from heating and deteriorated dispersion conditions.
Suspended PM1 particles
In 2014 the fine fraction of PM1 particles was monitored at 10 localities, of which 5 were in the city of Plzeň (Table XIII.4). Annual average concentrations of PM1 reached their highest values of around 24 µg.m-3 at stations in Brno.
Ratio between the PM2.5 and PM10 fractions
of suspended particles
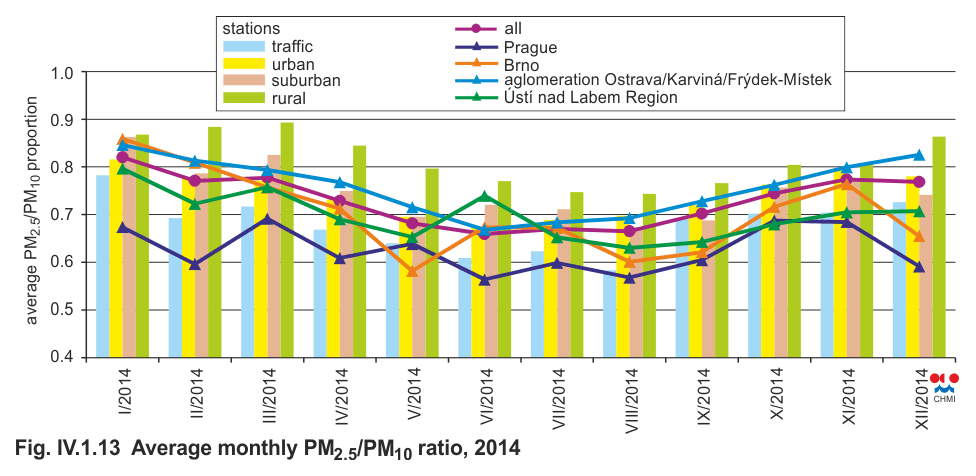
The ratio between the PM2.5 and PM10 fractions is not constant but shows a certain seasonal course. At the same time it is dependent on the locality (Fig. IV.1.13). In 2014 the average ratio for 34 localities measuring both PM2.5 and PM10 in the Czech Republic with sufficient data ranged from 0.66 (June and August) to 0.82 (January) with lower values in the summer period. In Prague, where the annual course is influenced by a large share of traffic localities, this ratio ranged from 0.56 (June) to 0.69 (March and October), in Brno from 0.58 (May) to 0.86 (January), in the agglomeration of O/K/F-M from 0.67 (May) to 0.85 (January) and in the Ústí nad Labem region from 0.63 (August) to 0.8 (January). When comparing the ratio with regard to the classification of localities, the ratio at rural localities ranges from 0.74 (August) to 0.89 (March), at urban localities from 0.67 (June) to 0.82 (January), at suburban localities from 0.67 (August) to 0.86 (January), and at traffic localities from 0.58 (August) to 0.78 (January).
The seasonal course of the ration between the PM2.5 and PM10 fractions is connected with the seasonal character of several emission sources. Emissions from combustion sources show higher shares of the PM2.5 fraction than for instance emissions from agriculture and re-emissions during dry and windy weather. Consequently, heating in the winter period can cause the higher share of the PM2.5 fraction in comparison with the PM10 fraction. Some authors (Gehrig, Buchmann 2003) explain the decrease during spring and early summer also by the increased amount of larger biogenic particles (e.g. pollen) in the air. Higher values of the PM2.5/PM10 ratio is also observed at industrial stations due to combustion.
The lowest PM2.5/PM10 ratio is at traffic localities (Fig. IV.1.13). During fuel combustion, the emitted particles mainly belong to the PM2.5 fraction, and thus the ratio should be high in traffic localities. The fact that this is not the case accents the significance of emissions of larger particles caused by tyre, break lining and road surface abrasion. The share of the coarse fraction at traffic stations increases also due to the re-suspension of particles following road gritting in winter. The growth of PM10 concentrations can also be caused by increased abrasion of the road surface due to gritting and the subsequent re-suspension of the abraded material (EC 2011).
IV.1.2 Development of PM10 and PM2.5 concentrations
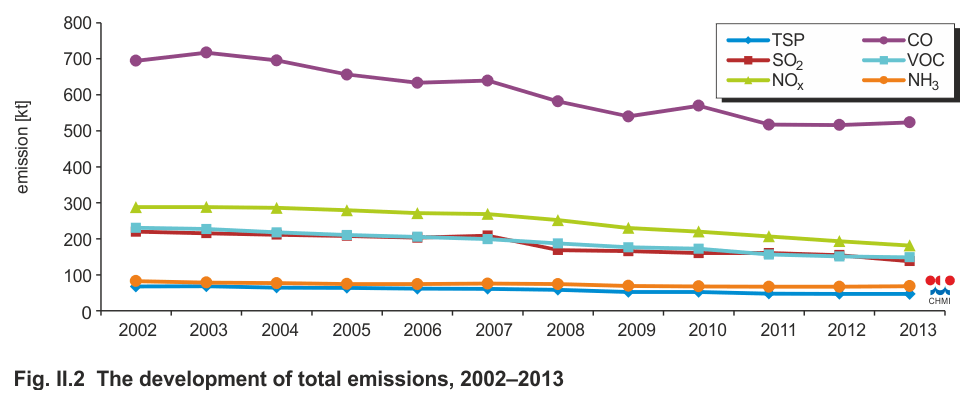
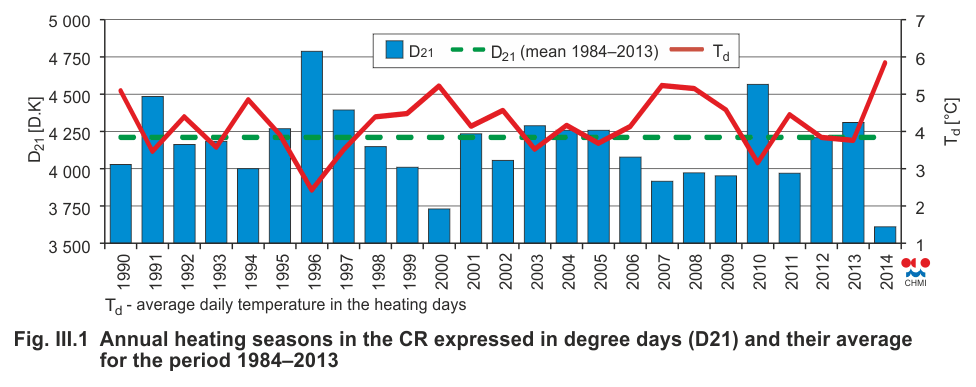
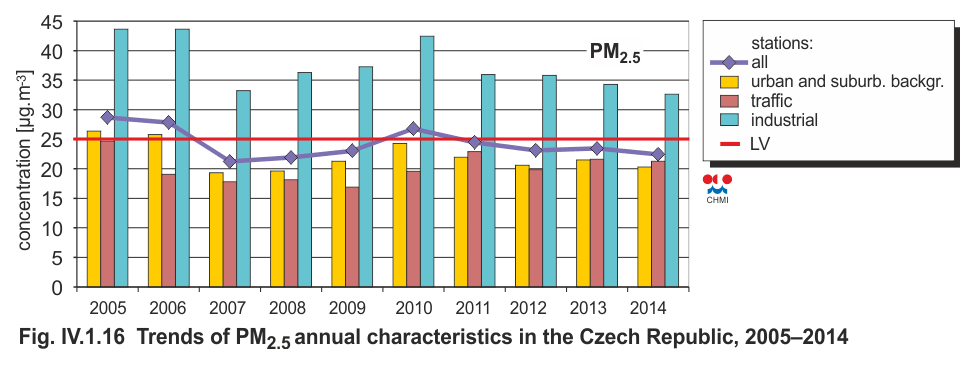
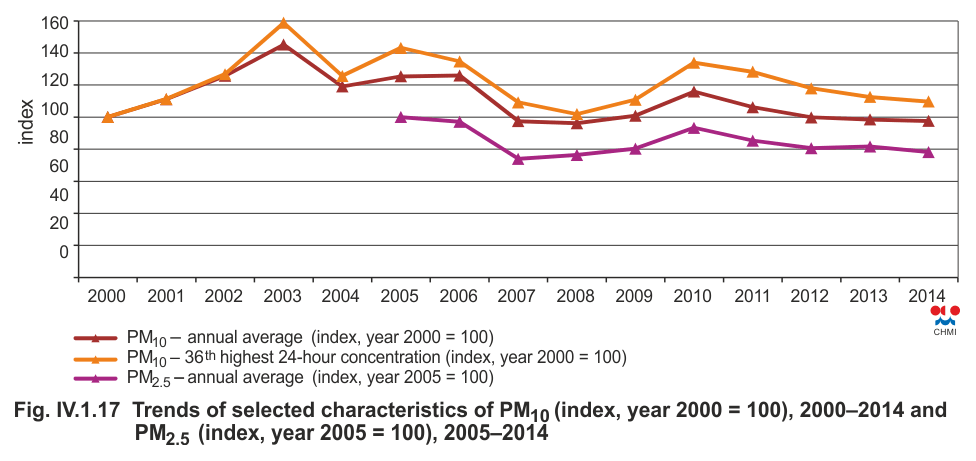
The concentrations of PM10 suspended particles, similarly as in other pollutants, decreased significantly in the 90s of the last century. This was caused by a marked decrease of emissions of TSP and precursors of suspended particles (SO2, NOx, NH3 and VOC) in the period 1990–2001 due to legislative changes, restructuring of the economy and modernization or closure of sources (for more details, see Chapter II., Fig. II.1). After the year 2001, the decrease of emissions continued at a slower rate (Fig. II.2), which resulted in the fact that concentrations of pollutants were influenced mainly by the meteorological and dispersion conditions prevailing in each given year. At almost all localities in the Czech Republic, an increasing trend of air pollution caused by PM10 was apparent from 2001 until 2003. So far, the highest values of PM10 concentrations since 2003 were measured in 2003. High PM10 concentrations in 2003 were caused by both unfavourable dispersion conditions in February and below-normal precipitation amounts. After a brief series of sways in 2004, when routine monitoring of the PM2.5 fraction started, high concentrations of suspended particles were recorded again in the years 2005 and 2006, mainly due to long episodes with unfavourable dispersion conditions in the winter period. In 2007–2009, on the contrary, there were more favourable dispersion conditions, and the concentrations of particles significantly decreased in comparison with the years 2003, 2005 and 2006. In the year 2008 lower concentrations were caused probably also by a more marked decrease of emissions of some precursors of solid particles during a temporary decline in certain sectors due to the economic crisis (see Chapter II for more details). The subsequent increase of concentrations of suspended particles in 2010 was given mainly by the repeated occurrence of unfavourable meteorological and dispersion conditions in the winter period at the beginning and at the end of the year and by the coldest heating season since 1996 (Fig. III.1). In the last four years since 2010, the average concentration of suspended particles was decreasing. This decrease of PM10 and PM2.5 concentrations was also apparent in 2014 (Figs. IV.1.15, IV.1.16 and IV.1.17).
As far as classification classes are concerned, the
decrease of the PM10 fraction was apparent at localities
belonging to the urban and suburban categories and also at rural
stations; at traffic and industrial stations, by contrast, a
slight increase was recorded in 2014 (Fig. IV.I.15). The annual
average concentration of PM10 has in the long term remained
below the limit value, but the annual average concentration of
PM2.5 and the 36th highest daily concentration of PM10 has been
fluctuating around the limit value (averages for all types of
localities and the whole of the Czech Republic are given in all
cases; Figs.
IV.1.15,
IV.1.16 and
IV.1.17).
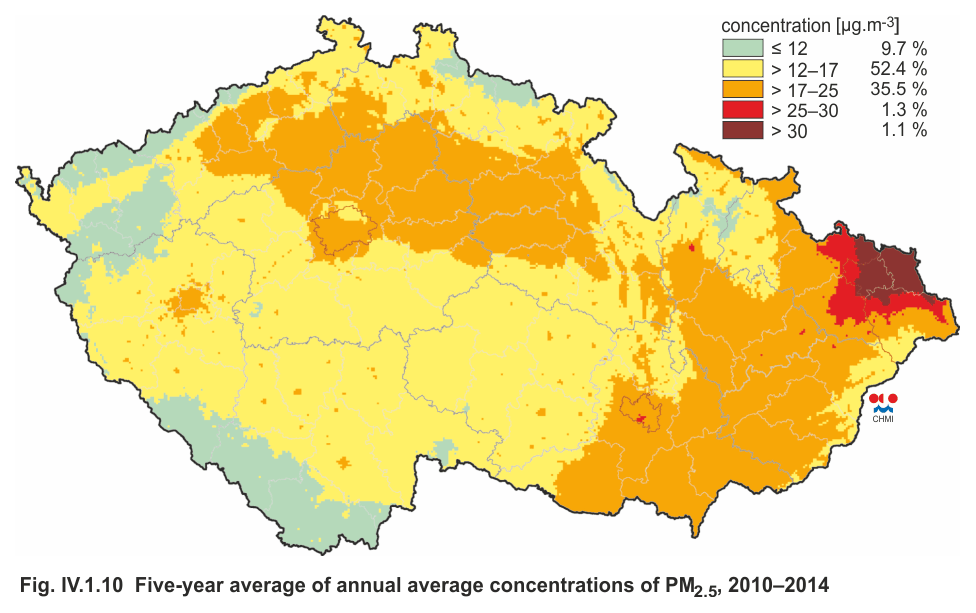
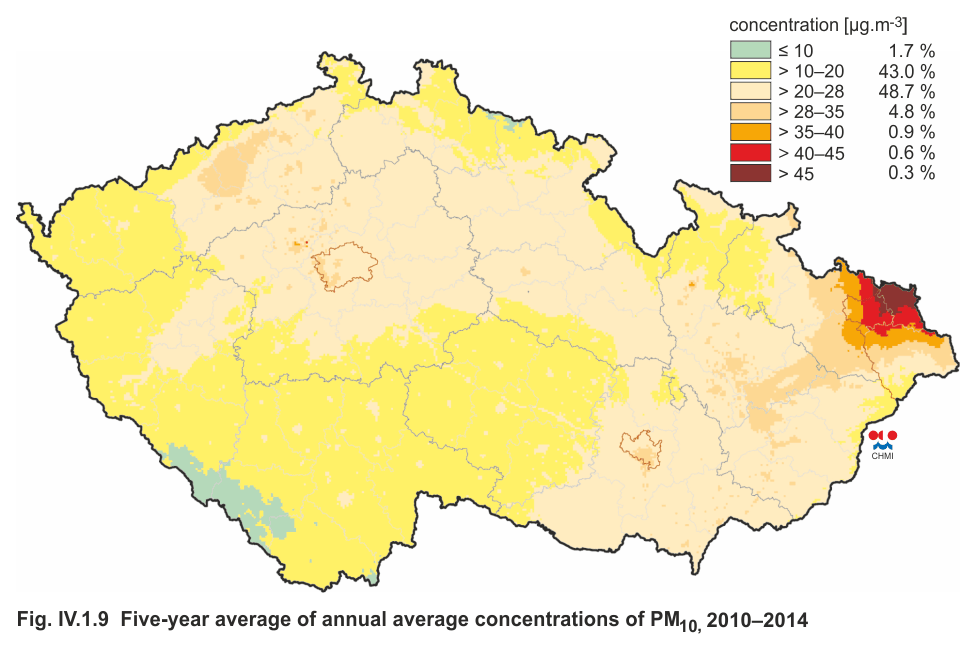
This yearbook newly contains a map of the five-year average
annual concentrations of PM10 and PM2.5 particles in the years
2010–2014 (Figs.
IV.1.9 and
IV.1.10). Concentrations of PM10
exceeding 40 µg.m-3 and concentrations of PM2.5 exceeding 25
µg.m-3 take up 0.9 % and 1.4 % of the area of the Czech Republic,
respectively. This basically concerns the agglomeration of
O/K/F-M and part of the Moravia-Silesia zone. The downward trend
over the last four years is also confirmed by the map of five-year
averages compared to the map of annual averages for the year
2014 (Figs.
IV.1.2 and
IV.1.4). In 2014 there was an apparent
shrinkage of the area with concentrations of PM10 exceeding 40
µg.m-3 and concentrations of PM2.5 exceeding 25 µg.m-3. Such
concentrations now occur almost exclusively in the agglomeration
of O/K/F-M. In the case of the PM2.5 fraction, the area
belonging to the > 20–25 µg.m-3 class decreased in favour of the
lower category, which was apparent especially in Moravia, but
also in central Bohemia.
IV.1.3 Emissions of PM10 and PM2.5
The combustion of fuels and other industrial activities result in the production of aerosol emissions, which can be solid, liquid or mixed. The Czech legislation defines these emissions as solid pollutants (TZL), while foreign literature refers to Total Suspended Particulate Matter (TSP). With regard to the effects on human health, several size groups abbreviated as PMx (Particulate Matter) have been defined, which comprise particles with an aerodynamic diameter smaller than x µm. Emission inventories most often deal with the PM10 and PM2.5 size fractions. Emissions of TSP differ in size and chemical composition according to the character of the source and the mode of formation. They may contain heavy metals and are carriers of VOC and PAH. For the purposes of emission inventories, the PM10 and PM2.5 size fractions are usually distinguished in connection with air pollution limits.
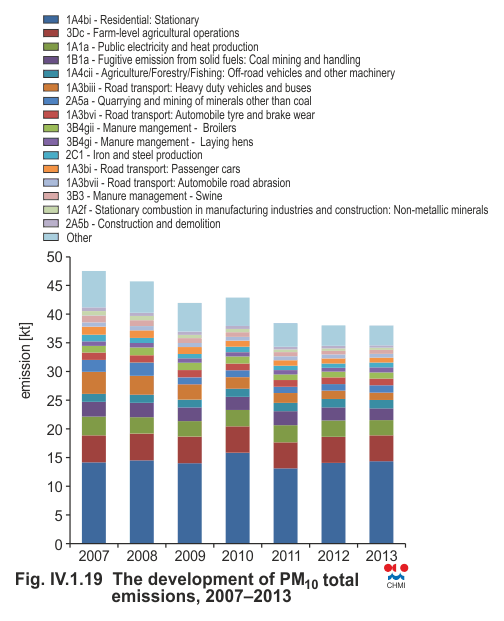
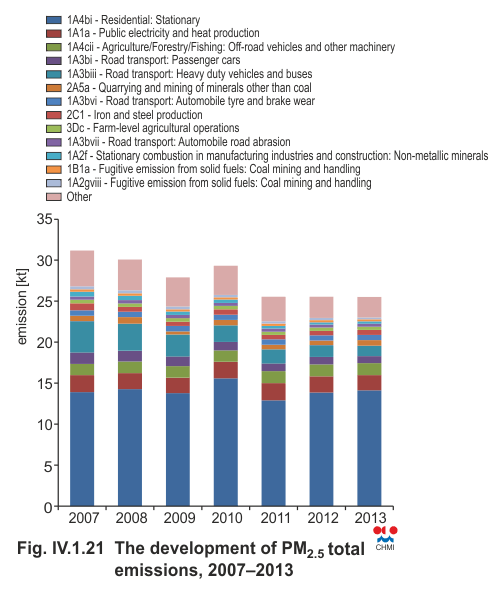
Emission inventories of PM10 and PM2.5 particles carried out according to valid methods only include emissions produced by primary sources. In comparison with emissions of other pollutants, PMx emissions are emitted into the air from a large array of groups of sources. Apart from the sources from which these substances are discharged in a controlled manner through chimneys or vents (industrial sources, local heating sources, transport), significant amounts of PMx emissions have their origin in fugitive sources (quarries, landfills of dusty materials, operations with dusty materials, etc.). The ambient air quality is also influenced also by re-suspension of particles (resuspension), which is not included in emission inventories. The shares of individual groups of sources of PM10 and PM2.5 emissions in 2013 are presented in Figs. IV.1.18 and IV.1.20. The main source of PMx emissions is represented by sector 1A4bi-Residential stationary combustion; its share in air pollution on the country-wide scale caused by PM10 and PM2.5 amounted to 37.8 % and 55.3 %, respectively (Figs. IV.1.18 and IV.1.20). Other significant sources of PM10 emissions include 3Dc-Farm-level agricultural operations including storage, handling and transport of agricultural products, where these emissions are produced during tillage, harvest and cleaning of agricultural crops in fields. This sector contributed 11.8 % of the PM10 emissions. With regard to the effects on human health, a large risk are emissions of PM caused by traffic, mainly from fuel combustion in compression ignition engines producing particles that are units to hundreds of nm in size (Vojtíšek 2010). Sectors 1A3biii-Road transport: Heavy duty vehicles and buses and 1A3bi-Road transport: Passenger cars, contributed to PM10 emissions by 5.6 % and to PM2.5 emissions by 8.4 %.
The share of households using solid fuels for heating did not significantly change in the period 2007–2012, so the trend of PM10 and PM2.5 emissions is influenced especially by the character of the heating seasons (Figs. IV.1.19 and IV.1.21). The decrease of emissions is influenced especially by natural renewal of the car fleet, a decrease in agricultural production and the implementation of emission ceilings for TSP from LCP sources since 2008.
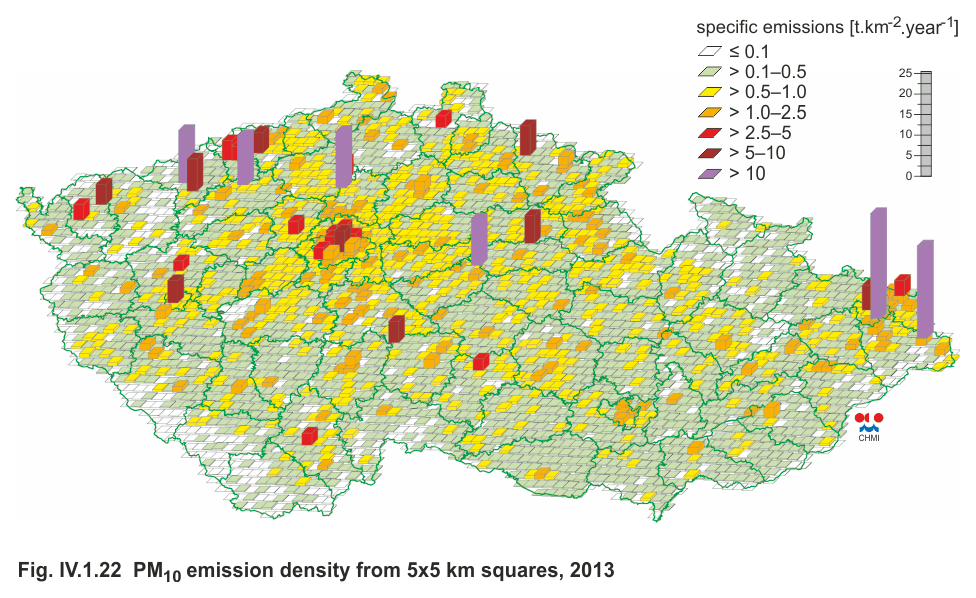
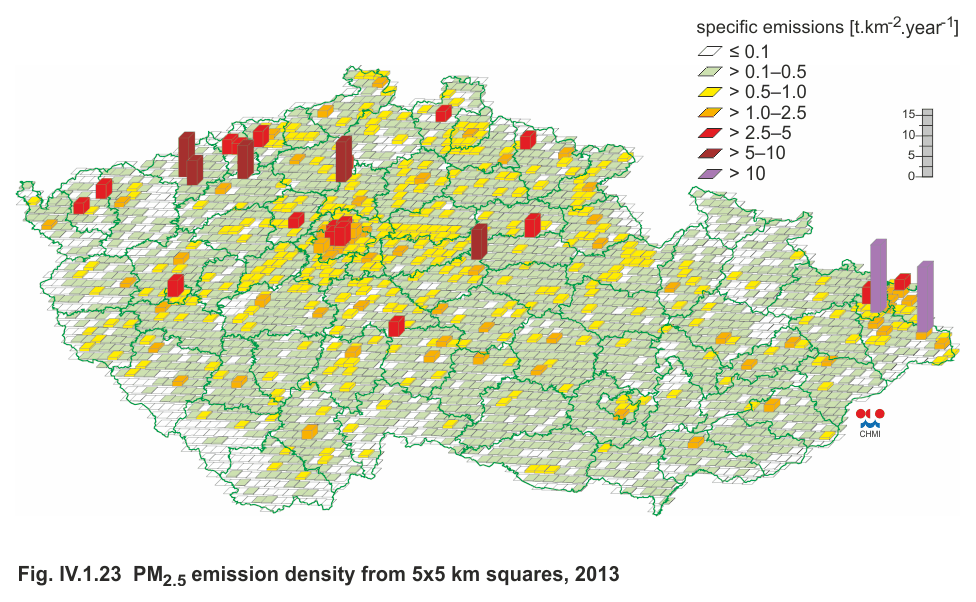
In individual regions of the Czech Republic, the contributions of various types of sources to total emissions depend on the particular mix of sources in the given region. With regard to the fact that the main source of PM10 and PM2.5 emissions is represented by the sector of residential stationary combustion, the production of emissions of these pollutants is distributed throughout the whole inhabited territory of the country (Figs. IV.1.22 and IV.1.23). In the territory of the Czech Republic divided into 5×5 km squares, the most outstanding are localities with major energy producers burning solid fossil fuels followed by large industrial complexes (primarily the Moravia-Silesia region and the Ústí nad Labem region). The influence of traffic is apparent mainly in big cities.
IV.1.4 Measurements of numerical size distribution of
aerosol particles
Atmospheric aerosols (AA), defined as solid and liquid particles suspended in the atmosphere are its natural component. Thanks to AA, we can observe atmospheric spectacles such as colourful sunsets, rainbows and halo phenomena). AA reflect and absorb solar radiation, and also play an important role in the formation of clouds and precipitation (as cloud condensation nuclei; Hinds 1999, Pöschl 2005, Seinfeld, Pandis 1998). The range of AA particle sizes spans five orders of magnitude (from units of nm to thousands of µm). They therefore comprise a wide spectrum of particles of different shapes, properties, chemical composition, etc.
The negative impact of suspended particles (PM10 and PM2.5) on human health has been proven by many studies (WHO 2013, Tuch et al. 1997). The most serious problem, however, are ultrafine particles smaller than 100 nm, which easily enter through the respiratory system into the blood stream and can get transported to sensitive organs or the central nervous system. Their presence in the blood can affect its function and properties (Borsós et al. 2012, Pöschl 2005). The weight of ultrafine particles is negligible in the measured size spectrum. For the purpose of assessing health effects, it is therefore more appropriate to measure numbers of particles and their size distribution (Tuch et al. 1997), which is also an important parameter for assessing the range of direct and indirect effects on the climate (Stanier et al. 2004).
As part of the co-operation between the CHMI and the Institute of Chemical Processes, ASCR, experts from the latter institute have since May 2008 been measuring the size distribution of aerosol particles at the Košetice observatory. The measurements are being made thanks to the observatory’s participation in the project EUSAAR (European Supersites for Atmospheric Aerosol Research). The EUSAAR project, and also the ACTRIS (Aerosols, Clouds, and Trace gases Research InfraStructure Network) project, interconnects European stations measuring properties of aerosols. Among other results, this integration provides high-quality materials useful for addressing political questions pertaining to air quality, long-distance transport of pollutants and climate changes (ACTRIS 2011, EUSAAR 2006).
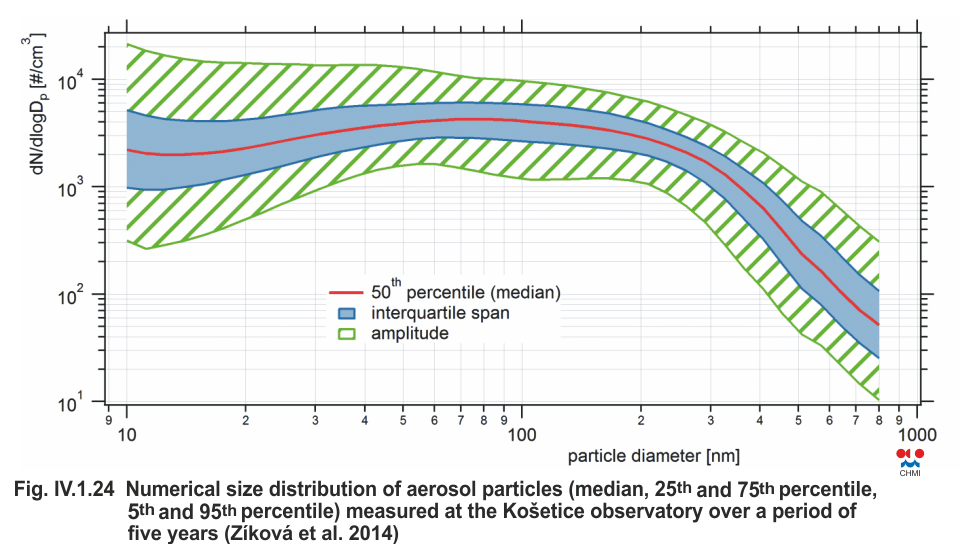
The numerical size distribution of atmospheric aerosol particles at the Košetice observatory is measured in 5-minute intervals. The measuring range of the Scanning Mobility Particle Sizer (SMPS) spectrometer ranges from 10 to 800 nm. This range is divided into 70 size categories. The number of particles per cm3 is measured separately for each of these categories. The average overall number of particles in the size range of 10 to 800 nm at the Košetice observatory over a five-year period is 6,600 particles per v cm3 (Zíková et al. 2014), which is in agreement with typical values for the given type of station (Heintzenber 1994, Laakso et al. 2003). The median of numerical size distribution of particles (Fig. IV.1.24) indicates a well-developed accumulation and nucleation mode (Zíková et al. 2014). Particles in nucleation mode are usually emitted by direct anthropogenic sources, or they are formed in the atmosphere. Because the Košetice observatory is a background station, and thus is not directly influenced by pollution, the elevated number of particles in nucleation mode can be ascribed the formation of new particles.
In the years 2011–2014, the CHMI participated in the projects UFIREG (Ultrafine Particles – an evidence based contribution to the development of regional and European environmental and health policy) and Ultraschwarz (Ultrafine particles and Health). Both projects were focused on measuring concentrations of ultrafine particles and monitoring their effects on human health. Measurements within the framework of the UFIREG project took place in five European cities, including Prague. Variability in concentrations of ultrafine particles in different seasons of the year was one of the evaluated measures. The highest concentrations of up to 8,200 particles per cm3 were measured in Prague during the summer period. Elevated numbers of particles are related the formation of new particles caused by high summer values of global radiation and with the presence of gaseous precursors. In 2013 the average annual concentration of ultrafine particles was 5,500 particles per cm3, which corresponds with results from other cities participating in the project (Dresden, Augsburg, Ljubljana), except the Ukrainian town of Chernivtsi, where concentrations reached 7,000 particles per cm3 (Ufireg 2014).
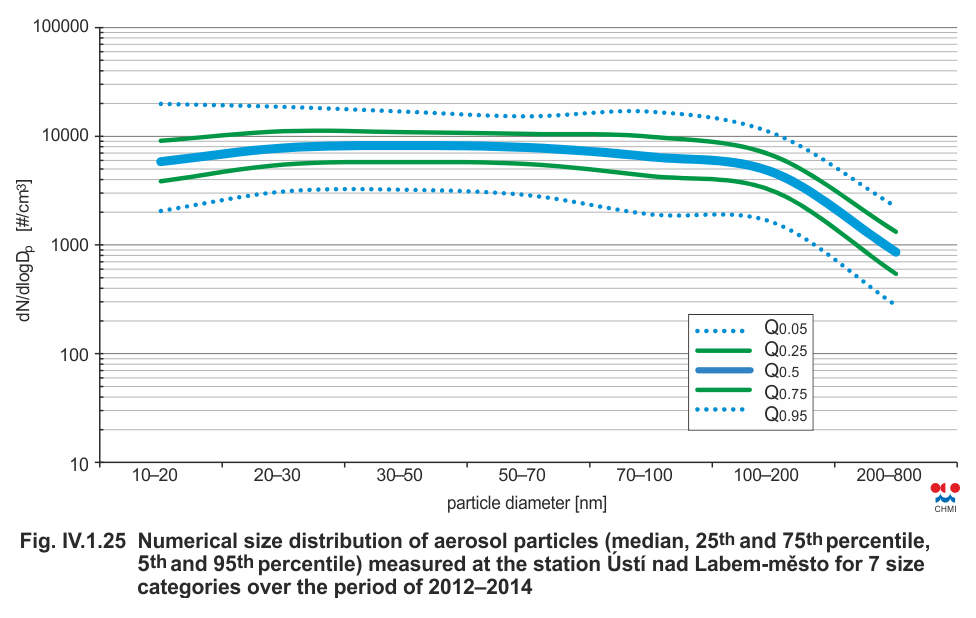
The Ultraschwarz project was carried out as part of cross-border co-operation between the Czech Republic and the Free State of Saxony. In the Czech Republic, measurements were carried out in the centre of Ústí nad Labem (by an urban background station). Using the SMPS spectrometer, seven size categories falling into the size range of 10–850 nm were measured. The measured concentrations of ultrafine particles varied between 7,000 and 12,000 particles per cm3. The highest concentrations were measured in the summer period, when concentrations of gaseous precursors (mainly SO2) are also elevated. High and relatively stabilized concentrations of ultrafine particles in the median spectrum (Fig. IV.1.25) over the entire course of measurements are caused, among other factors, by elevated concentrations of gaseous precursors throughout the year. The concentration of particles is higher not only due to their direct emissions into the atmosphere (the locality is influenced by industrial and transportation activity in the region), but also because new particles are formed as a result of elevated concentrations of gaseous precursors (NOx and SO2) and organic compounds (Ultraschwarz 2014). Compared to the Košetice stations, annual average concentrations of SO2 and NOx are more than three times higher.
IV.1.5 Monitoring concentrations of elemental and organic
carbon
Carbon aerosol particles in the atmosphere are mainly composed of elemental carbon and organic compounds (Seinfeld, Pandis 1998). Both elemental (EC) and organic carbon (OC) are products of imperfect combustion of organic materials (coal, oil, petrol, wood and biomass). Sources of OC also include re-suspension of dust connected with transport and biogenic particles (viruses, bacteria, pollen, fungal spores and fragments of vegetation of all types; Schwarz et al. 2008). While EC is emitted into the atmosphere only directly (primary particles), OC can form by reactions of gaseous organic precursors (Seinfeld, Pandis 1998).
A large number of toxicological studies referred to in the WHO document from 2012 deal with negative effects of these particles on human health. The studies cited all agree on the fact that black carbon (the same element as EC, only measured by the optical method) can serve as a carrier for a wide range of chemicals that are toxic for the human organism (WHO 2012). EC compared to OC more easily passes into the human body and worsens heart and lung diseases (Na, Cocker 2005). Organic particles, which among other things may contain polycyclic aromatic hydrocarbon (PAH) fractions, are being studied for their carcinogenicity and mutagenic effects (Seinfeld, Pandis 1998, Satsangi et al. 2012).
The presence of EC and OC in the atmosphere affects the Earth’s radiation balance. While OC has a cooling effect (Bond et al. 2007), EC, being the most light-absorbing particle, causes warming of the atmosphere (IPCC 2013, Seinfeld, Pandis 1998).
These facts have led to the requirement for measuring EC and OC in PM at regional stations (EC 2008). In the Czech Republic, monitoring of EC/OC in the PM2.5 fraction commenced in February 2009 at the Košetice background station. Sampling takes place every sixth day, when air is continuously drawn through a system of two filters for 24 hours. The exposed filters are analysed at regular intervals according to the procedure prescribed by the Central Laboratory of Air Quality (CLI). The method of sampling and analysis follows the standardized protocol developed as part of the international project EUSAAR, which was superseded by the project ACTRIS.
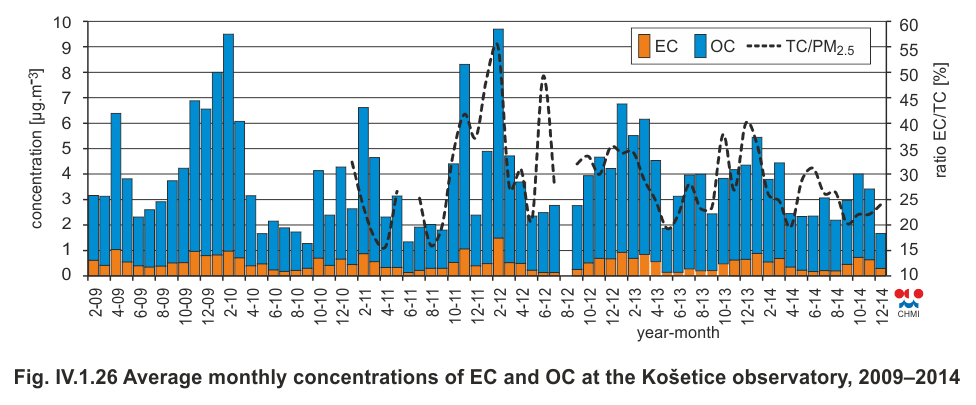
The average concentration of total carbon (TC) in 2009–2014 in the sampled PM2.5 fraction is 3.9 µg.m−3, of which EC amounts to 0.5 µg.m−3 and OC to 3.4 µg.m−3. TC on average contributed to the total concentrations of PM2.5 by 28.9 % (the contribution of EC was 3.4 %, and the contribution of OC was 25.5 %). The highest share of TC in the total concentration of PM2.5 is usually reached in cold periods, when these values can exceed 40 % (Fig. IV.1.26). Over the course of the monitoring period, no inter-annual variability in average annual concentrations has been found (Tab. IV.1.1).
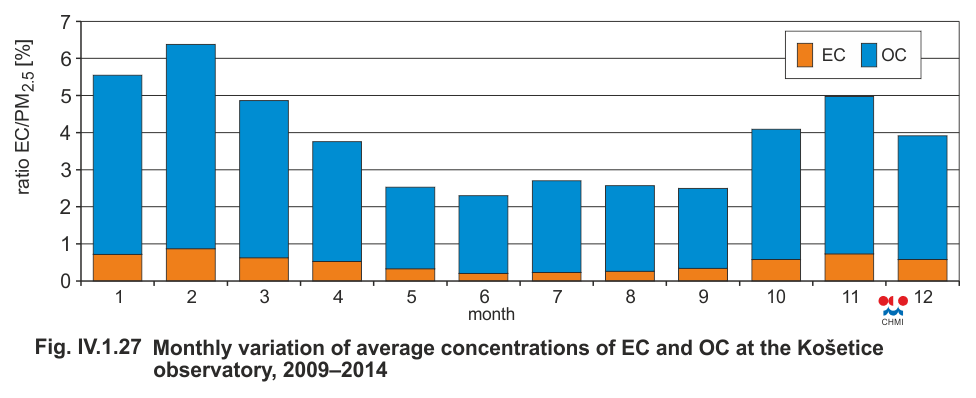
Annual variability in concentrations indicates that increases in EC and OC are related to the heating season. The highest average values are reached in February (TC 6.37 µg.m−3) and January; the lowest average value of TC 2.29 µg.m−3 was measured in June (Fig. IV.1.27). The results correspond to those presented in published studies (e.g. Viana et al. 2007, Schwarz et al. 2008).
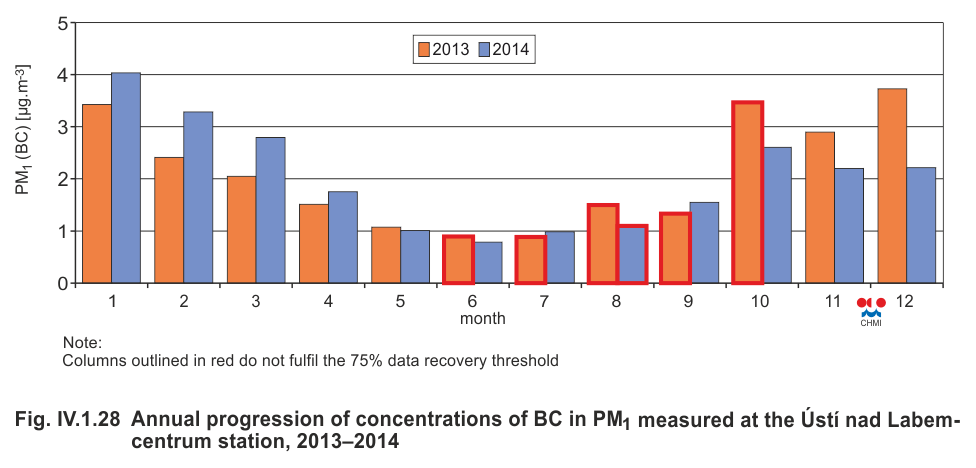
As part of the project Ultraschwarz, black carbon (BC) has been measured in the PM1 size fraction at the station in Ústí nad Labem. Measurements have revealed annual variability related to the burning of solid fuels during the heating season (Fig. IV.1.28). The concentration of BC in the summer period oscillated around the value of 1 µg.m−3 whereas in winter it reached up to 4 µg.m−3 (Ultraschwarz 2014).
Tab. XIII.1 Stations with the highest numbers of exceedances of the 24-hour limit value of PM10
Tab. XIII.2 Stations with the highest values of annual average concentrations of PM10
Tab. XIII.3 Stations with the highest values of annual average concentrations of PM2.5
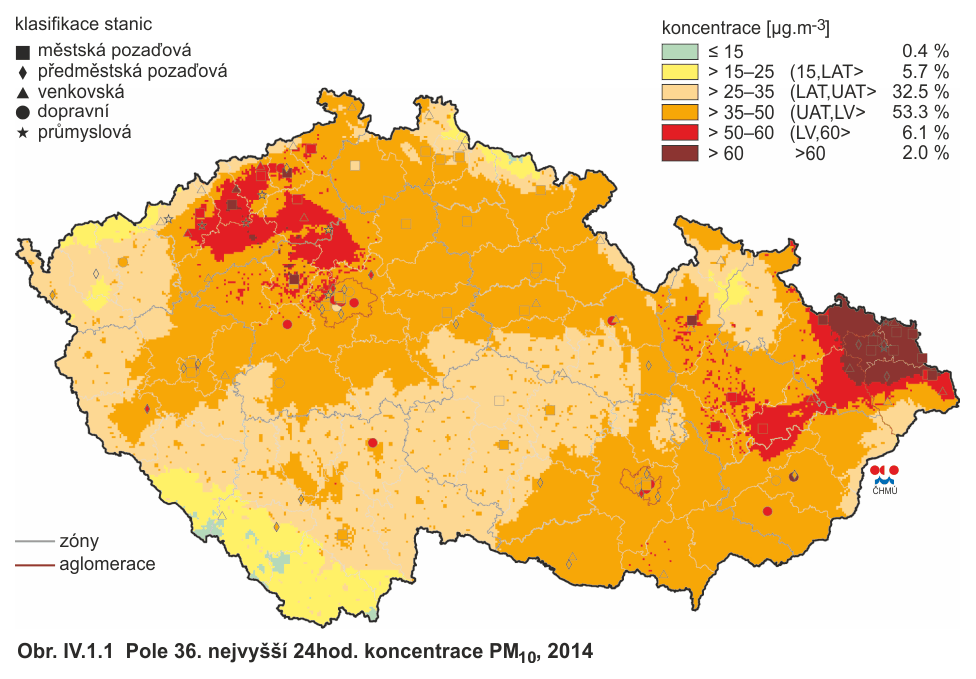
Fig. IV.1.1 Field of the 36th highest 24-hour concentration
of PM10, 2014
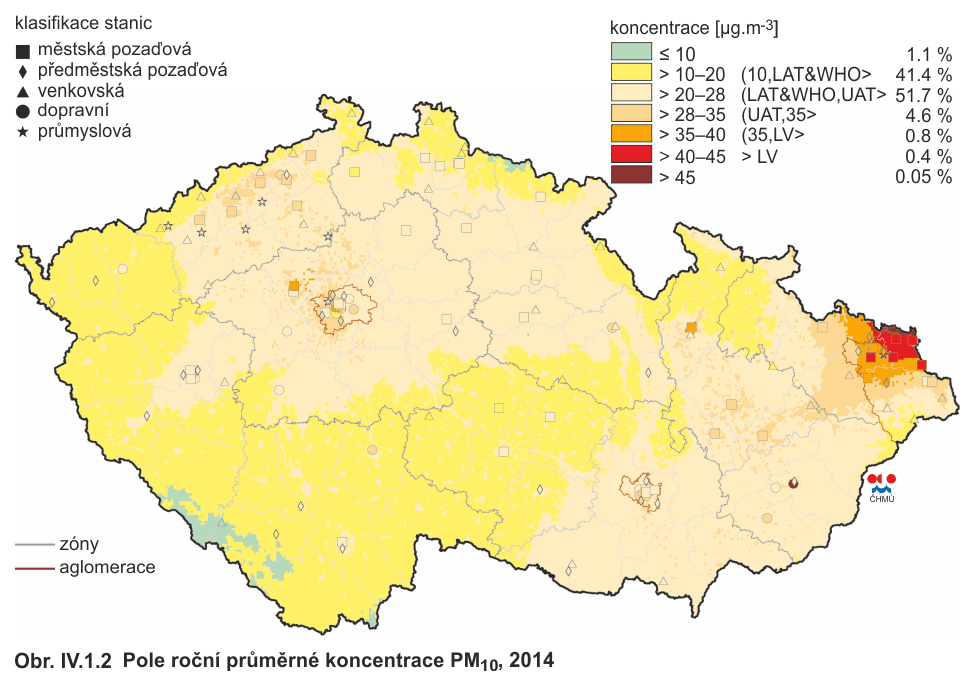
Fig. IV.1.2 Field of annual average concentration of PM10, 2014
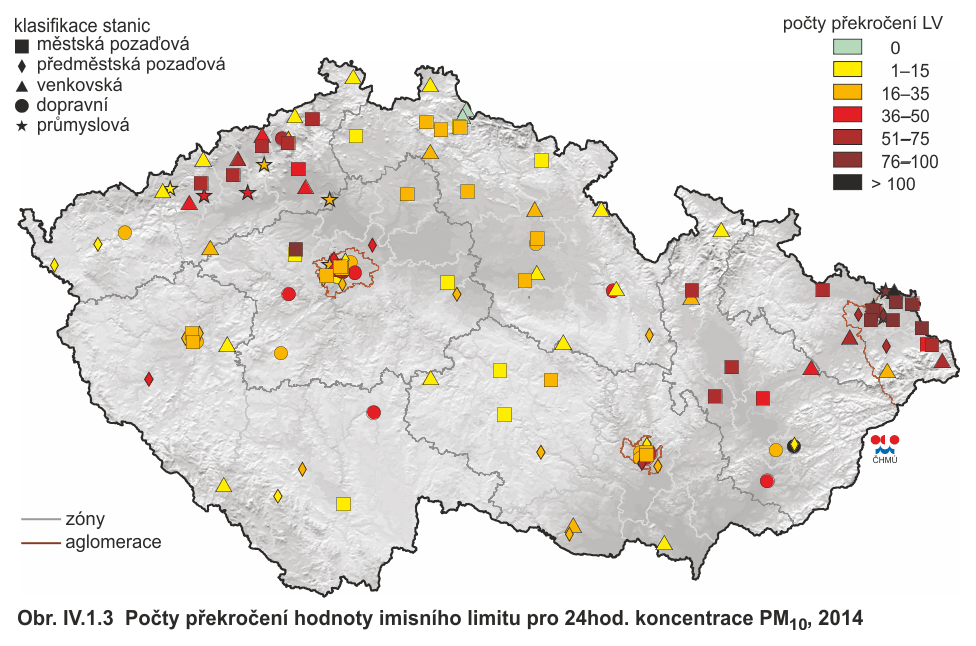
Fig. IV.1.3 Numbers of exceedances of the limit value for 24-hour
concentration of PM10, 2014
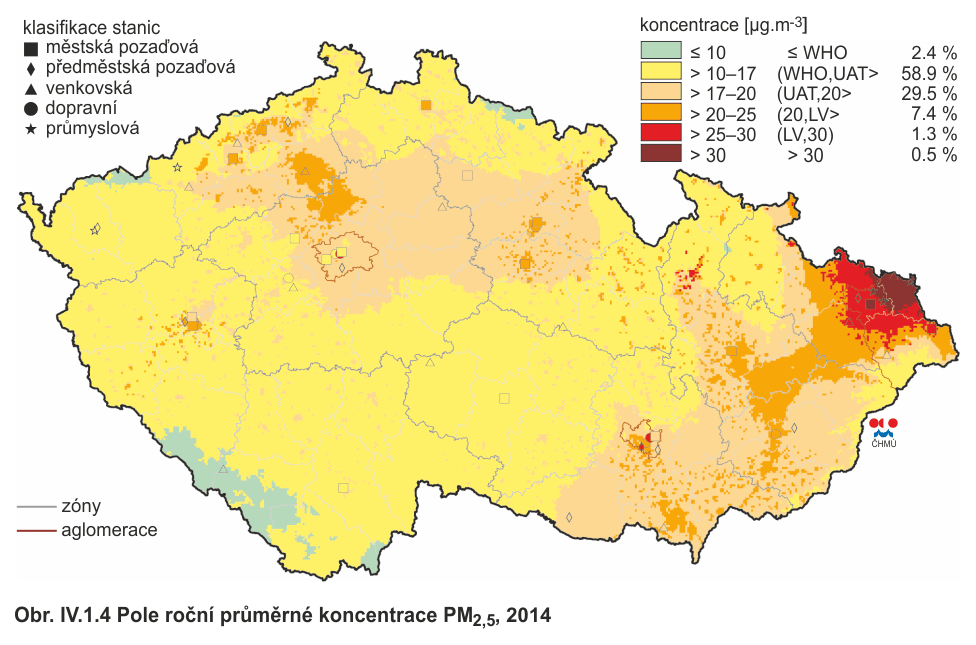
Fig. IV.1.4 Field of annual average concentration of PM2.5, 2014
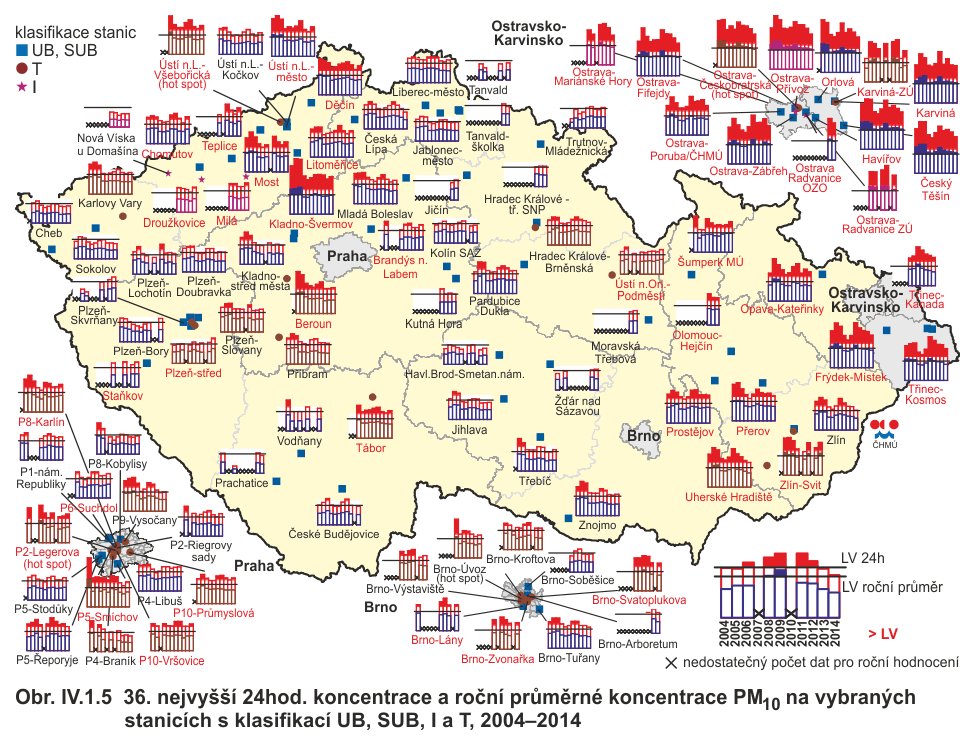
Fig. IV.1.5 36th highest 24-hour concentrations and annual
average concentrations of PM10 at selected stations with UB,
SUB, T and I classification, 2004–2014
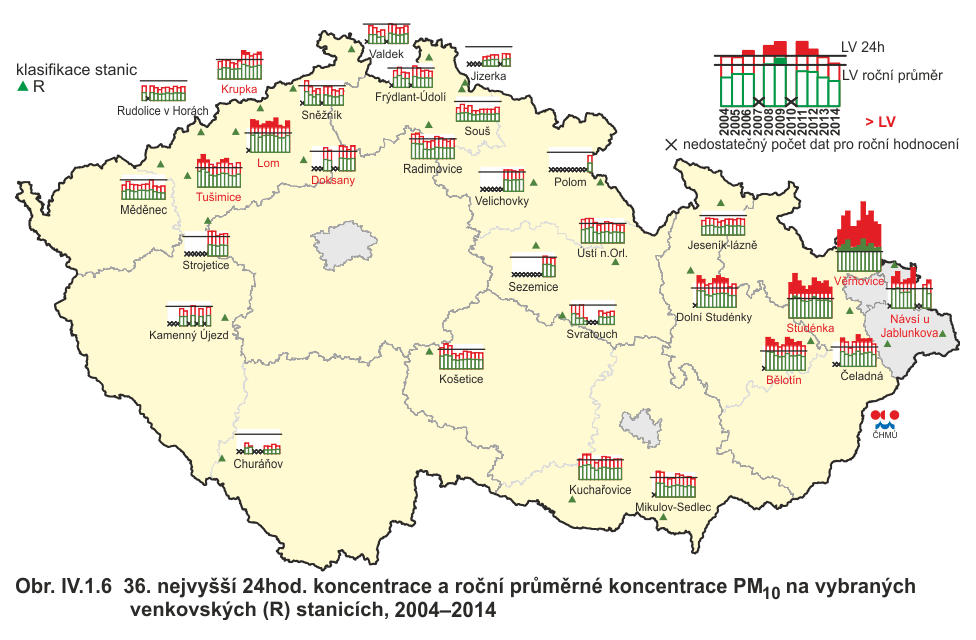
Fig. IV.1.6 36th highest 24-hour concentrations and annual
average concentrations of PM10 at selected rural (R) stations,
2004–2014
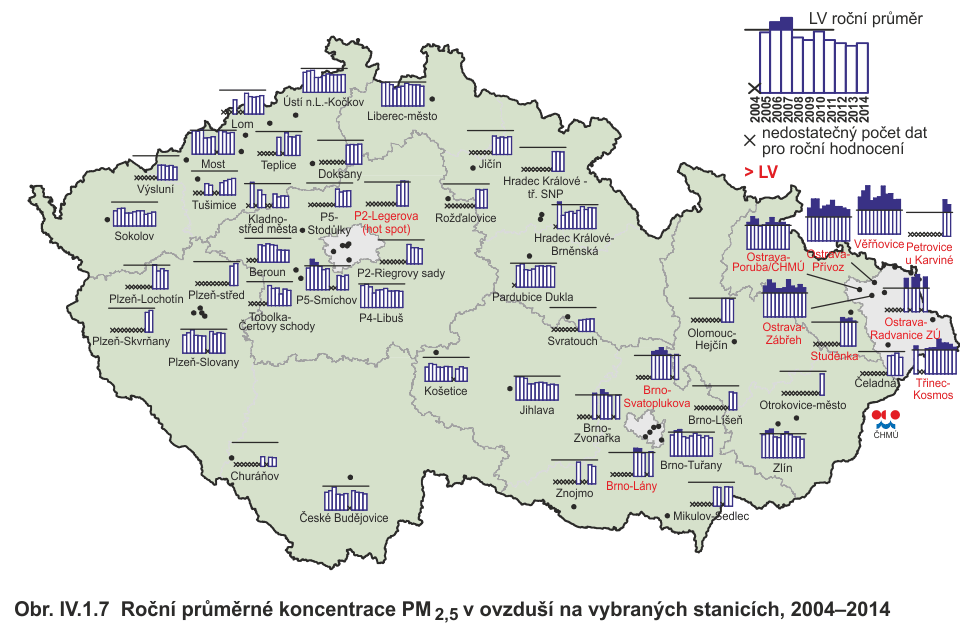
Fig. IV.1.7 Annual average concentrations of PM2.5 in the
ambient air at selected stations, 2004–2014
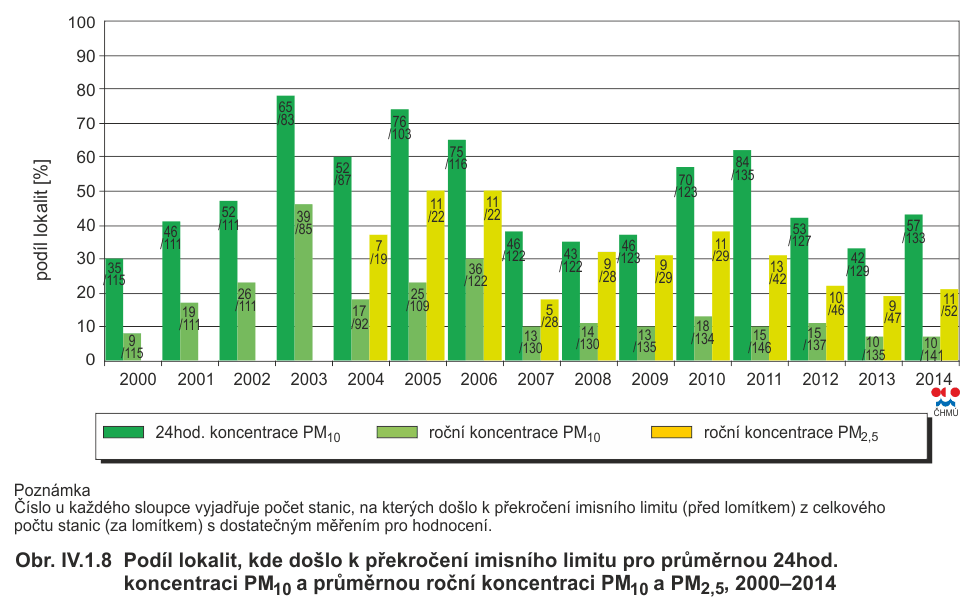
Fig. IV.1.8 Share of localities with the exceedance of the limit
value for 24-hour concentration of PM10 and annual average
concentrations of PM10 and PM2.5, 2000–2014

Fig. IV.1.9 Five-year average of annual average concentrations
of PM10, 2010–2014
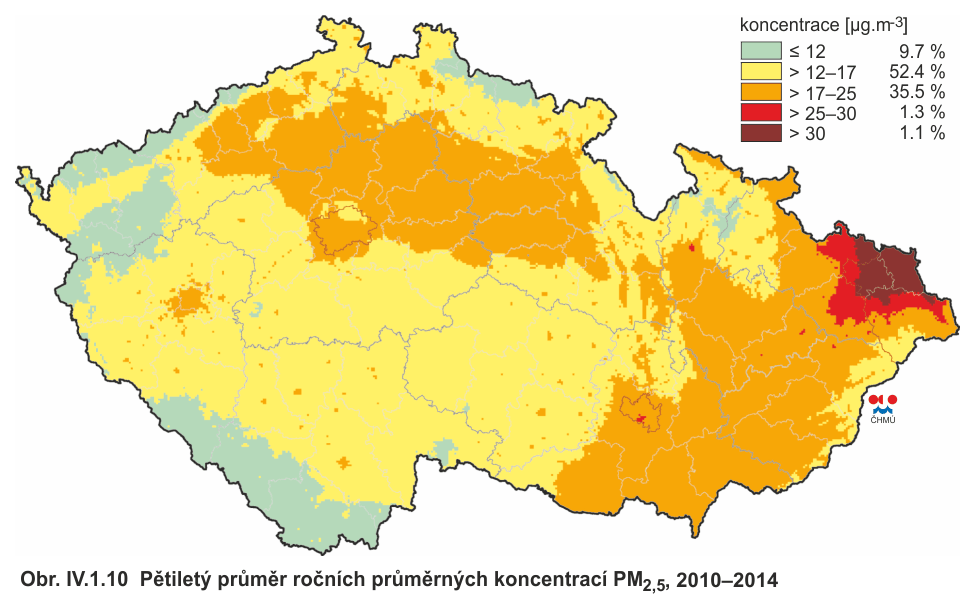
Fig. IV.1.10 Five-year average of annual average concentrations
of PM2.5, 2010–2014
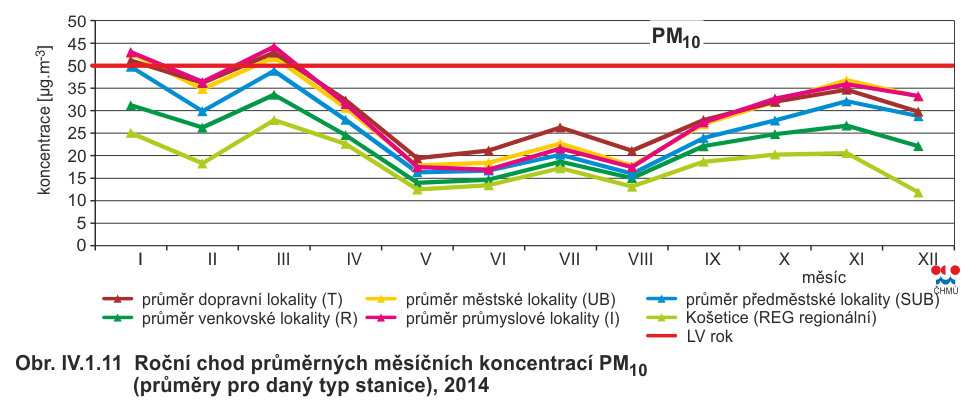
Fig. IV.1.11 Annual course of average monthly concentrations of
PM10 (averages for the given type of station), 2014
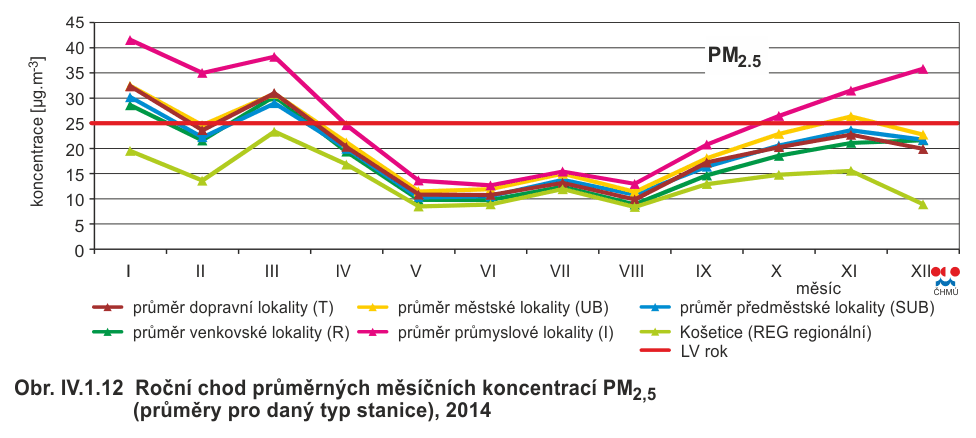
Fig. IV.1.12 Annual course of average monthly concentrations of
PM2.5 (averages for the given type of station), 2014
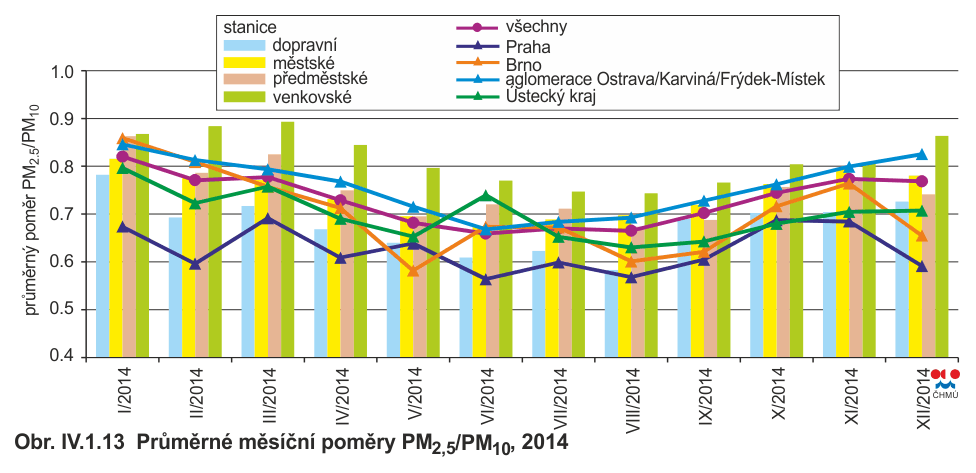
Fig. IV.1.13 Average monthly PM2.5/PM10 ratio, 2014
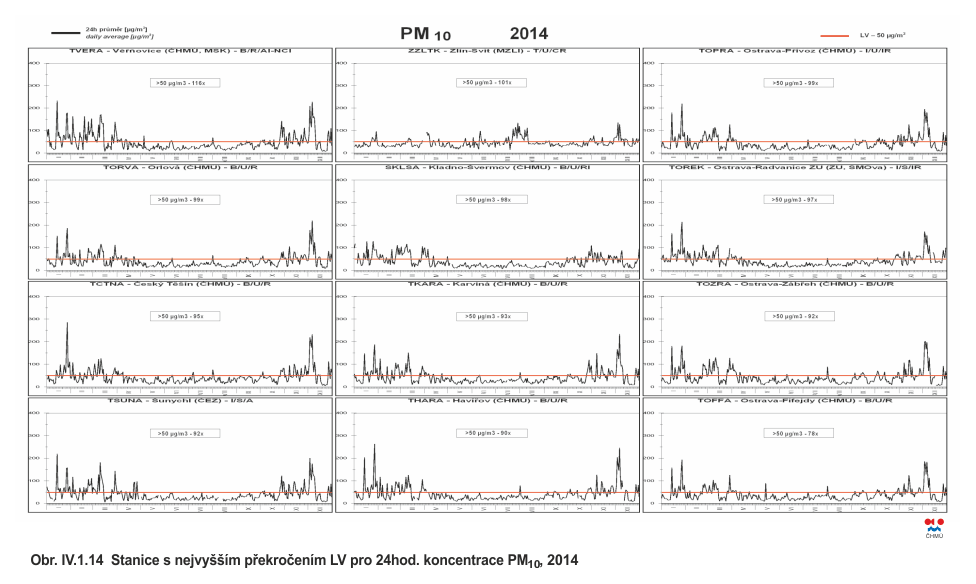
Fig. IV.1.14 Stations with the highest exceedance of LV for 24-hour
concentrations of PM10, 2014

Fig. IV.1.15 Trends of PM10 annual characteristics in the Czech
Republic, 2000–2014
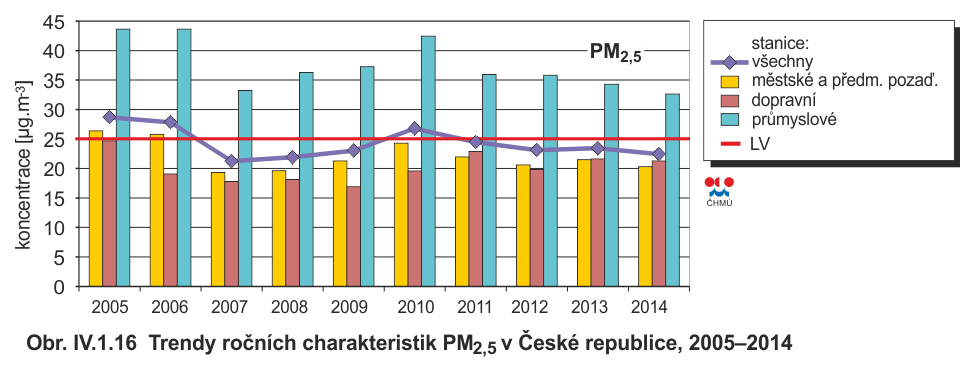
Fig. IV.1.16 Trends of PM2.5 annual characteristics in the Czech
Republic, 2005–2014
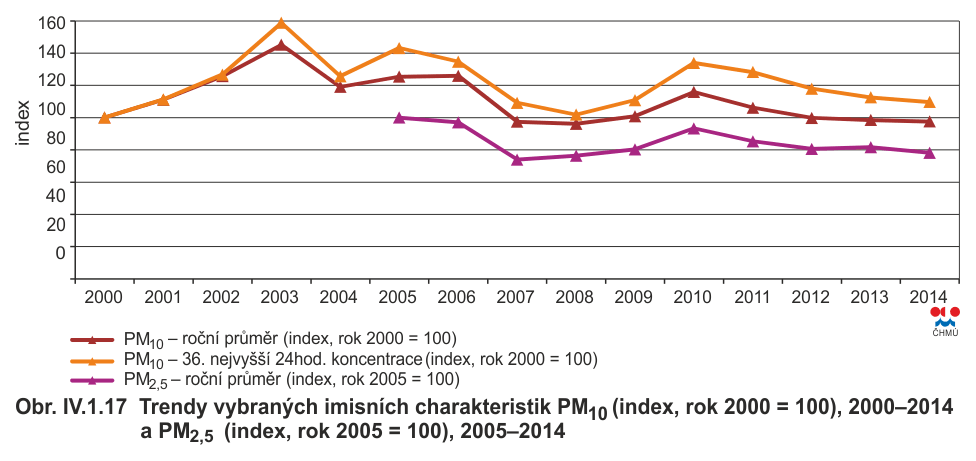
Fig. IV.1.17 Trends of selected characteristics of PM10 (index,
year 2000 = 100), 2000–2014 and PM2.5 (index, year 2005 = 100),
2005–2014
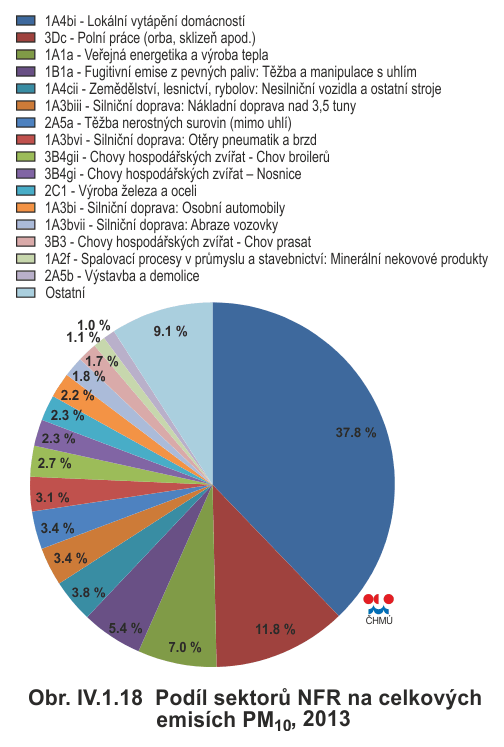
Fig. IV.1.18 Total emissions of PM10 sorted out by NFR sectors,
2013

Fig. IV.1.19 The development of PM10 total emissions, 2007–2013
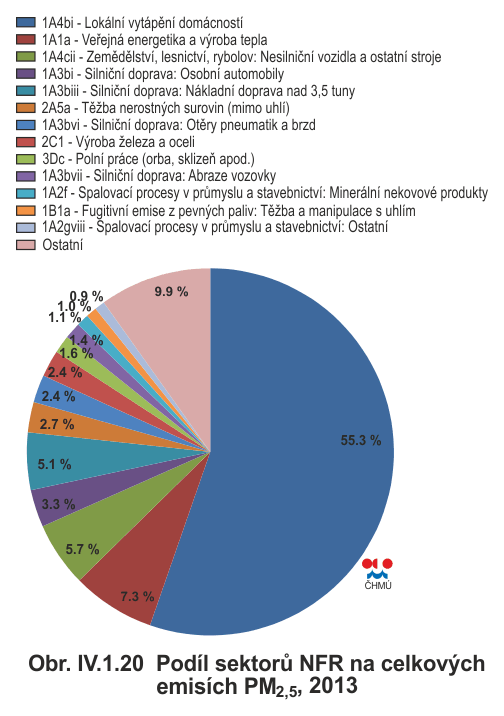
Fig. IV.1.20 Total emissions of PM2.5 sorted out by NFR sectors,
2013
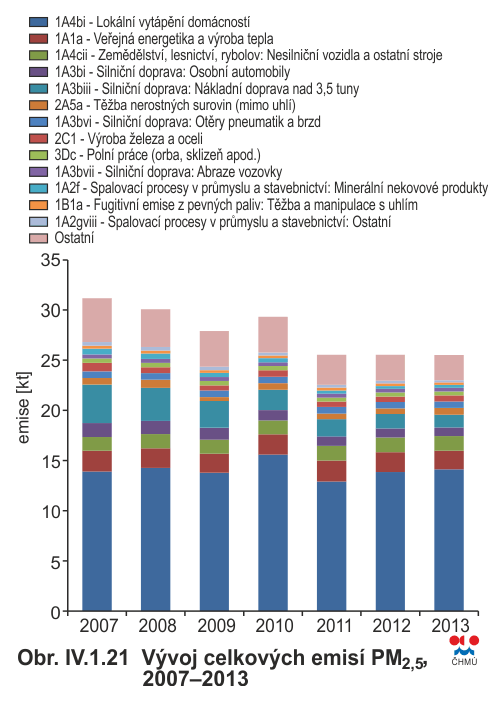
Fig. IV.1.21 The development of PM2.5 total emissions, 2007–2013
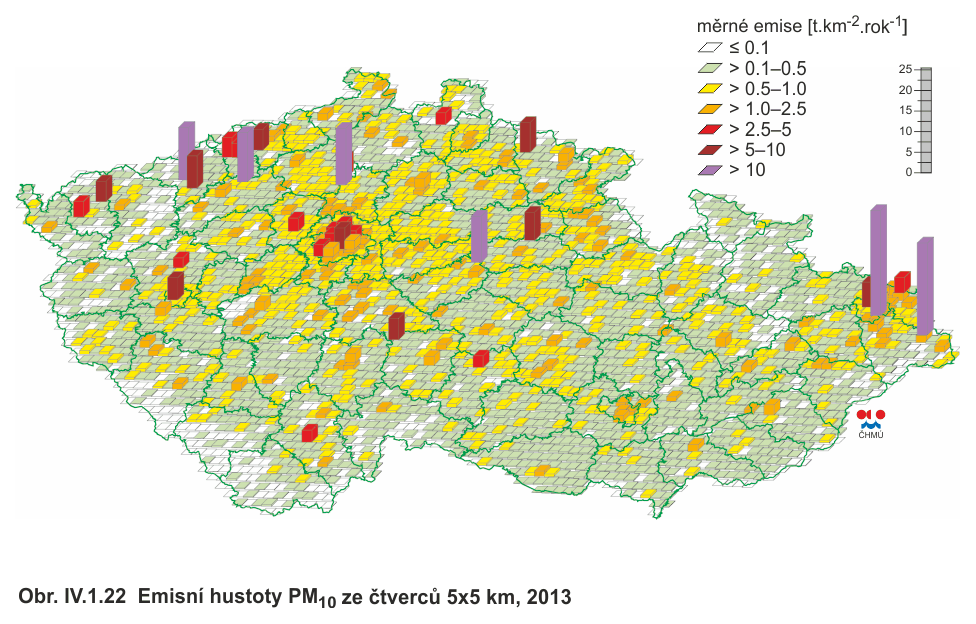
Fig. IV.1.22 PM10 emission density from 5x5 km squares, 2013
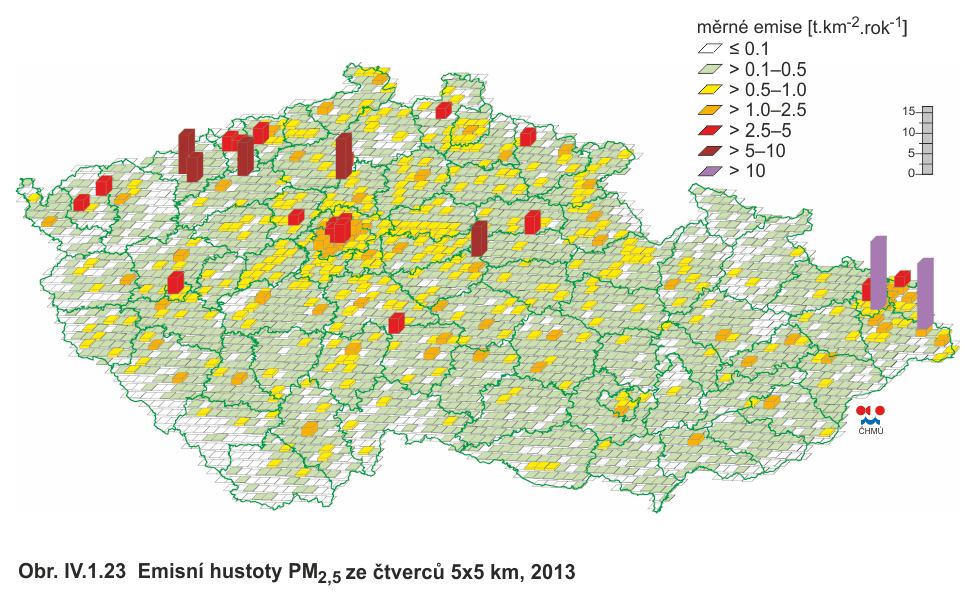
Fig. IV.1.23 PM2.5 emission density from 5x5 km squares, 2013
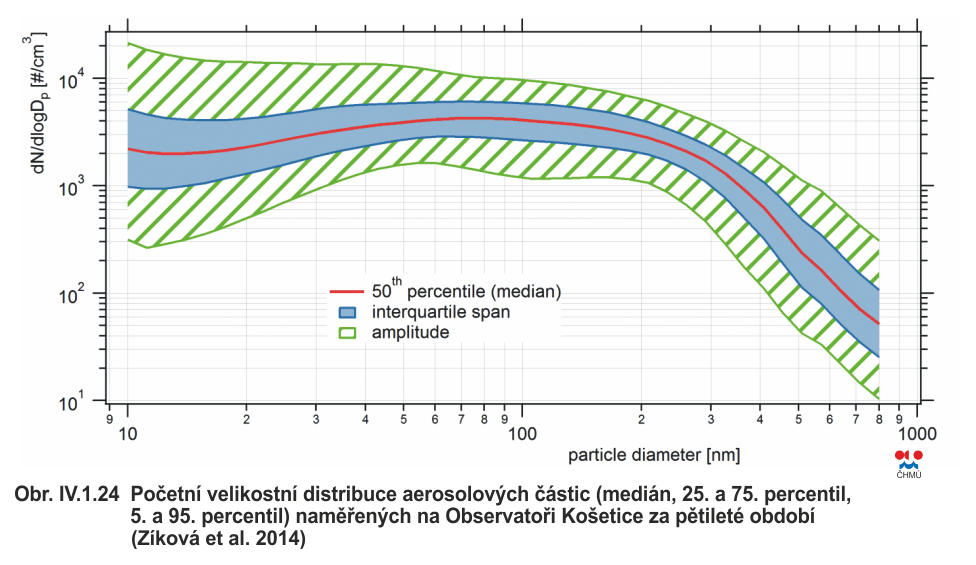
Fig. IV.1.24 Numerical size distribution of aerosol particles
(median, 25th and 75th percentile, 5th and 95th percentile)
measured at the Košetice observatory over a period of five years
(Zíková et al. 2014)
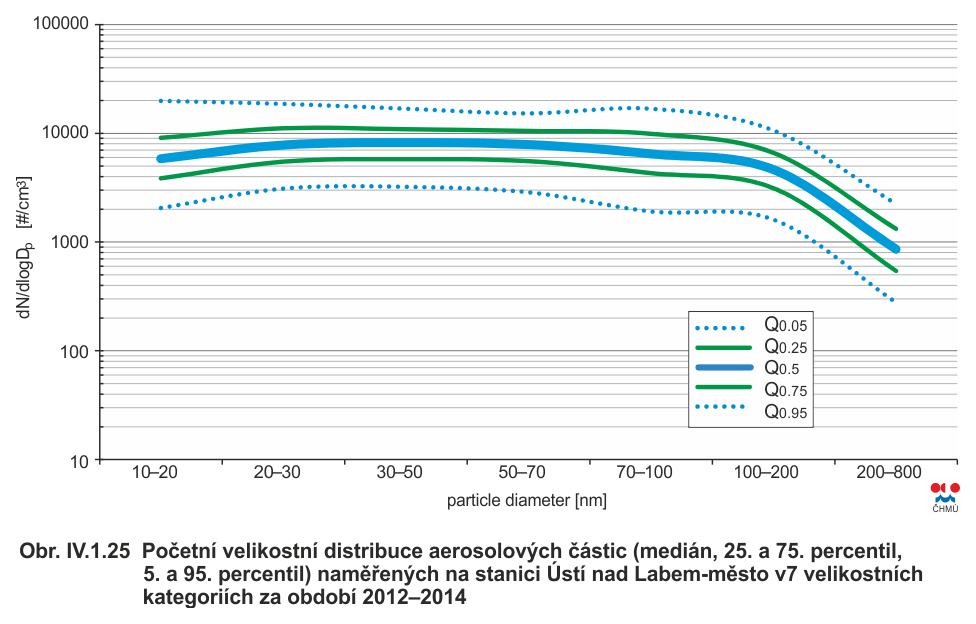
Fig. IV.1.25 Numerical size distribution of aerosol particles (median,
25th and 75th percentile, 5th and 95th percentile) measured at
the station Ústí nad Labem-město for 7 size categories over the
period of 2012–2014
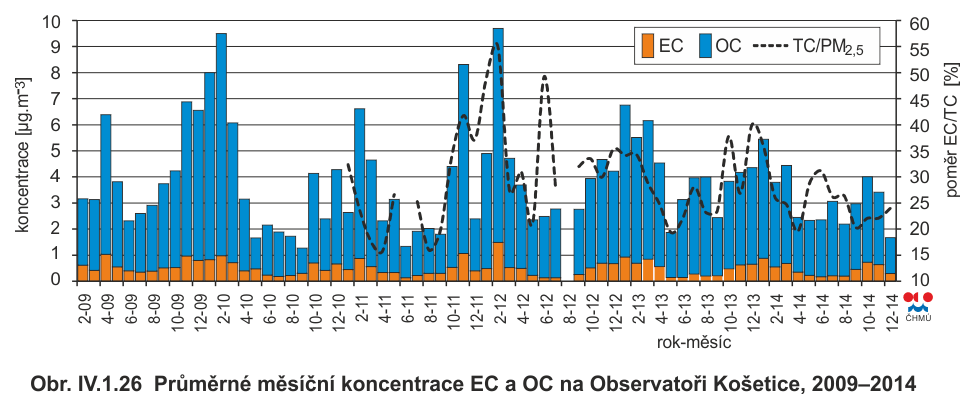
Fig. IV.1.26 Average monthly concentrations of EC and OC at the
Košetice observatory, 2009–2014

Fig. IV.1.27 Monthly variation of average concentrations of EC
and OC at the Košetice observatory, 2009–2014
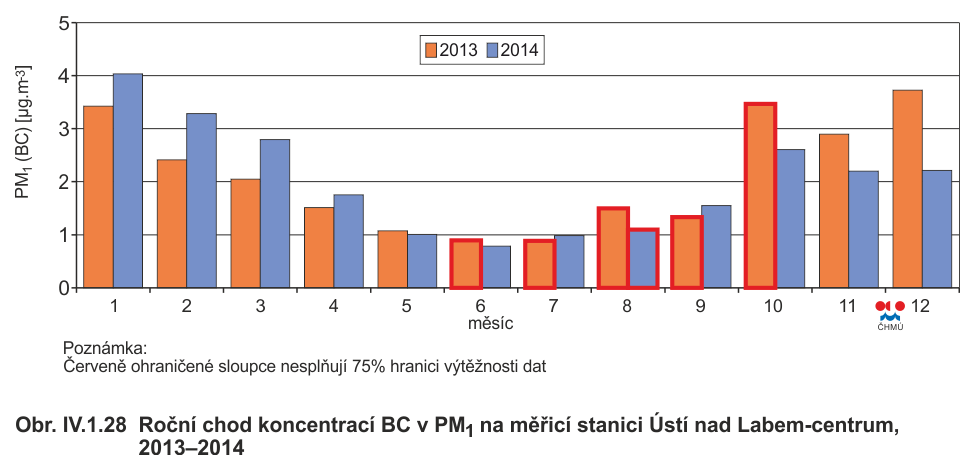
Fig. IV.1.28 Annual progression of concentrations of BC in PM1
measured at the Ústí nad Labem-centrum station, 2013–2014