III. METEOROLOGICAL AND DISPERSION CONDITIONS
Ambient air quality is influenced, besides sources of air pollution, also by meteorological conditions. They affect the amount of emissions from anthropogenic and natural sources, determine the dispersion conditions, and influence the formation of secondary pollutants in ambient air and the removal of pollutants from the atmosphere.
The influence of meteorological conditions on emissions
As concerns anthropogenic emissions, meteorological
conditions have the greatest influence on emissions from heating.
Emissions from heating are estimated according to the number of
heating days and the temperatures measured during them. The
thermal energy supply system is regulated by Decree No. 194/2007
Coll.1 The behaviour of households
with their own combustion systems differs from that of central
suppliers of thermal energy. For this reason, this yearbook,
unlike the above Decree, defines heating days as days on which
the average daily temperature at a given site decreases below 13
°C. The temperature conditions in the heating season (January–May,
September– December) or in its part are characterized by so-called
degree days – i.e. the sum of differences between the
reference indoor temperature and the average daily outdoor
temperature on heating days:
here Dtref are degree days, tref is the reference indoor air temperature (21 °C) and td is the average daily temperature on individual heating days.
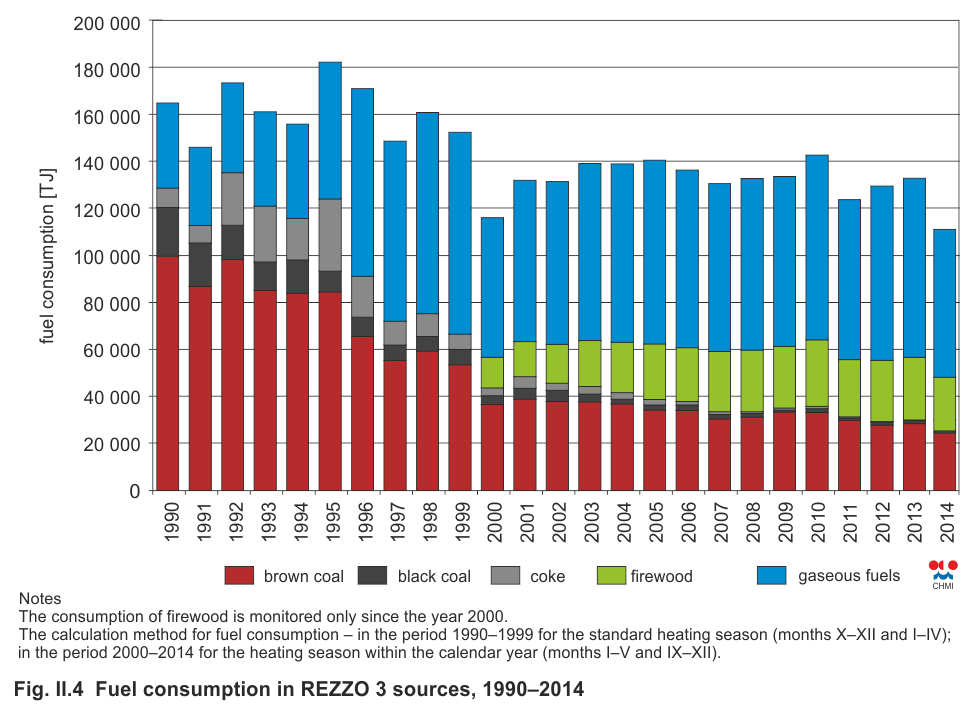
The degree days for the territory of the Czech Republic presented below (Figs. III.1 and III.2) correspond to average values from more than 200 climatological stations operated by the CHMI. A comparison of Fig. III.1 and Fig. II.4 reveals that higher consumption of solid fuels and natural gas in 2010 and their lower consumption in 2014 correspond to highly supernormal and subnormal values of degree days in these years, respectively. Low temperatures may increase combustion emissions from motor vehicles, especially during cold starts (ATEM 2012, Chan et al. 2013, Vojtíšek 2013).
Emissions of volatile organic compounds (VOC) from solvents and petrol storage and distribution are also dependent on temperature. Temperature and the photosynthetically active component of solar radiation influence biogenic emissions of non-methanic volatile organic compounds (e.g. isoprene and terpenes), which act as precursors of secondary organic aerosols and ground-level ozone. Emissions from forest vegetation are especially significant (e.g. Bednář et al. 2013, Zemánková et al. 2010). Wind (with a velocity approx. above 4 m.s-1) can cause the resuspension of settled dust particles. Meteorological conditions also influence the volatilization of persistent organic pollutants from soil, present mainly due to agricultural activities.
Influence of meteorological conditions on dispersion
conditions
Dispersion conditions are determined primarily by the stability of the mixing layer of the atmosphere and flow velocity. The mixing layer is the part of the atmosphere adjacent to the Earth’s surface where, due to the interaction with the Earth’s surface, mechanical and thermal turbulence occurs, causing intensive vertical transfer of momentum, heat, water vapour and pollutants.
The greater the stability of the mixing layer, the greater the ability of the atmosphere to suppress the initial vertical deviation of the volume of air and thus prevent vertical mixing. The stability depends on the relationship between temperature and elevation. In the most stable situations, air temperature increases with elevation (inversion stratification) and the conditions for vertical mixing are least favourable. In unstable stratification, the temperature decreases with elevation more quickly than would correspond to normal conditions in the atmosphere. This is manifested as regular thermal convection and thermal turbulence caused by Archimedean forces involved in the field of turbulent air fluctuations (Bednář 2008). Horizontal dispersion of emissions is influenced by wind velocity and wind direction. Moreover, strong wind results in the development of mechanical turbulence and thus contributes to vertical mixing of layers.
One way to quantify dispersion conditions is the so-called ventilation index (VI), which is defined as the height of the mixing layer multiplied by average wind velocity within it2.
In the conditions of the Czech Republic, usual values of the ventilation index expressed in this way reach hundreds to 30,000 m2.s-1. Values above 3,000 m2.s-1 indicate good dispersion conditions, values between 1,100 and 3,000 m2.s-1 indicate moderately poor dispersion conditions, and values below 1,100 m2.s-1 indicate poor dispersion conditions. Poor dispersion conditions do not necessarily mean the occurrence of high concentrations of pollutants. On the contrary, however, we can state that significant and extensive exceedances of limit values occur almost exclusively during moderately poor and poor dispersion conditions. The frequency of different dispersion conditions depends on the time of day and the part of the year. From the standpoint of long-term averages, it can be said that whereas in winter individual types of dispersion conditions tend to be distributed evenly during the day, in summer the frequency of unfavourable dispersion conditions is much lower during the day.
Influence of meteorological conditions on the formation of
secondary pollutants and the chemistry of the atmosphere
Meteorological conditions, in particular temperature, relative air humidity and solar radiation, directly influence the chemical and physical processes occurring between pollutants in the atmosphere (e.g. Baek et al. 2004). The influence of meteorological conditions can also be indirect, for example, when emitted substances are diluted due to intensive mixing, consequently decreasing the rate of reactions. The decisive factor determining the course of photochemical reactions is solar radiation. In summer periods, high temperatures and mainly intensive solar radiation contribute to high concentrations of ozone (Blažek et al. 2013).
Removal of pollutants
Pollutants are removed from the atmosphere through dry and wet deposition. During wet deposition, pollutants are washed out of the atmosphere to the Earth’s surface by precipitation. Wet deposition is divided into in-cloud deposition taking place within a cloud and involving the dilution of gaseous substances, capture of aerosol particles or their use as condensation nuclei, and below-cloud deposition during which particles are captured and gaseous substances are diluted in already falling drops. The effectiveness of the wash-out depends on the duration, type and intensity of precipitation. Dry deposition includes all other processes, and although its intensity is lower than that of wet deposition, in a longer time period it can decisively contribute to the removal of pollutants from the atmosphere.
Meteorological conditions in the year 2014
Temperature-wise, the year 2014 was exceptionally above normal in the territory of the Czech Republic with the average annual temperature of 9.4 °C, which is higher by 2.0 °C than the long-term average for the period 1961–1990. The year 2014 was thus the warmest since 1961, when averages for the territory of the Czech Republic were first provided. Most months of 2014 had supernormal or even strongly supernormal temperatures. Only May and June were normal, and August was subnormal. The largest temperature deviation from the normal was recorded in March (+3.7 °C).
The comparison of degree days in individual months of the heating season shows that in 2014, as against the long-term average for the period of 1984–2013, the production of emissions from heating was higher only in May. In all other months, it was lower (Fig. III.2).
Precipitation-wise, 2014 was a normal year with the average precipitation sum of 672 mm, amounting to 99 % of the long-term average for the period of 1961–1990. The most precipitation fell in May, when the precipitation sum was 114 mm (155 % of the long-term average). The lowest precipitation was recorded in February, when the average precipitation sum of 10 mm amounts to 26 % of the long-term average.
The representation of dispersion conditions types in individual months of 2014 for the Czech Republic and its urban agglomerations is presented in Fig. III.4. Zero occurrences of unfavourable conditions in February and in the warm part of the year are caused by the fact that the evaluation is done based on daily averages of the ventilation index, which better correspond to average daily concentrations. Compared to the seven-year average for the period 2007–2013 (tab. III.1), the frequency of unfavourable dispersion conditions in February, November and December 2014 mostly decreased. The only exception was the agglomeration of O/K/F-M, where their frequency in November markedly increased. By contrast, the occurrence of unfavourable dispersion conditions in January was mostly comparable to or somewhat higher than the seven-year average.
Fig. III.3 illustrates the relationship between meteorological conditions and concentrations of pollutants for the O/K/F-M agglomeration; depicted is the annual course of the ventilation index, temperatures and above-limit values PM10 and O3 in the agglomeration or at stations that for illustrative purposes can be regarded as representeative for the territory of the agglomeration.
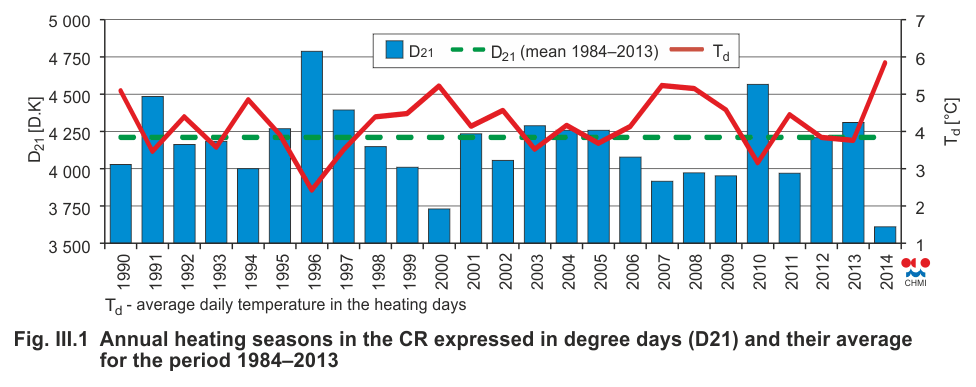
Fig. III.1 Annual heating seasons in the CR expressed in
degree days (D21) and their average for the period 1984–2013
Fig. III.2 Annual course of degree days in the territory of
the CR in the heating season 2014 (I–V, IX–XII) in comparison
with the average for 1984–2013
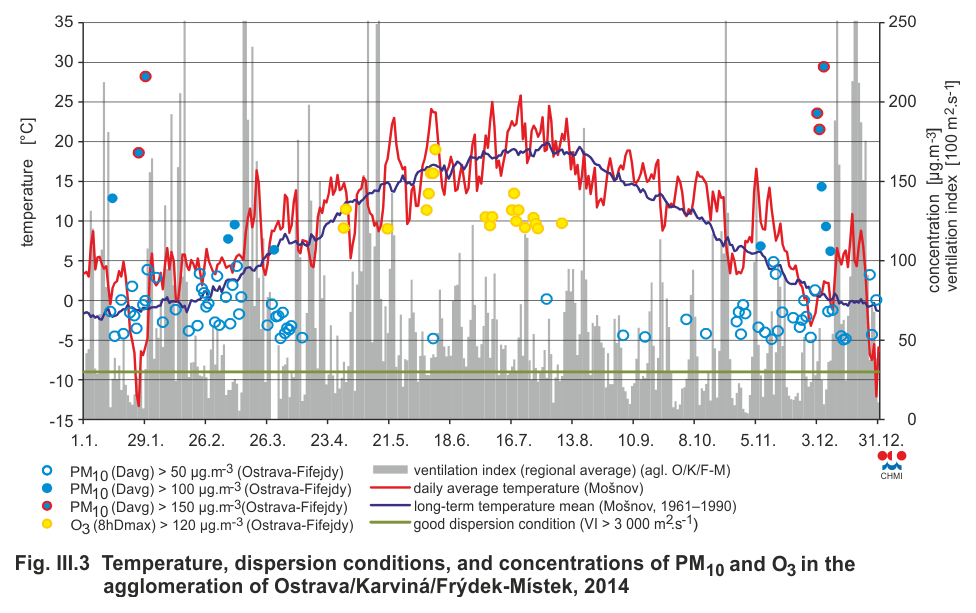
Fig. III.3 Temperature, dispersion conditions, and
concentrations of PM10 and O3 in the agglomeration of
Ostrava/Karviná/Frýdek-Místek, 2014
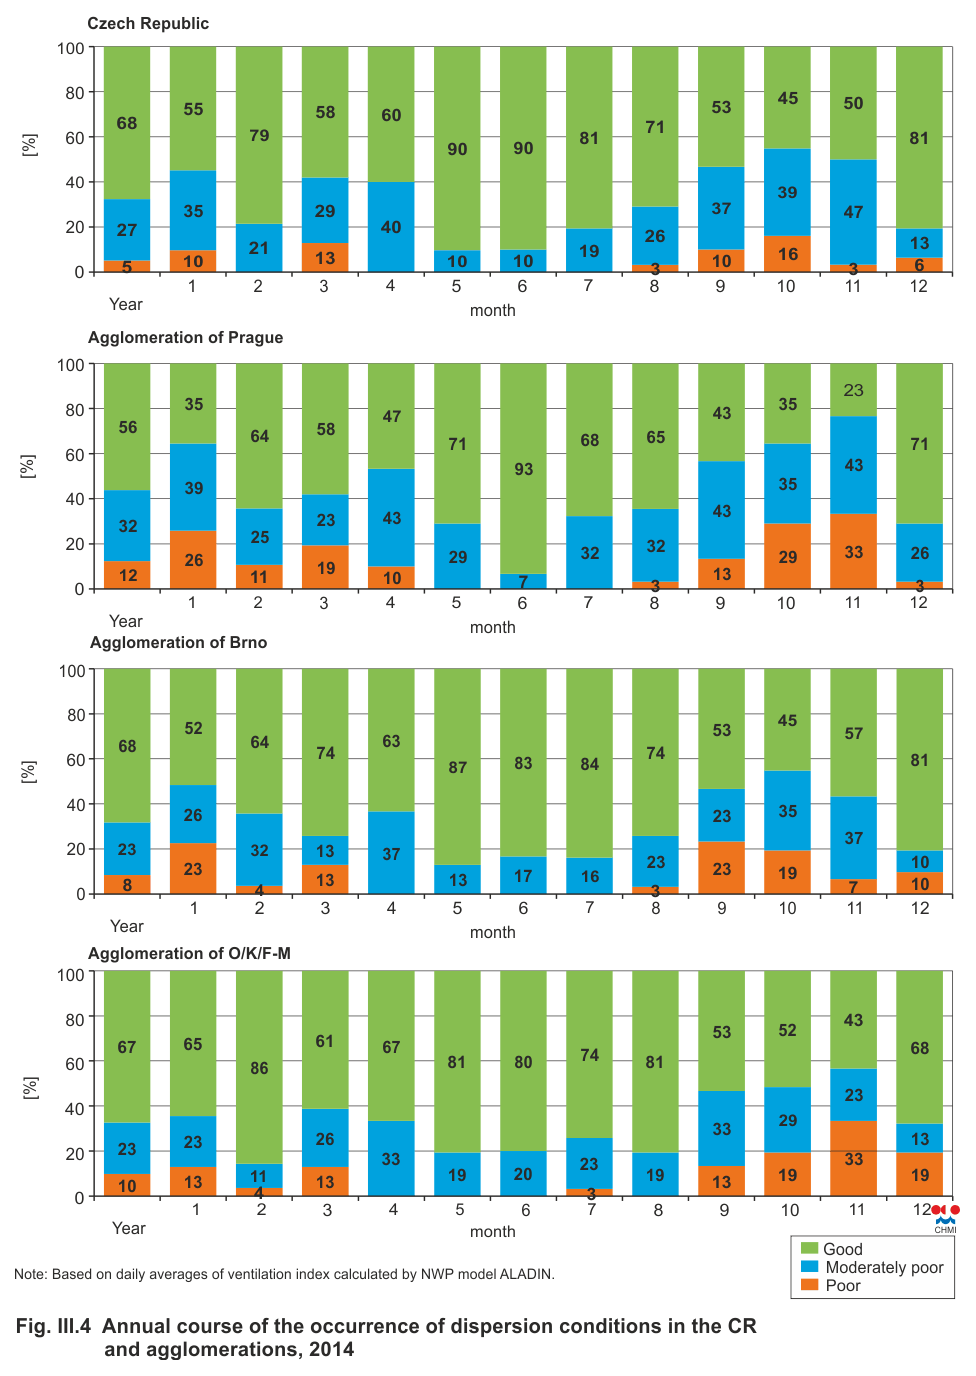
Fig. III.4 Annual course of the occurrence of dispersion
conditions in the CR and agglomerations, 2014
1According
to Decree No. 194/2007 Coll., the supply of heat starts in the
heating season (i.e. the period from 1 September to 31 May) if
the average daily outdoor air temperature at the site decreases
below +13 °C for two consecutive days and is not expected to
rise above +13 °C on the next day. Heating in the heating season
is reduced or interrupted if the average daily outdoor air
temperature at the given site or locality rises above +13 °C for
two consecutive days and when the temperature is not expected to
decrease on the next day. At a subsequent decrease of the
average daily outdoor air temperature below +13 °C, the heating
is started again..
2In practice and for the purposes of
this yearbook, the ventilation index is calculated as the
product of average windspeed in the mixing layer and mixing
height.