|
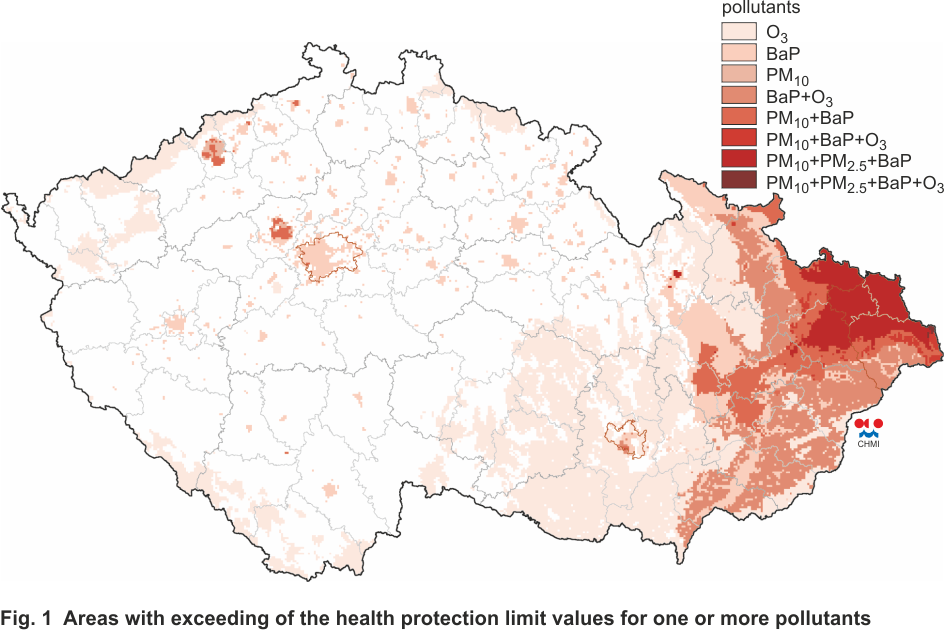
Fig. 1 |
Areas with exceeding of the health protection limit
values for one or more pollutants |
|
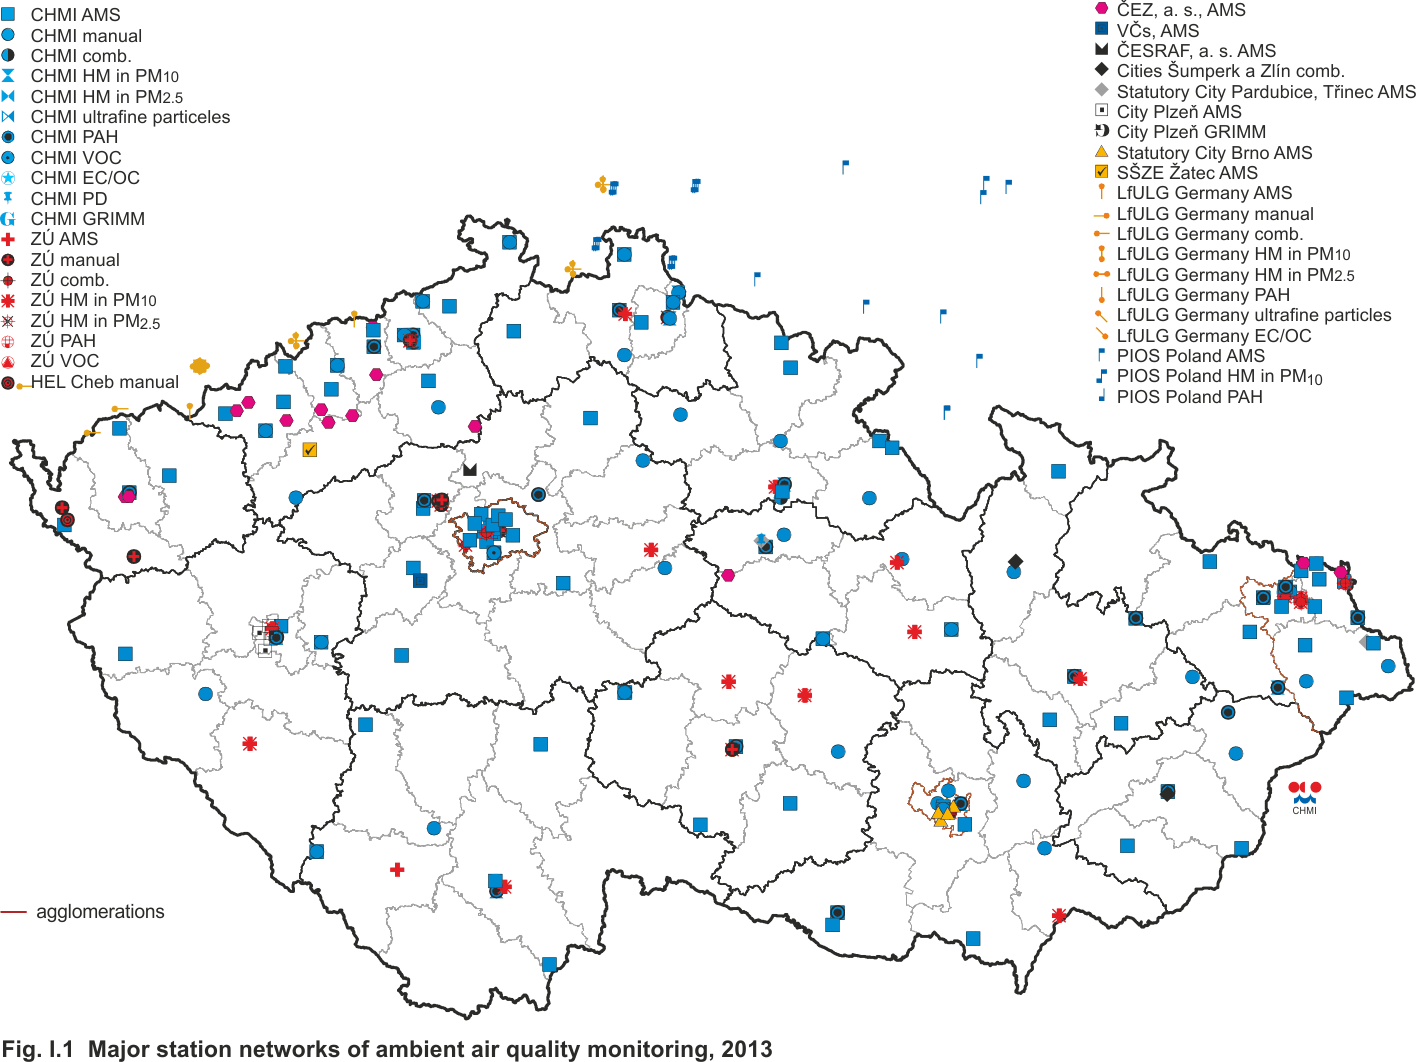
Fig. I.1 |
Major station networks of ambient air quality
monitoring, 2013 |
|
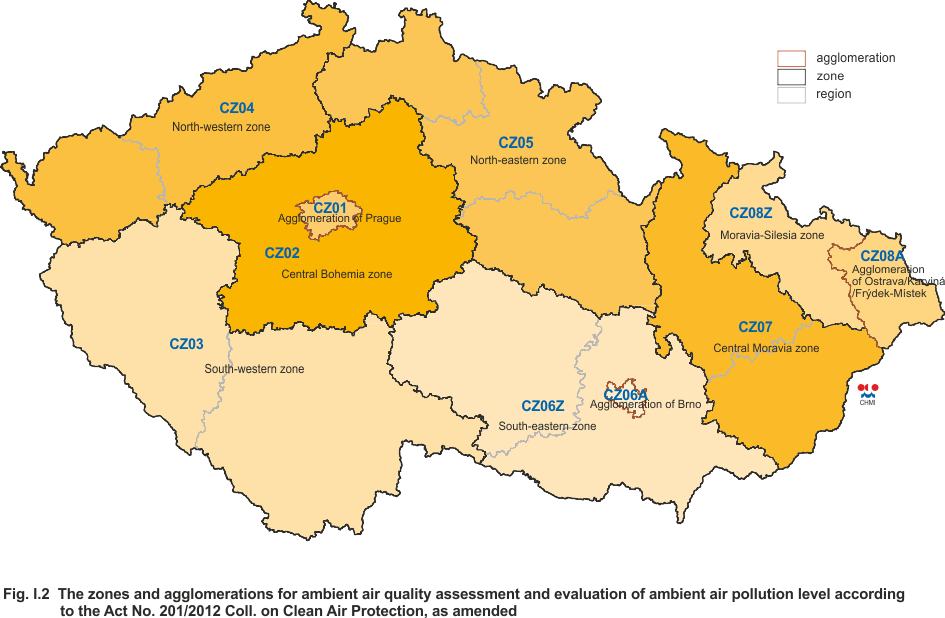
Fig. I.2 |
The zones and agglomerations for ambient air quality
assessment and evaluation of ambient air pollution level
according to the Act No. 201/2012 Coll. on Clean Air
Protection, as amended |
|
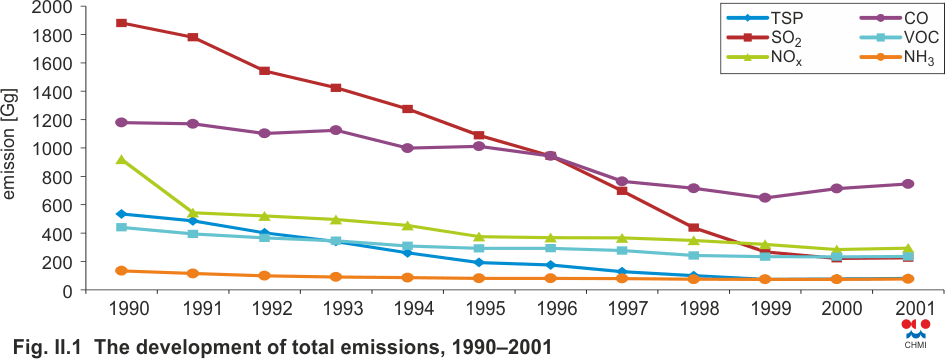
Fig. II.1 |
The development of total emissions, 1990–2001 |
|
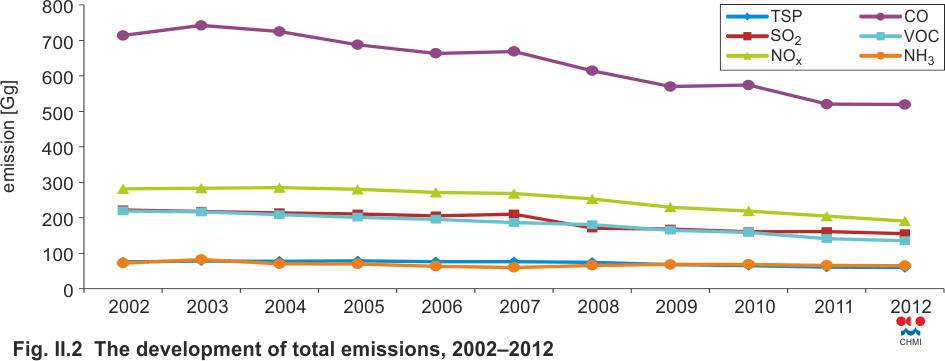
Fig. II.2 |
The development of total emissions, 2002–2012 |
|
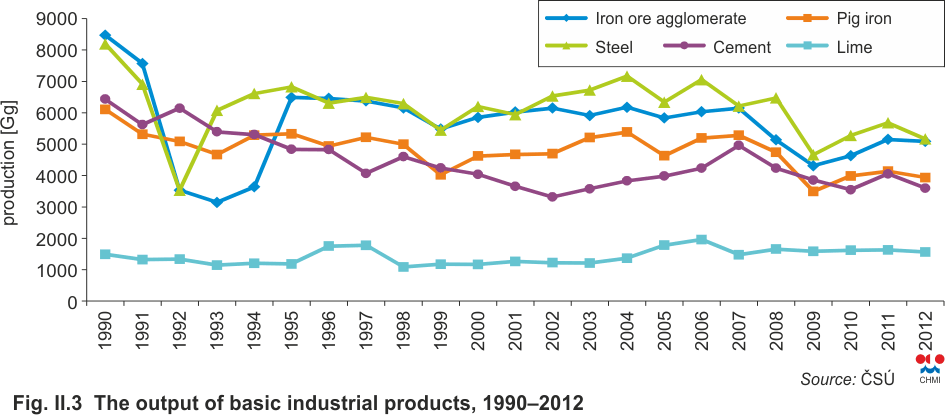
Fig. II.3 |
The output of basic industrial products, 1990–2012 (Source:
ČSÚ) |
|
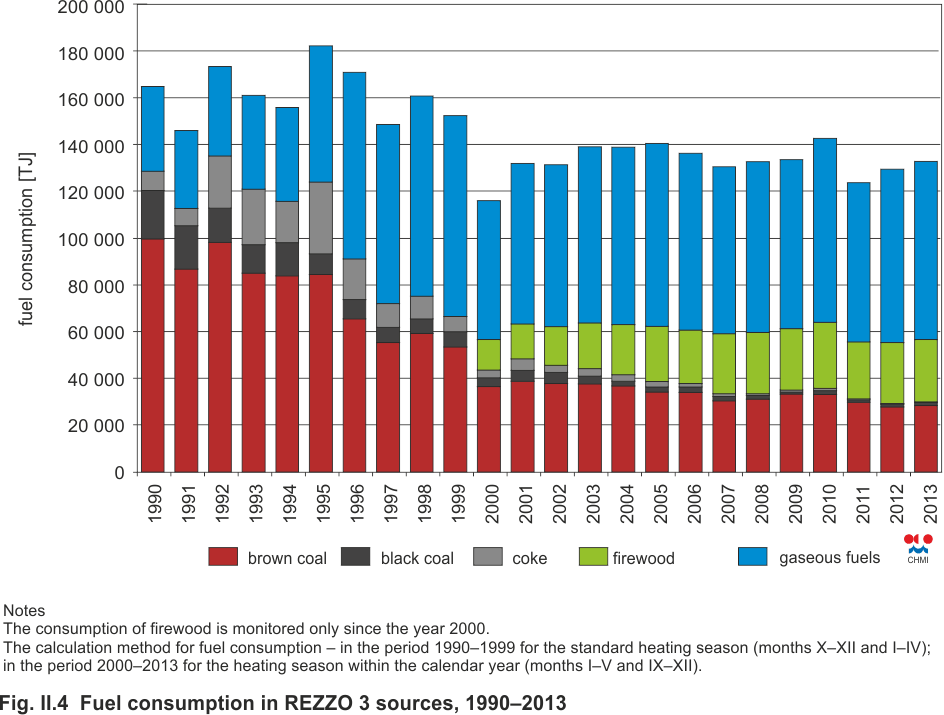
Fig. II.4 |
Fuel consumption in REZZO 3 sources, 1990–2013 |
|
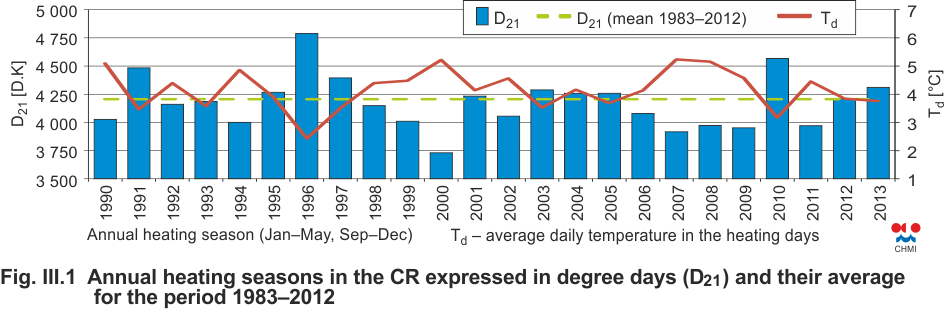
Fig. III.1 |
Annual heating seasons in the CR expressed in degree
days (D21) and their average for the period 1983–2012.
Td is the average daily temperature in the heating days. |
|
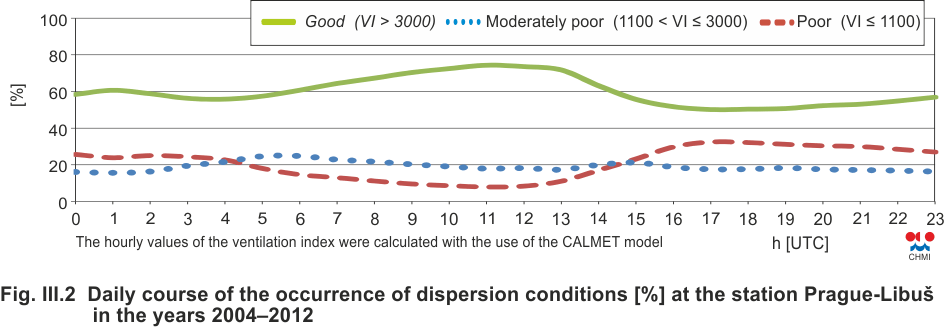
Fig. III.2 |
Daily course of the occurrence of dispersion
conditions (%) at the station Prague-Libuš in the years
2004–2012 |
|
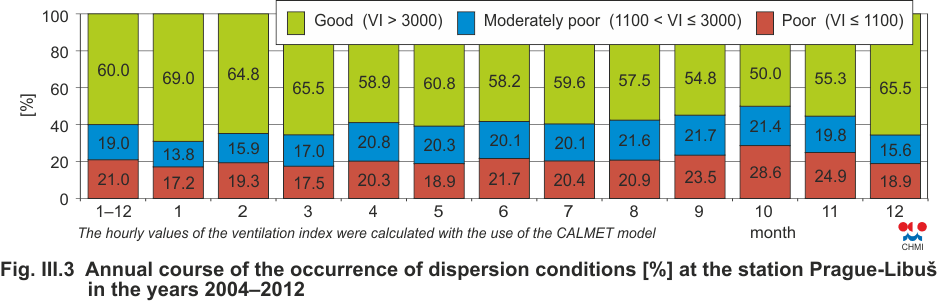
Fig. III.3 |
Annual course of the occurrence of dispersion
conditions (%) at the station Prague-Libuš in the years
2004–2012 |
|
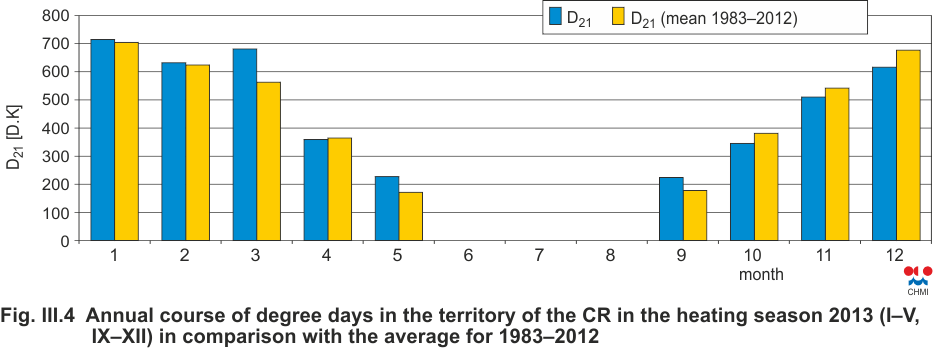
Fig. III.4 |
Annual course of degree days in the territory of the
CR in the heating season 2013 (I–V, IX–XII) in
comparison with the average for 1983–2012 |
|
Fig. III.5 |
Annual course of the occurrence of dispersion
conditions at the stations Prague-Libuš and Prostějov in
the year 2013 |
|
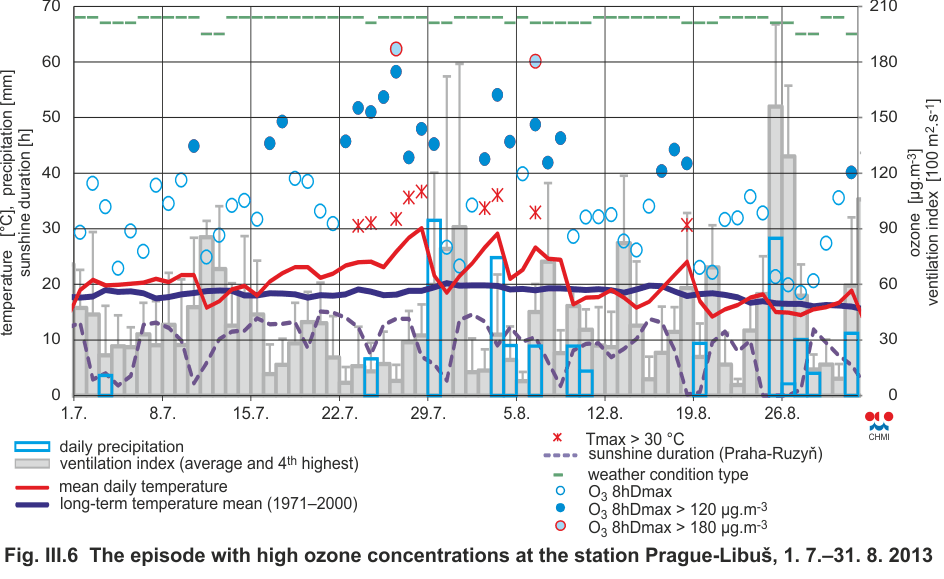
Fig. III.6 |
The episode with high ozone concentrations at the
station Prague-Libuš, 1. 7.–31. 8. 2013 |
|
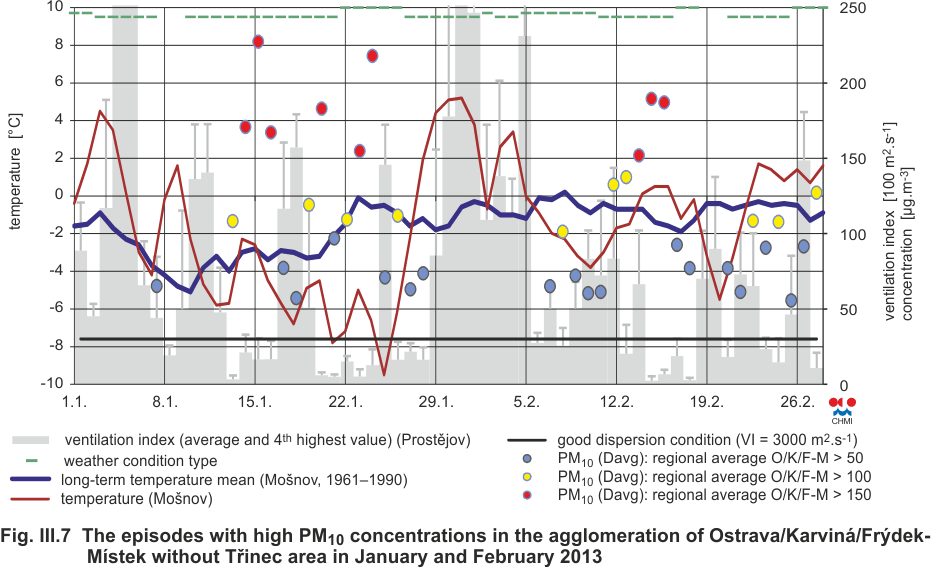
Fig. III.7 |
The episodes with high PM10 concentrations in the
agglomeration of Ostrava/Karviná/Frýdek-Místek without
Třinec area in January and February 2013 |
|
Fig. III.8 |
Temperature, dispersion conditions, types of weather
situations and concentrations of PM10 and O3 in the
agglomeration of Ostrava/Karviná/Frýdek-Místek without
Třinec area in the year 2013 |
|
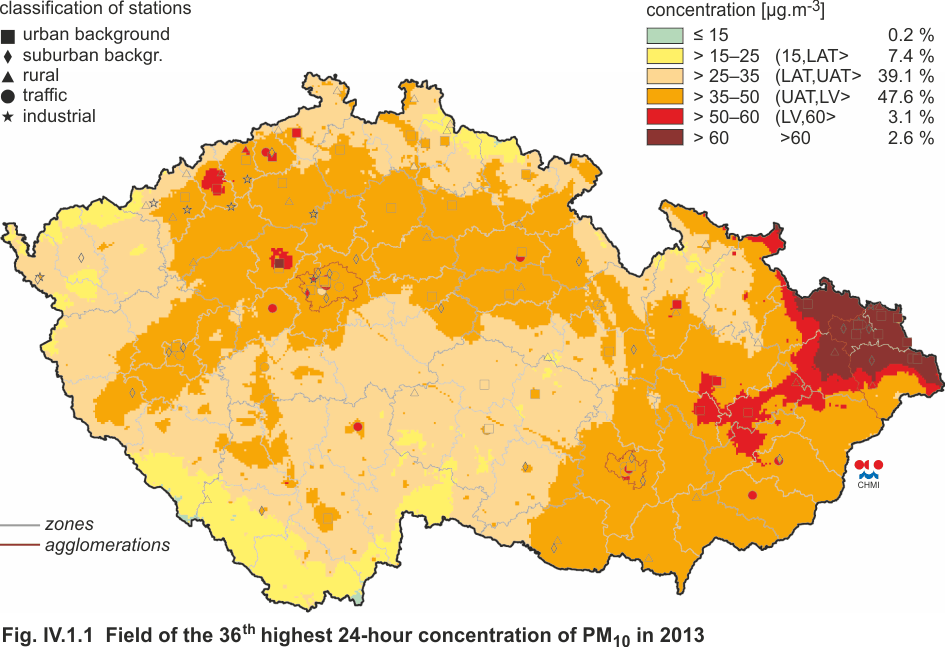
Fig. IV.1.1 |
Field of the 36th highest 24-hour concentration of
PM10 in 2013 |
|
Fig. IV.1.2 |
Field of annual average concentration of PM10 in
roce 2013 |
|
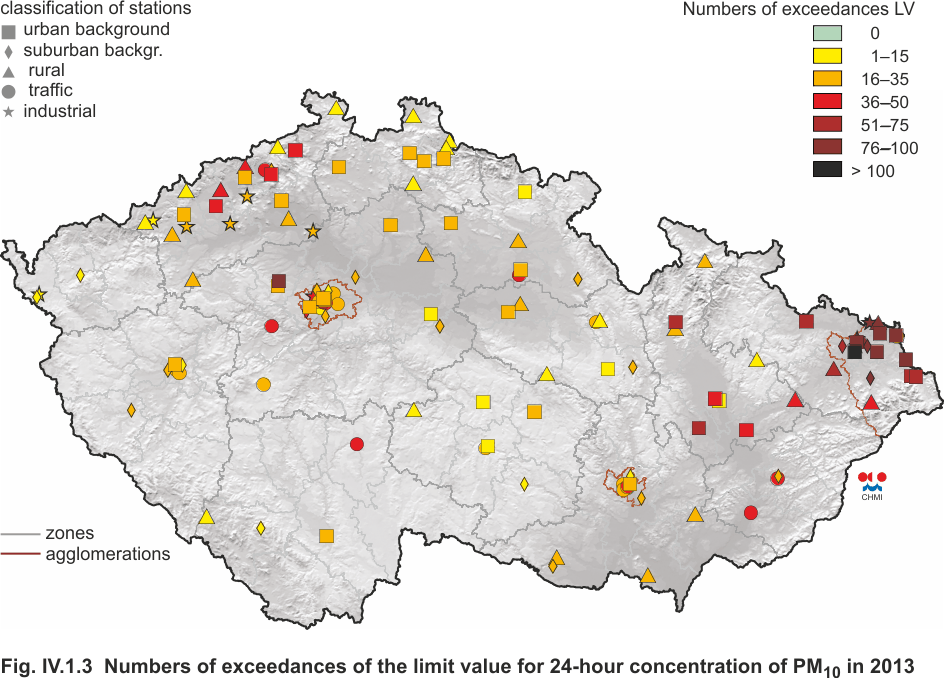
Fig. IV.1.3 |
Numbers of exceedances of the limit value for 24-hour
concentration of PM10 in 2013 |
|
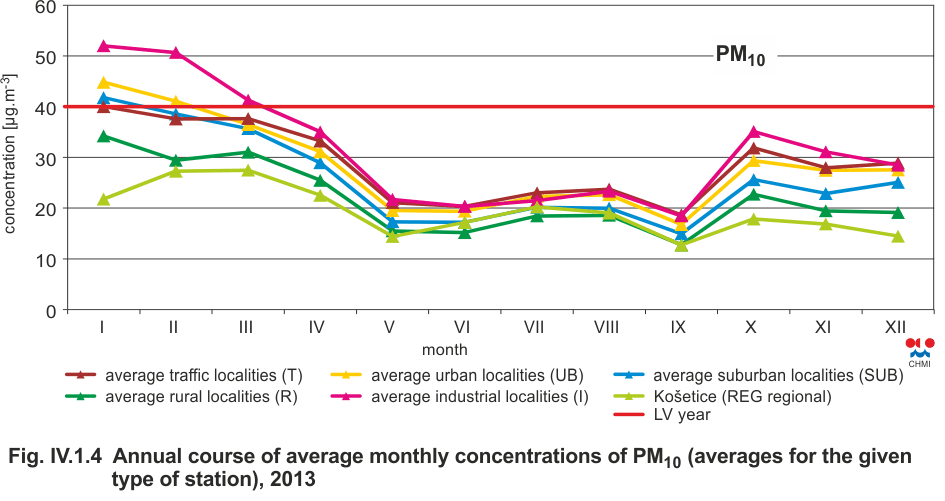
Fig. IV.1.4 |
Annual course of average monthly concentrations of
PM10 (averages for the given type of station), 2013 |
|
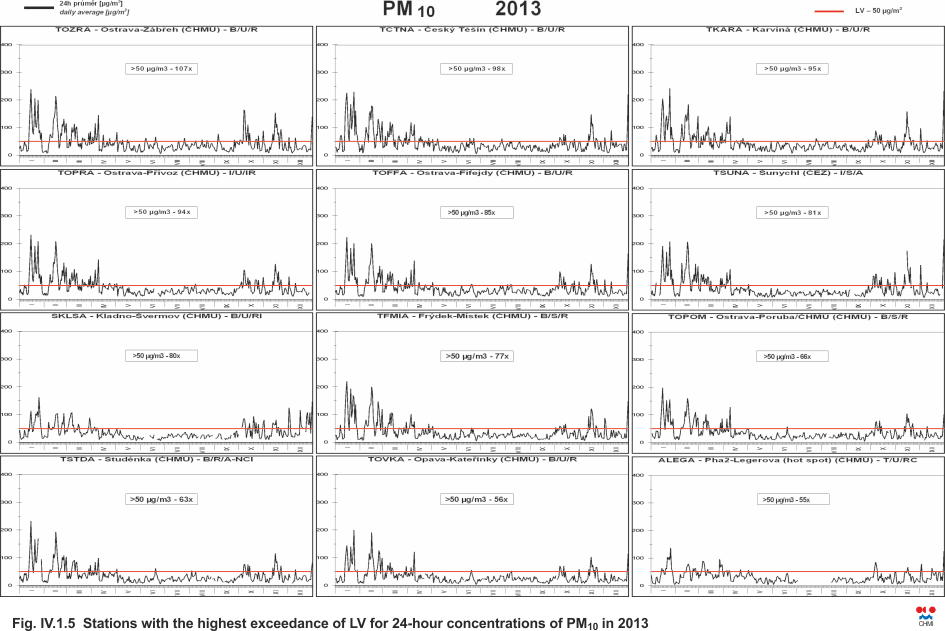
Fig. IV.1.5 |
Stations with the highest exceedance of LV for 24-hour
concentrations of PM10 in 2013 |
|
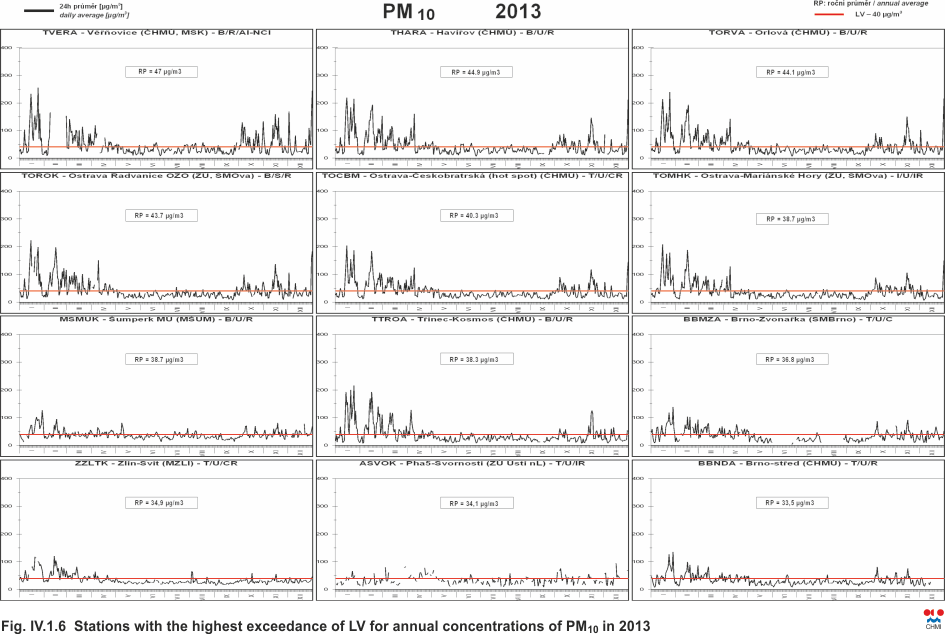
Fig. IV.1.6 |
Stations with the highest exceedance of LV for
annual concentrations of PM10 in 2013 |
|
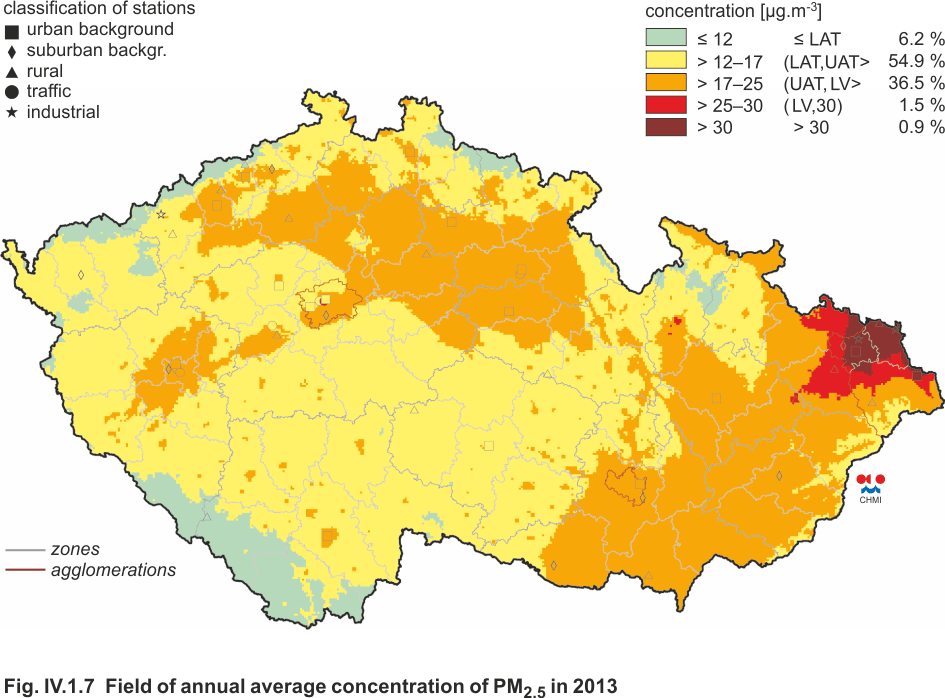
Fig. IV.1.7 |
Field of annual average concentration of PM2.5 in
2013 |
|
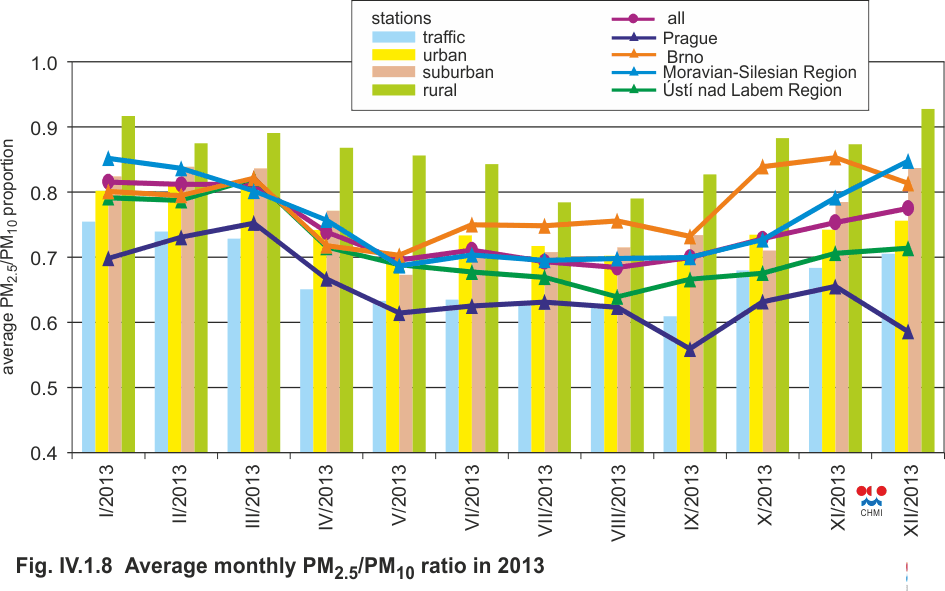
Fig. IV.1.8 |
Average monthly PM2.5/PM10 ratio in 2013 |
|
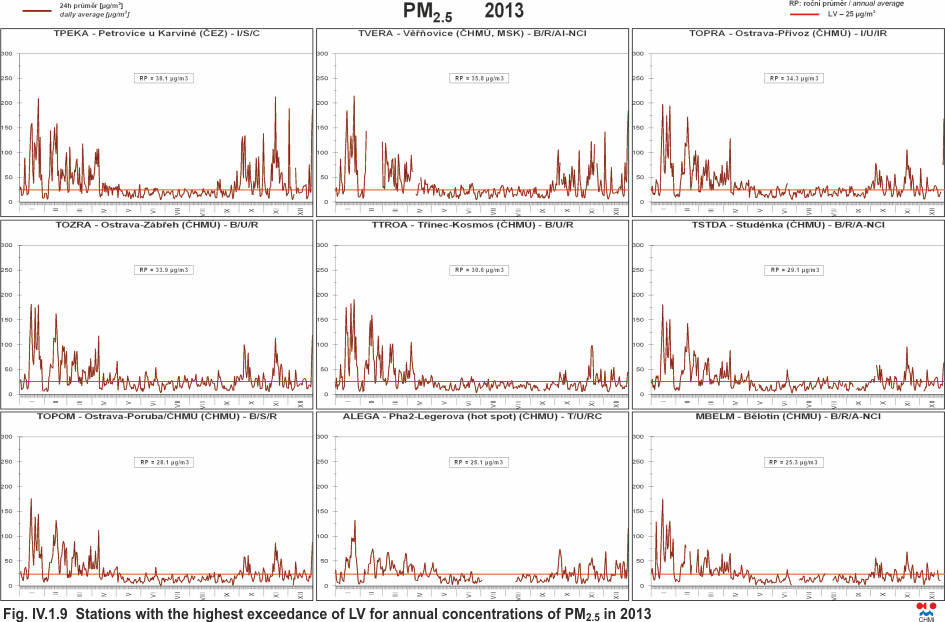
Fig. IV.1.9 |
Stations with the highest exceedance of LV for
annual concentrations of PM2.5 in 2013 |
|
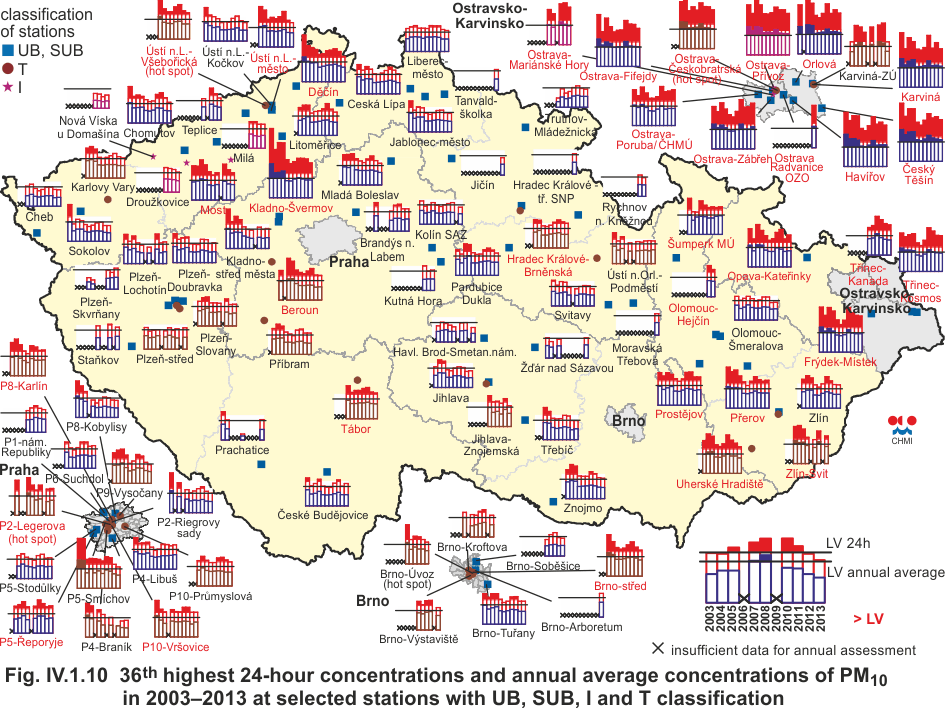
Fig. IV.1.10 |
36th highest 24-hour concentrations and annual
average concentrations of PM10 in 2003–2013 at selected
stations with UB, SUB, I and T classification |
|
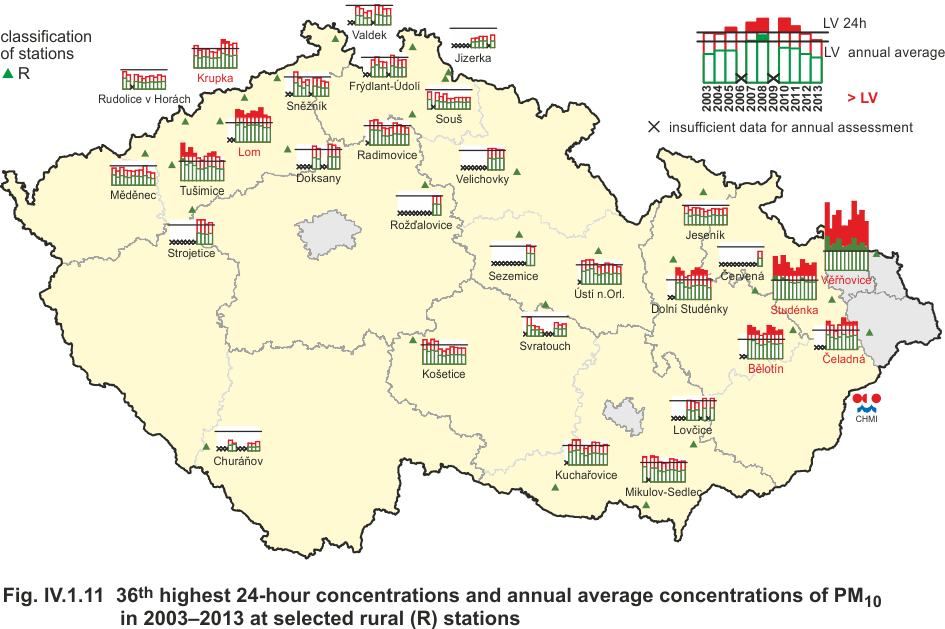
Fig. IV.1.11 |
36th highest 24-hour concentrations and annual
average concentrations of PM10 in 2003–2013 at selected
rural (R) stations |
|
Fig. IV.1.12 |
Annual average PM10 concentrations at the stations
with the exceedance of the limit value, 2004–2013 |
|
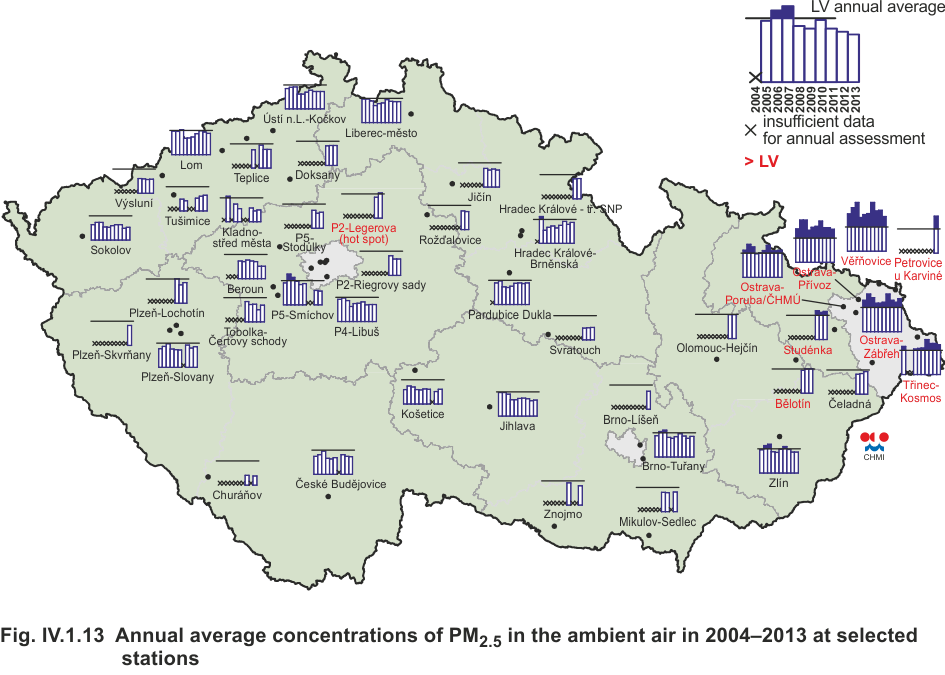
Fig. IV.1.13 |
Annual average concentrations of PM2.5 in the
ambient air in 2004–2013 at selected stations |
|
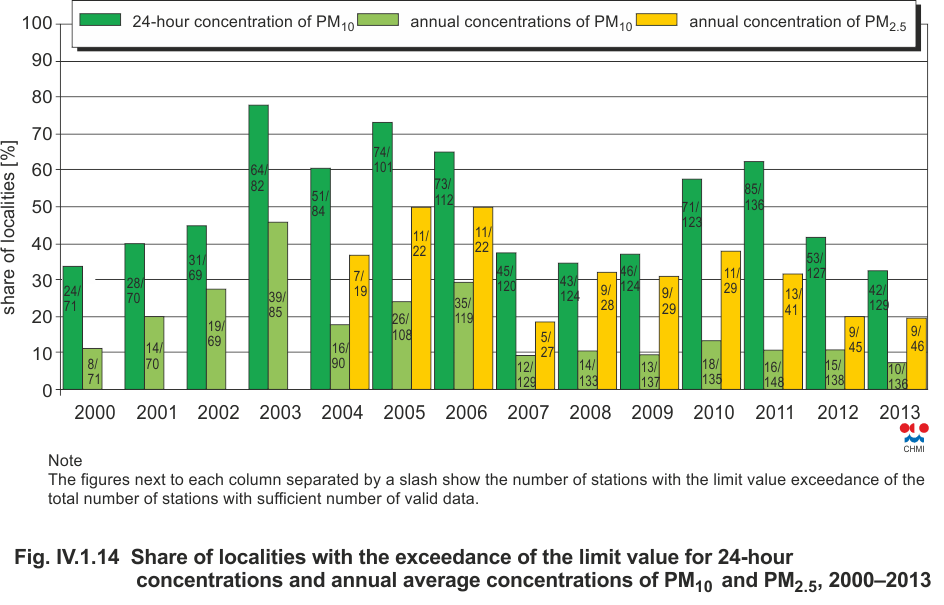
Fig. IV.1.14 |
Share of localities with the exceedance of the limit
value for 24-hour concentrations and annual average
concentrations of PM10 and target value for the annual
average concentration of PM2.5, 2000–2013 |
|
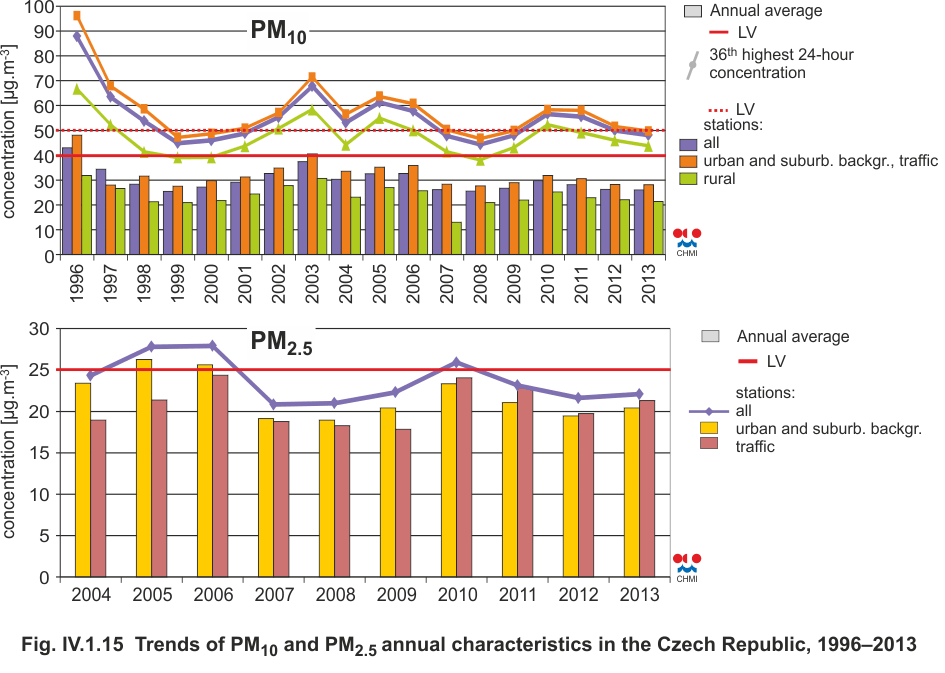
Fig. IV.1.15 |
Trends of PM10 and PM2.5 annual characteristics in
the Czech Republic, 1996–2013 |
|
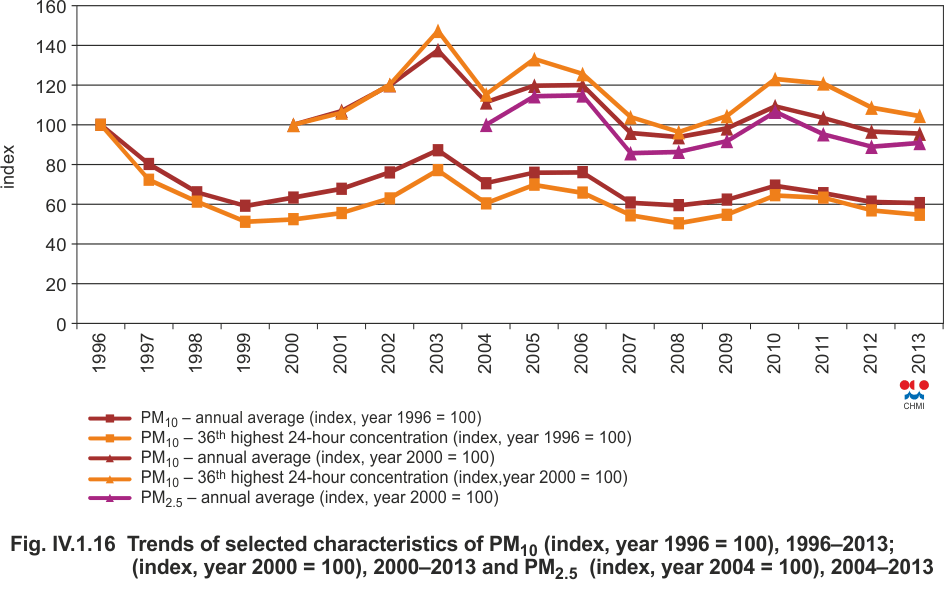
Fig. IV.1.16 |
Trends of selected characteristics of PM10 (index,
year 1996 = 100), 1996–2013; (index, year 2000 = 100),
2000–2013 and PM2.5 (index, year 2004 = 100), 2004–2013 |
|
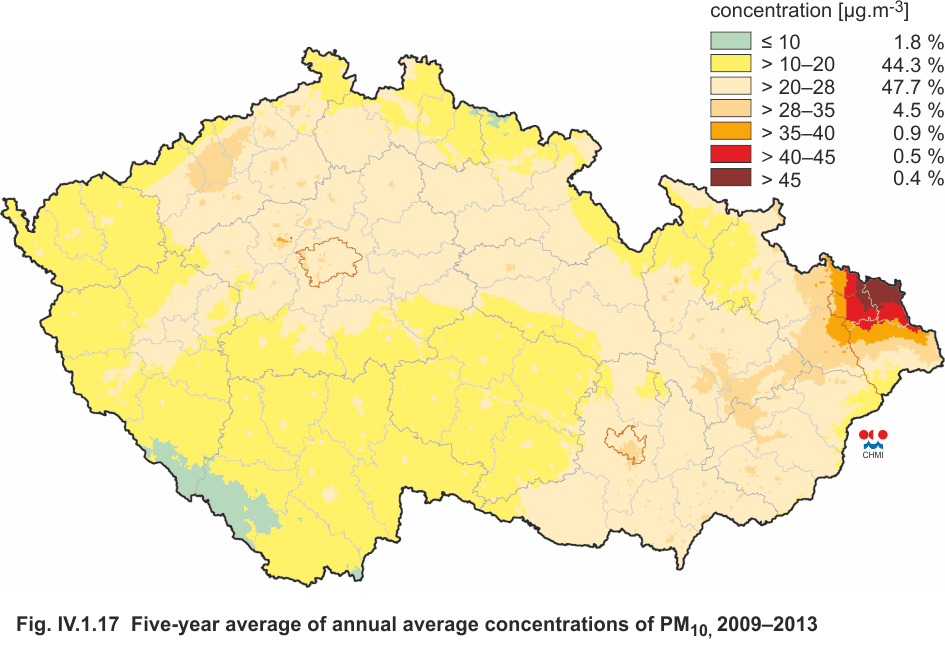
Fig. IV.1.17 |
Five-year average of annual average concentrations
of PM10, 2009–2013 |
|
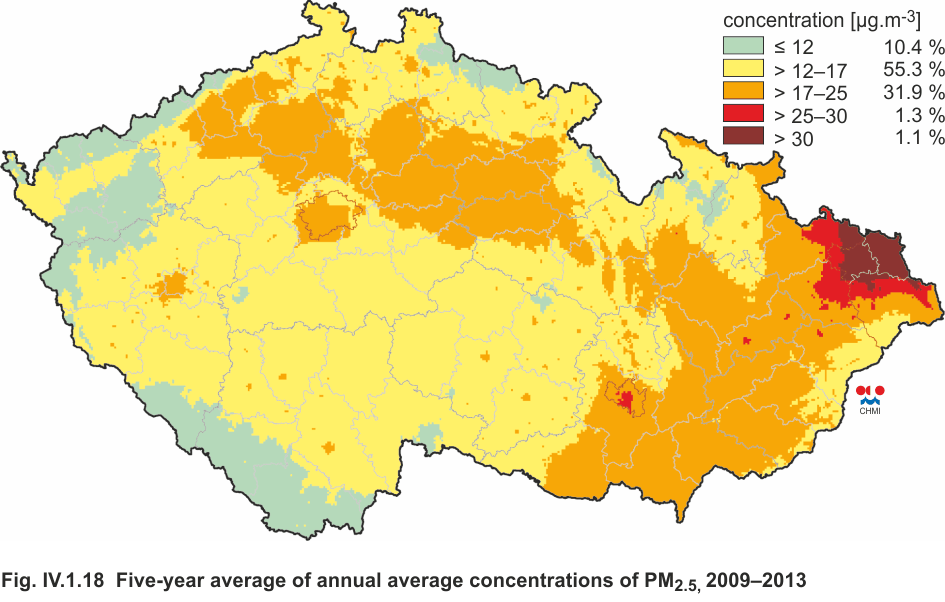
Fig. IV.1.18 |
Five-year average of annual average concentrations
of PM2.5, 2009–2013 |
|
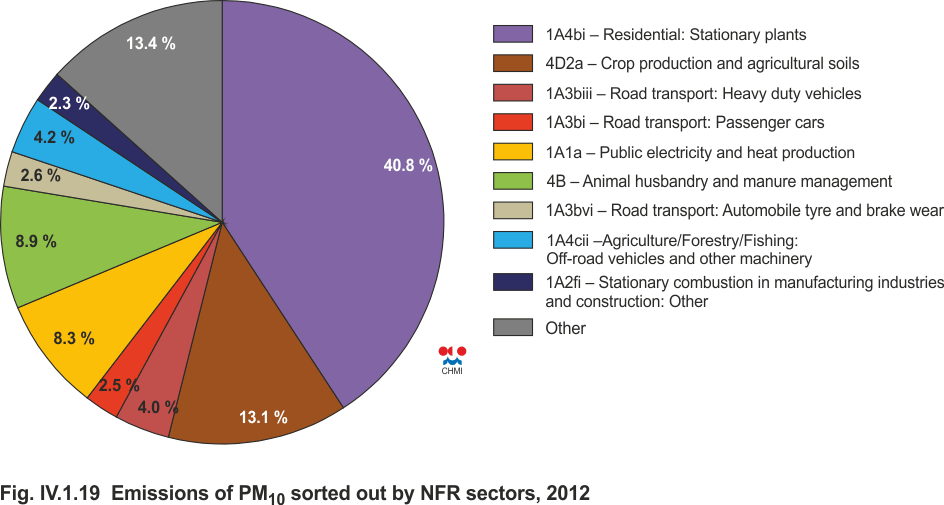
Fig. IV.1.19 |
Emissions of PM10 sorted out by NFR sectors, 2012 |
|
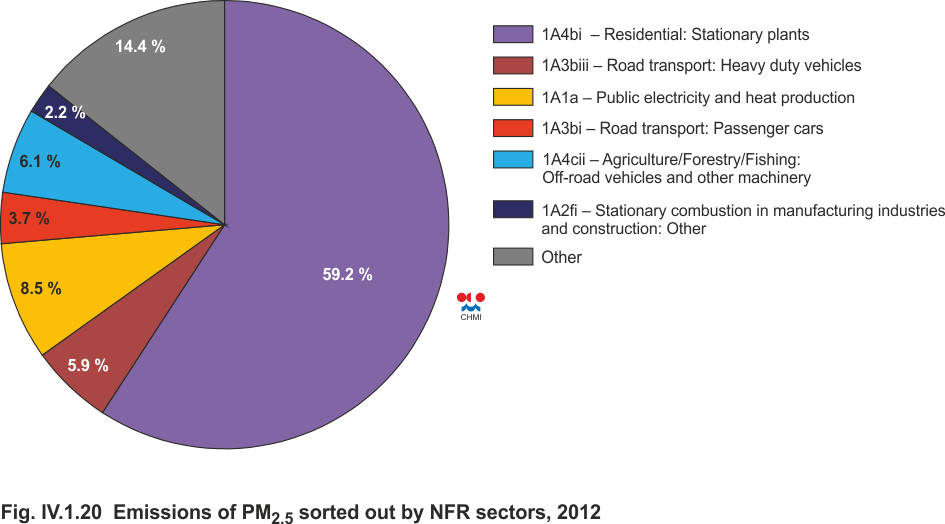
Fig. IV.1.20 |
Emissions of PM2.5 sorted out by NFR sectors, 2012 |
|
Fig. IV.1.21 |
The development of PM10 emissions, 2007–2012 |
|
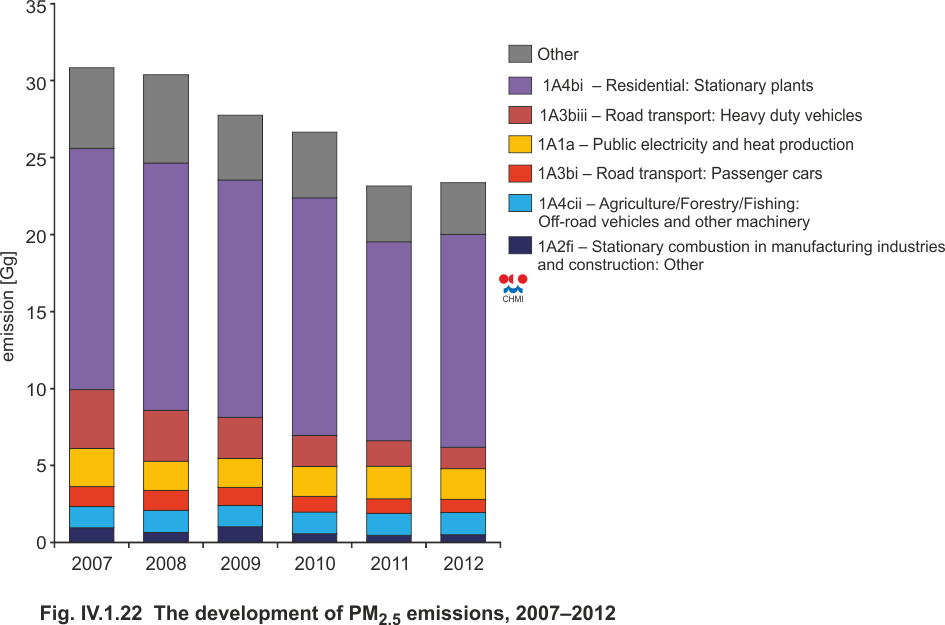
Fig. IV.3.22 |
The development of PM2.5 emissions, 2007–2012 |
|
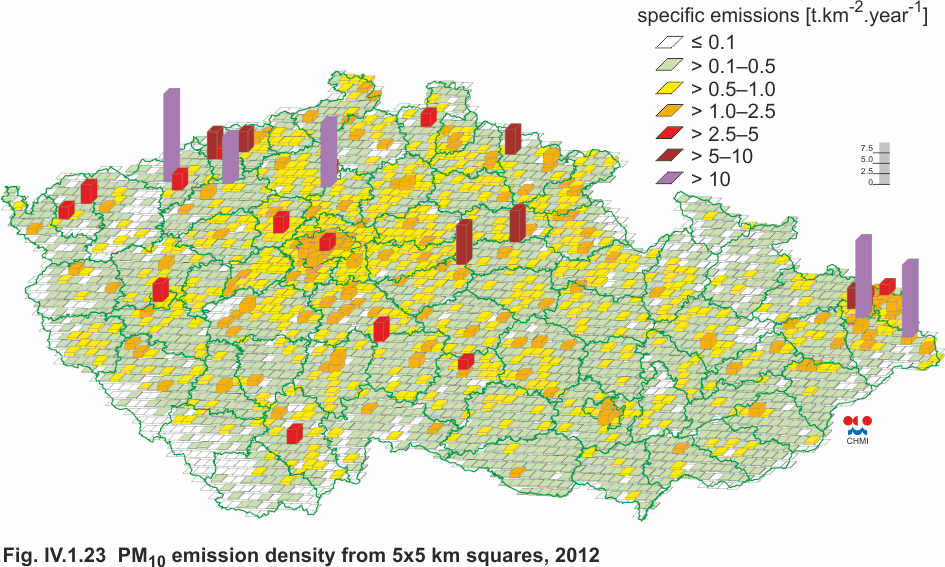
Fig. IV.1.23 |
PM10 emission density from 5x5 km squares, 2012 |
|
Fig. IV.1.24 |
PM2.5 emission density from 5x5 km squares, 2012 |
|
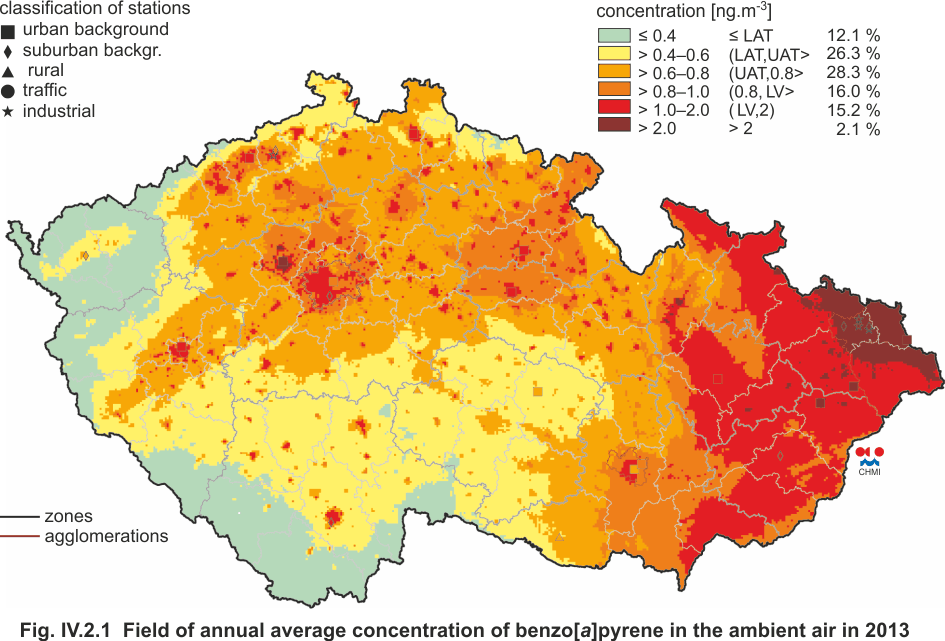
Fig. IV.2.1 |
Field of annual average concentration of benzo[a]pyrene
in the ambient air in 2013 |
|
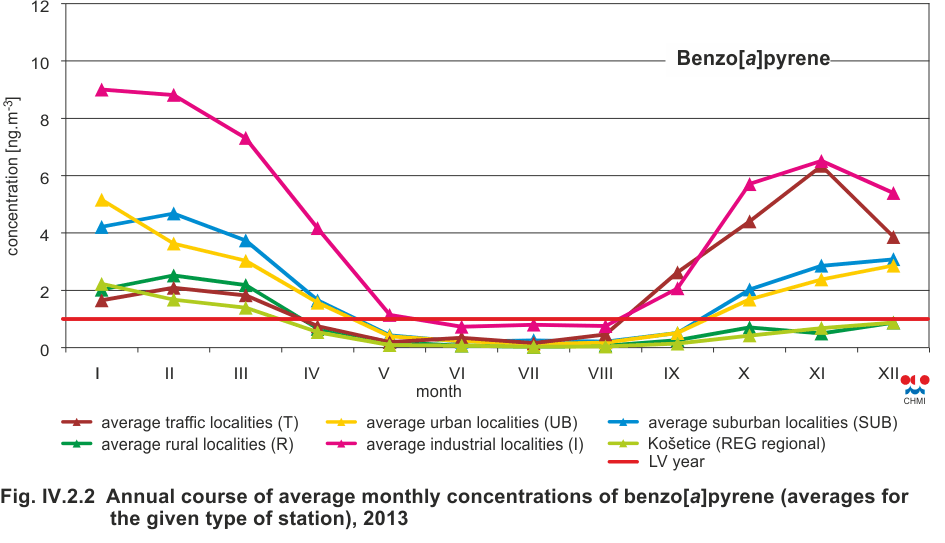
Fig. IV.2.2 |
Annual course of average monthly concentrations of
benzo[a]pyrene (averages for the given type of station),
2013 |
|
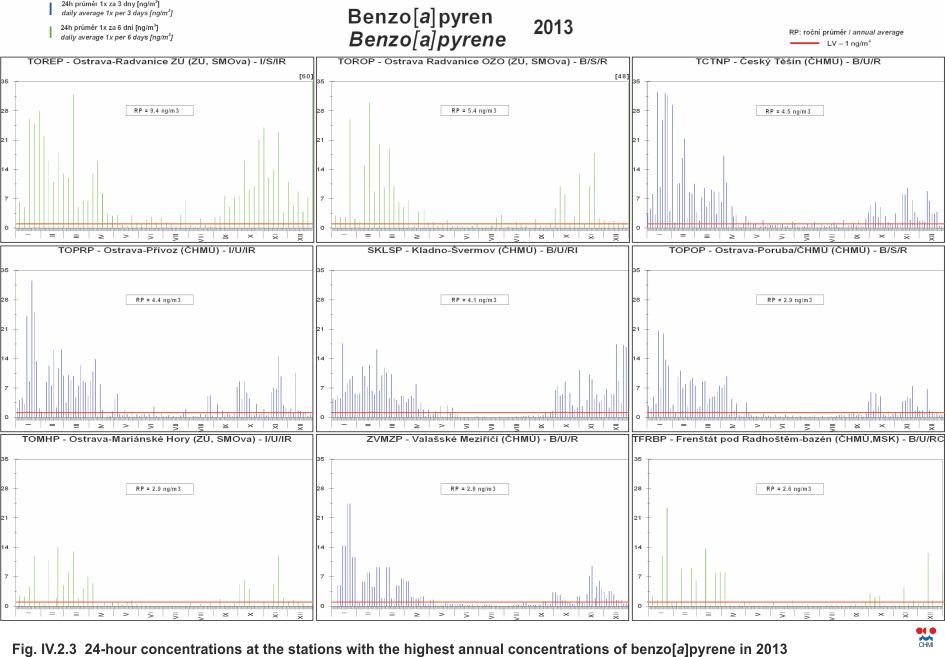
Fig. IV.2.3 |
24-hour concentrations at the stations with the
highest annual concentrations of benzo[a]pyrene in 2013 |
|
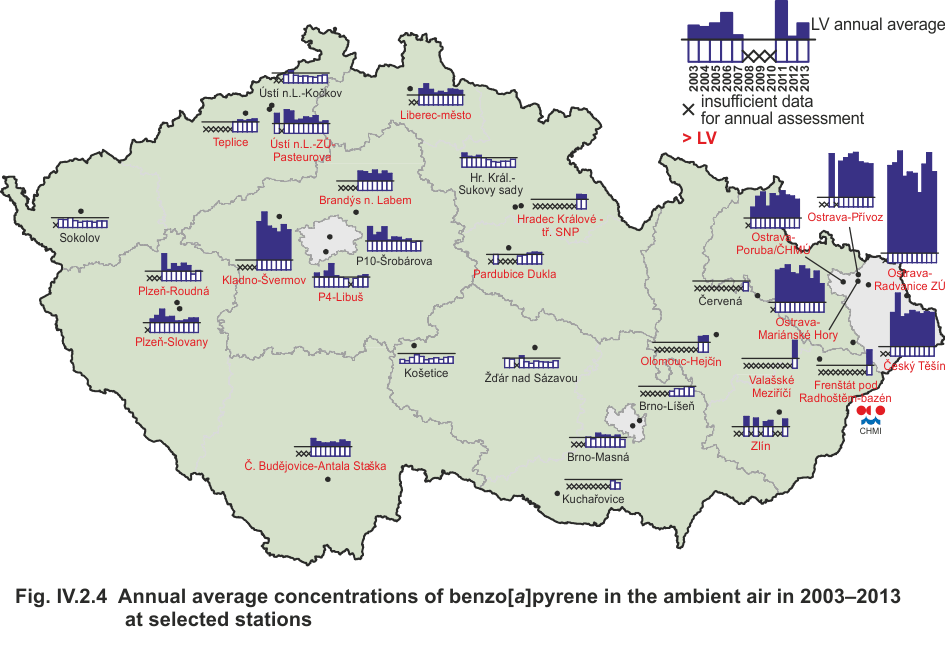
Fig. IV.2.4 |
Annual average concentrations of benzo[a]pyrene in the ambient air in 2002–2013 at selected stations |
|
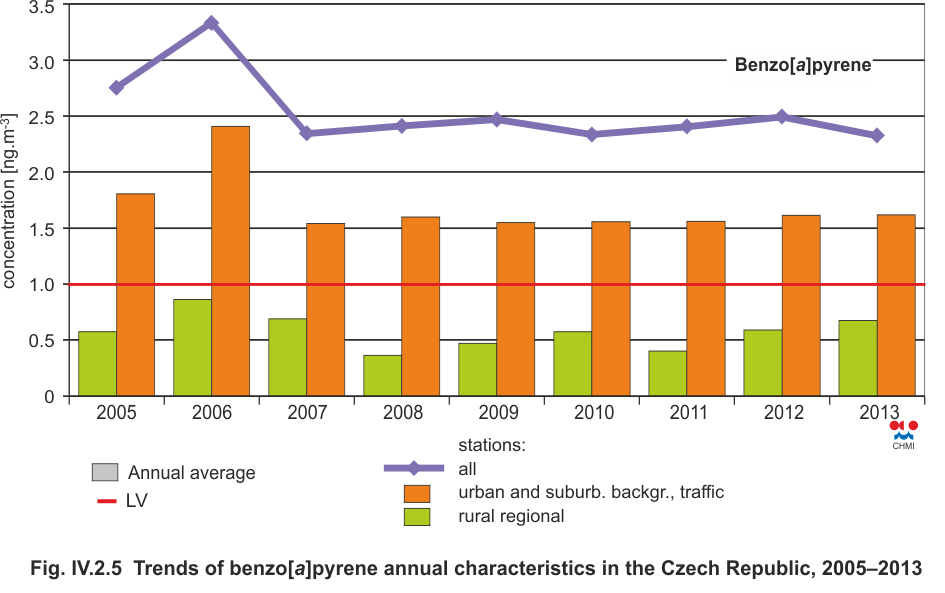
Fig. IV.2.5 |
Trends of benzo[a]pyrene annual characteristics in
the Czech Republic, 1996–2013 |
|
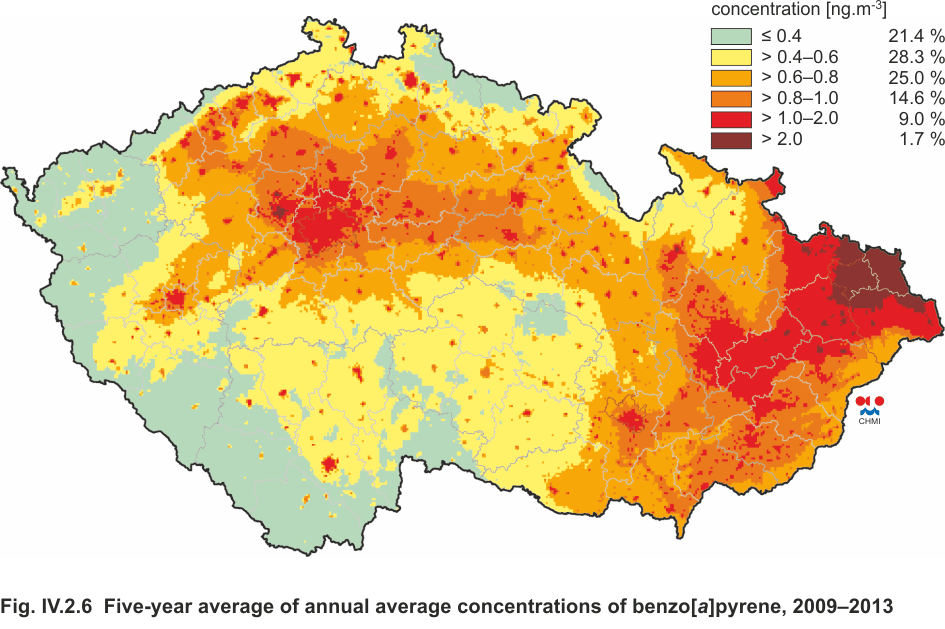
Fig. IV.2.6 |
Five-year average of annual average concentrations
of benzo[a]pyrene, 2009–2013 |
|
Fig. IV.2.7 |
Monthly average concentrations of benzo[a]pyrene in various types of localities, 2004–2013 |
|
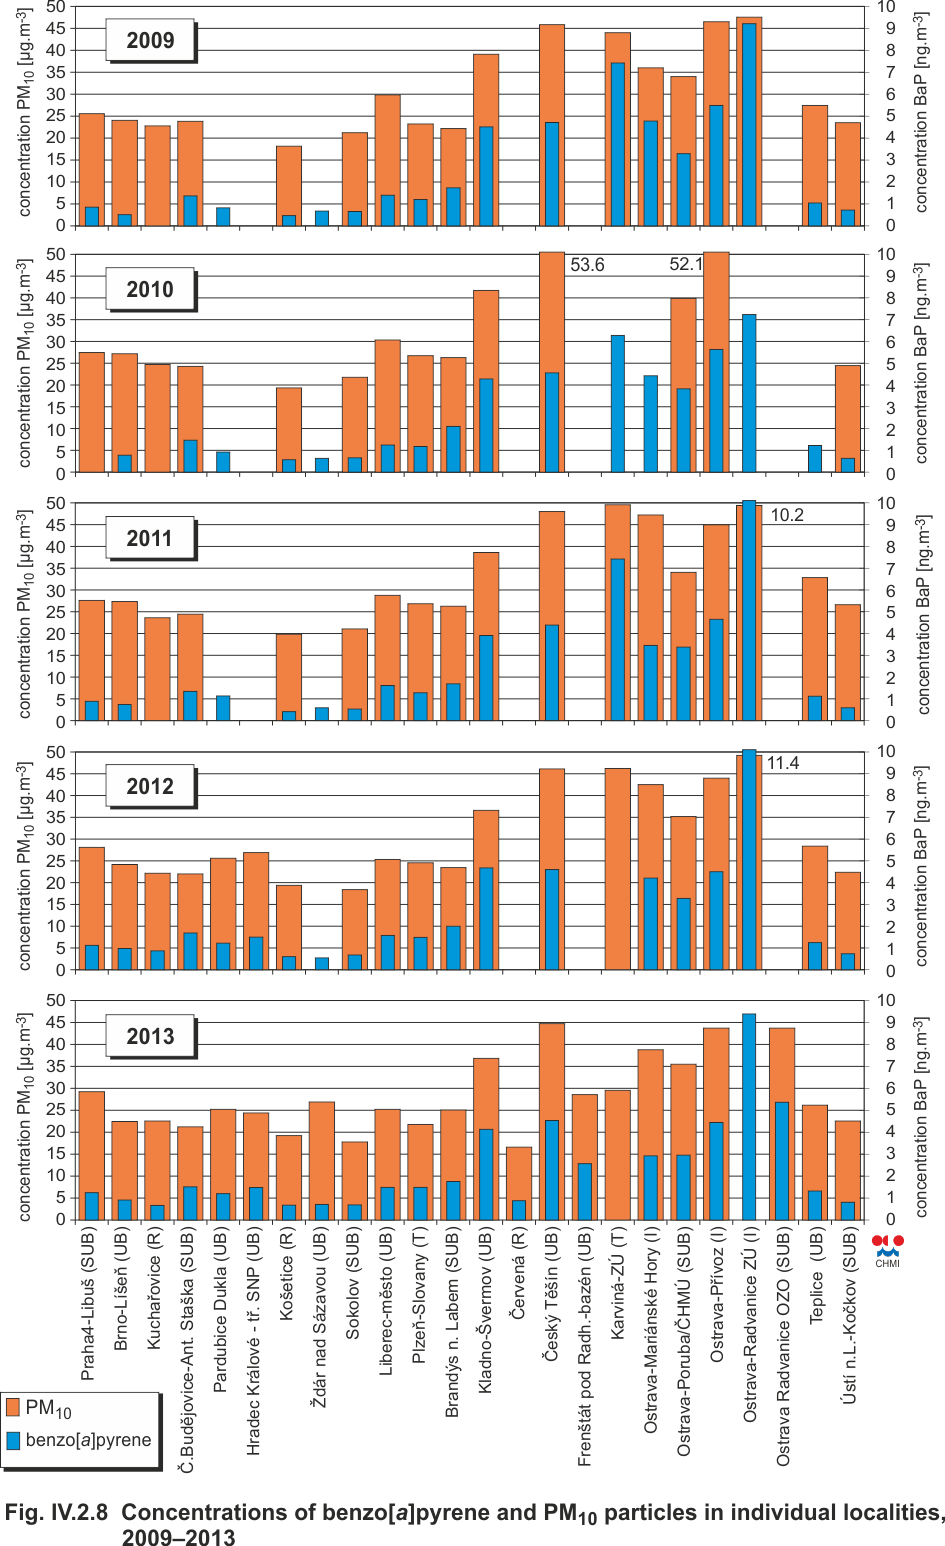
Fig. IV.2.8 |
Concentrations of benzo[a]pyrene and PM10 particles
in individual localities, 2008–2013 |
|
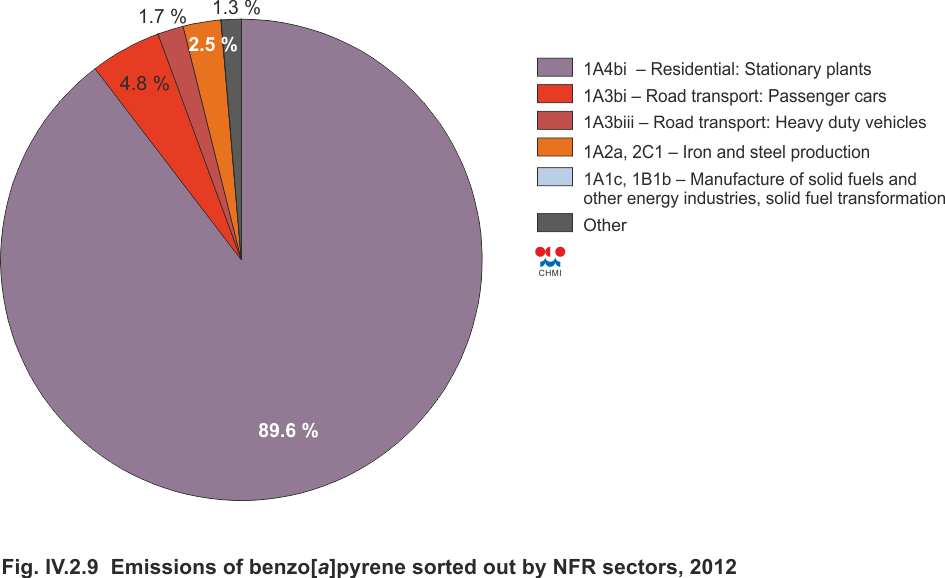
Fig. IV.2.9 |
Emissions of benzo[a]pyrene sorted out by NFR
sectors, 2012 |
|
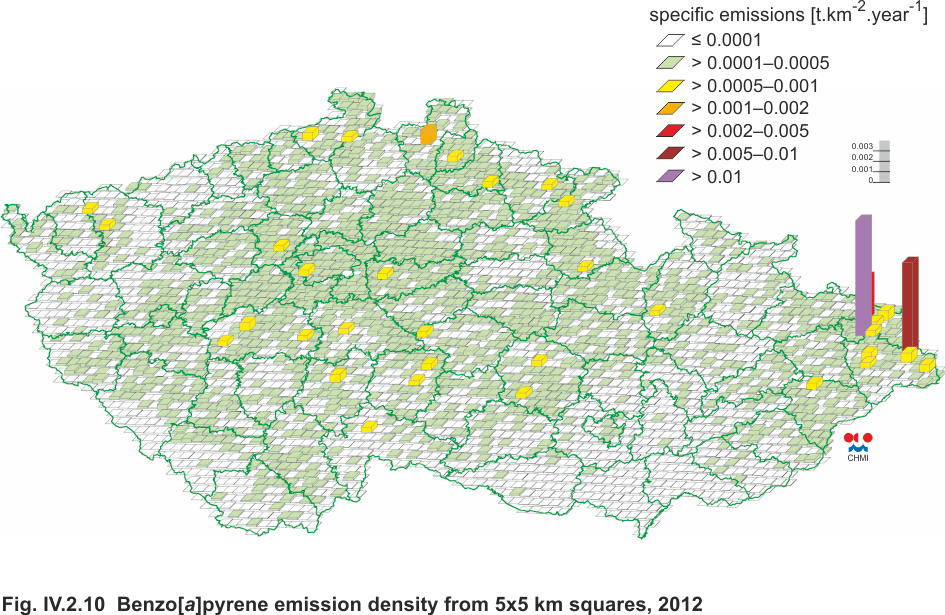
Fig. IV.2.10 |
Benzo[a]pyrene emission density from 5x5 km squares,
2012 |
|
Fig. IV.3.1 |
Field of annual average concentration of NO2 in 2013 |
|
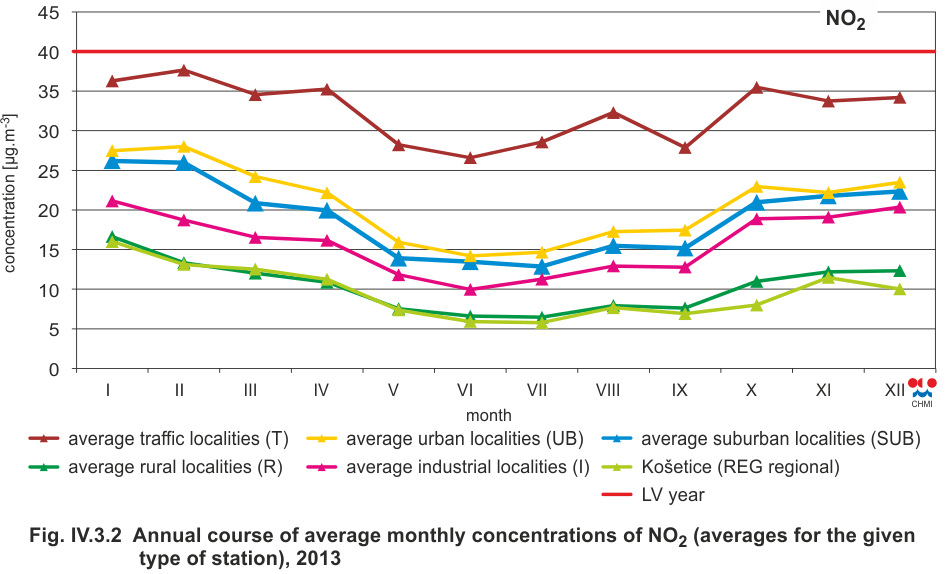
Fig. IV.3.2 |
Annual course of average monthly concentrations of
NO2 (averages for the given type of station), 2013 |
|
Fig. IV.3.3 |
Stations with the highest hourly concentrations of
NO2 in 2013 |
|
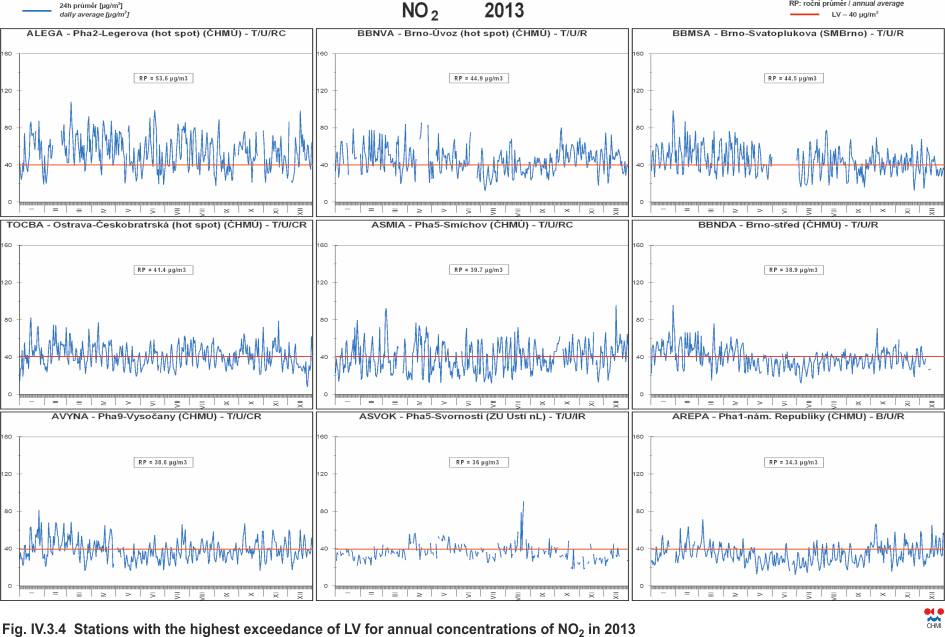
Fig. IV.3.4 |
Stations with the highest exceedance of LV for
annual concentrations of NO2 in 2013 |
|
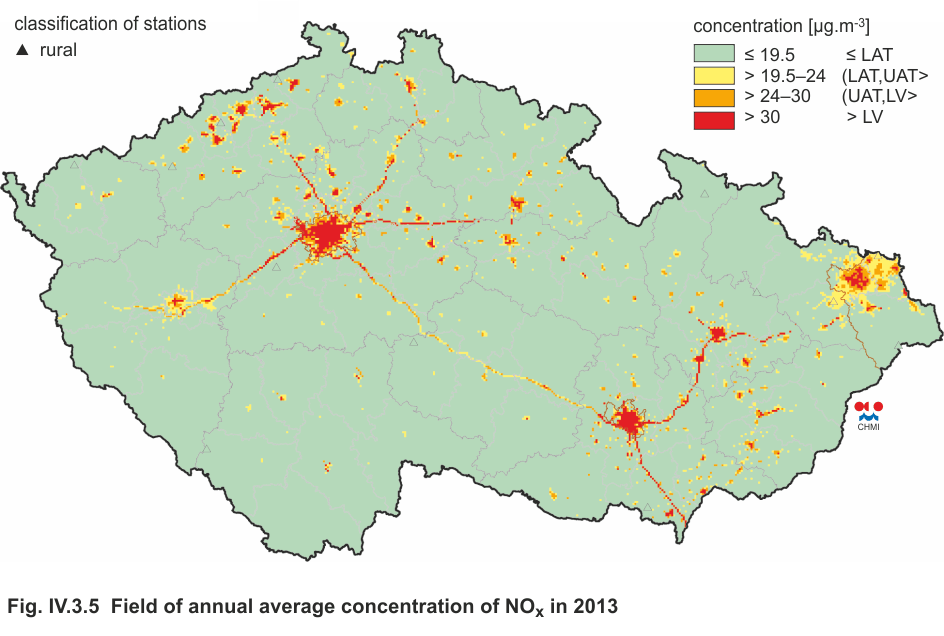
Fig. IV.3.5 |
Field of annual average concentration of NOx in 2013 |
|
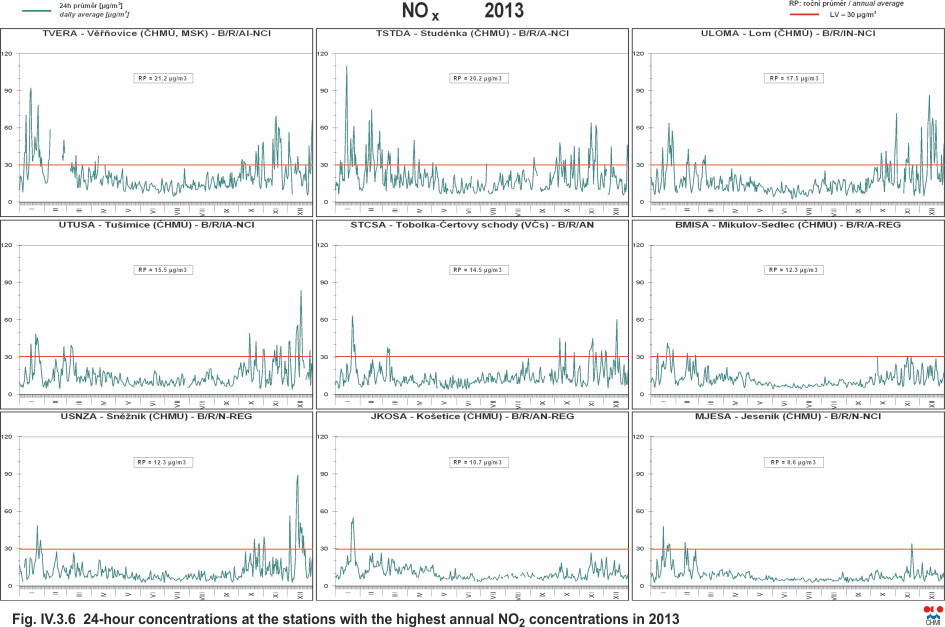
Fig. IV.3.6 |
24-hour concentrations at the stations with the
highest annual concentrations of NOx in 2013 |
|
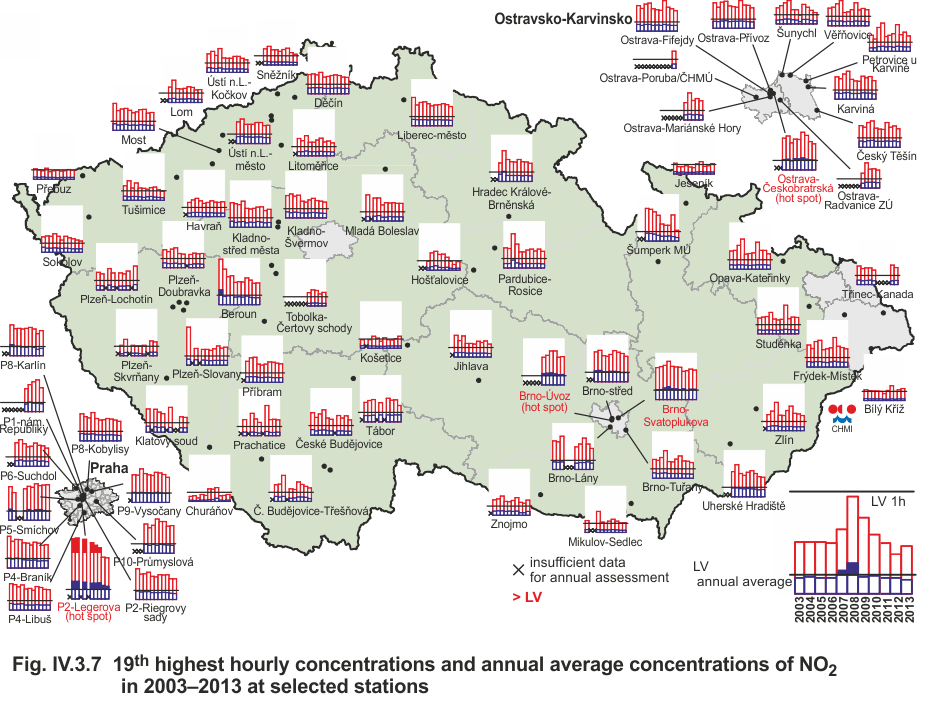
Fig. IV.3.7 |
19th highest hourly concentrations and annual
average concentrations of NO2 in 2003–2013 at selected
stations |
|
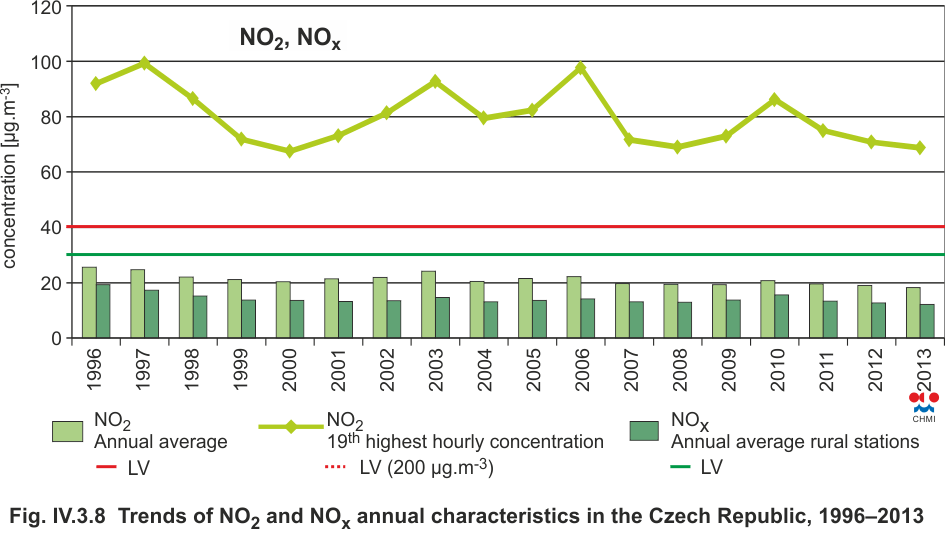
Fig. IV.3.8 |
Trends of NO2 and NOx annual characteristics in the
Czech Republic, 1996–2013 |
|
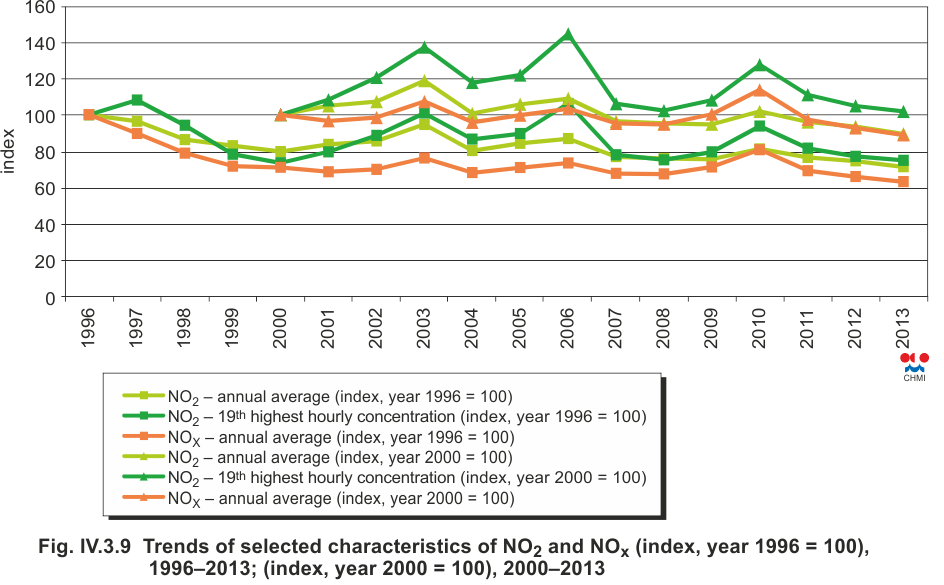
Fig. IV.3.9 |
Trends of selected characteristics of NO2 a NOx
(index, year 1996 = 100), 1996–2013; (index, year 2000 =
100), 2000–2013 |
|
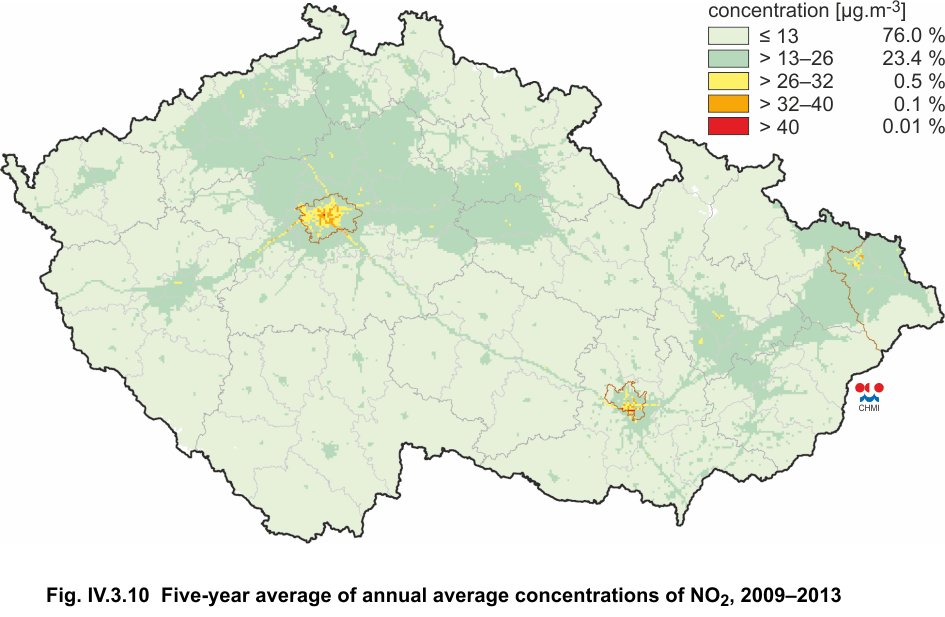
Fig. IV.3.10 |
Five-year average of annual average concentrations
of NO2, 2009–2013 |
|
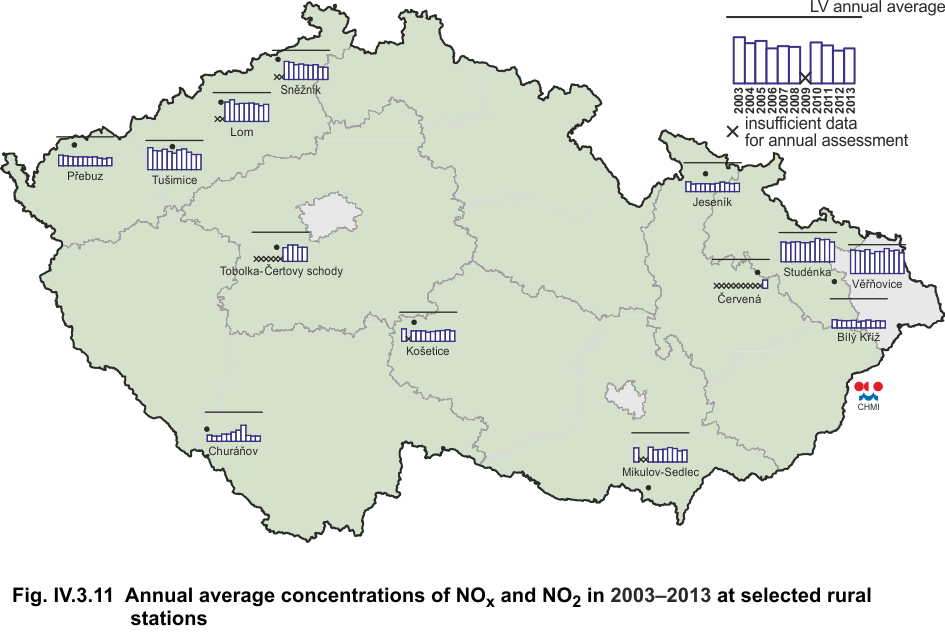
Fig. IV.3.11 |
Annual average concentrations of NOx and NO2 in
2003–2013 at selected rural stations |
|
Fig. IV.3.12 |
Emissions of NOx sorted out by NFR sectors, 2012 |
|
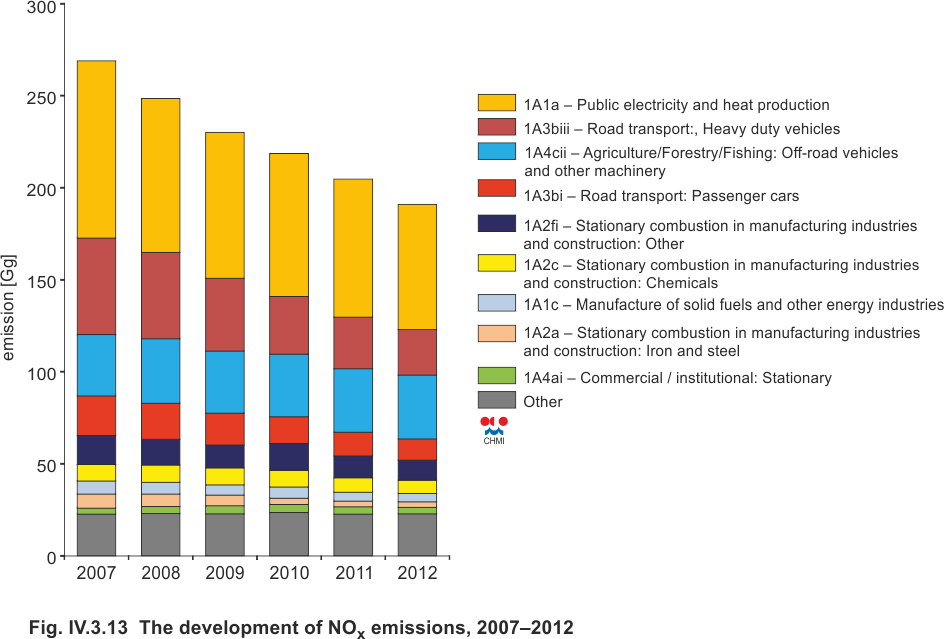
Fig. IV.3.13 |
The development of NOx emissions, 2007–2012 |
|
Fig. IV.3.14 |
Nitrogen oxides emission density from 5x5 km squares,
2012 |
|
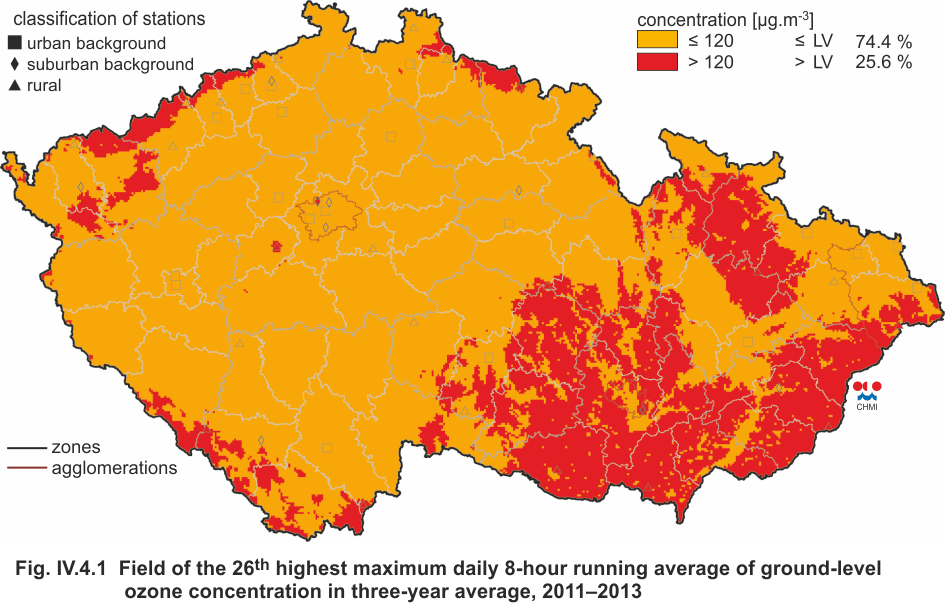
Fig. IV.4.1 |
Field of the 26th highest maximum daily 8-hour
running average of ground-level ozone concentrations in
three-year average, 2011–2013 |
|
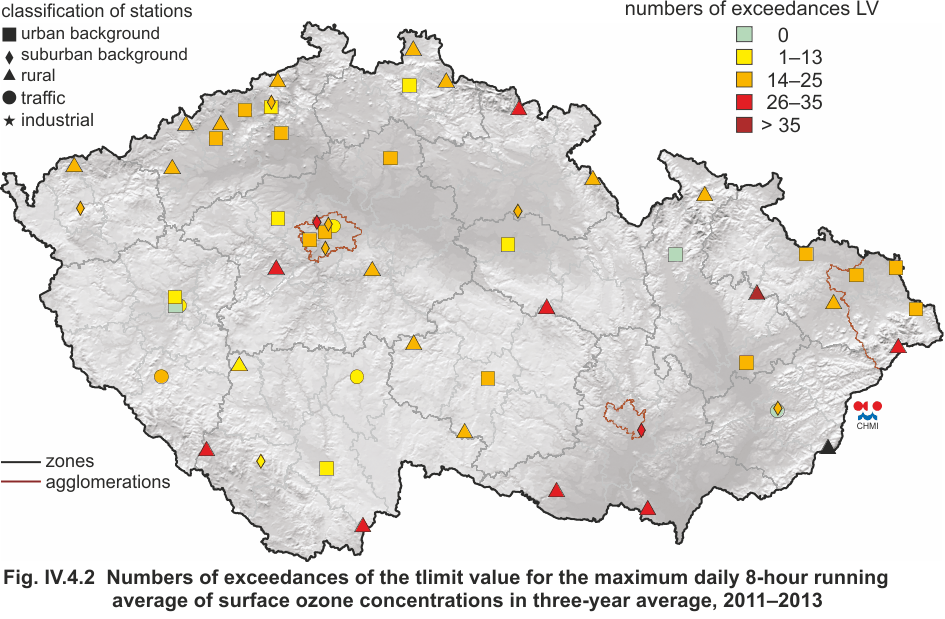
Fig. IV.4.2 |
Numbers of exceedances of the target value for the
maximum daily 8-hour running average of ground-level
ozone concentrations in three-year average, 2011–2013 |
|
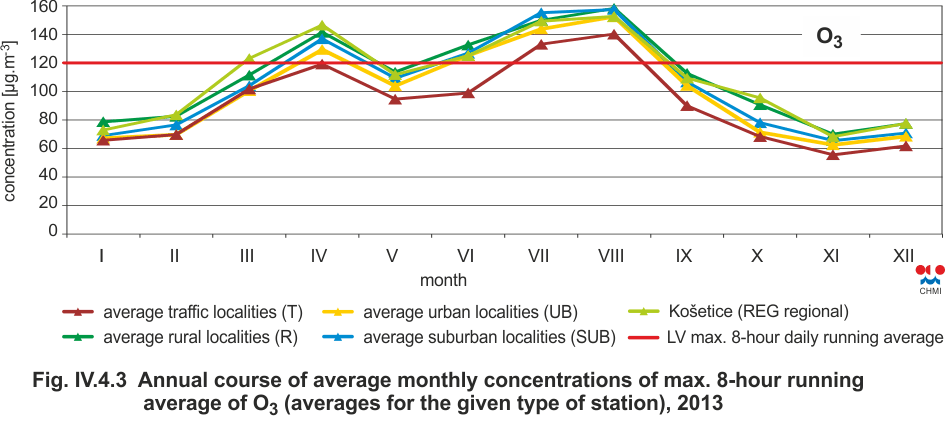
Fig. IV.4.3 |
Annual course of average max. 8-hour running average
of O3 (averages for the given type of station), 2013 |
|
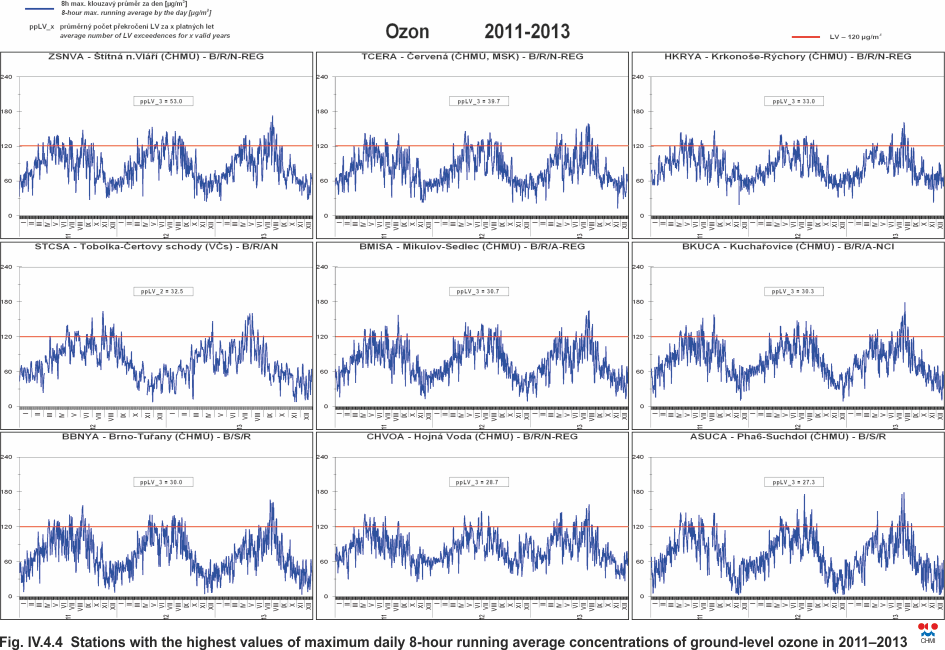
Fig. IV.4.4 |
Stations with the highest values of maximum daily 8-hour
running average concentrations of ground-level ozone in
2011–2013 |
|
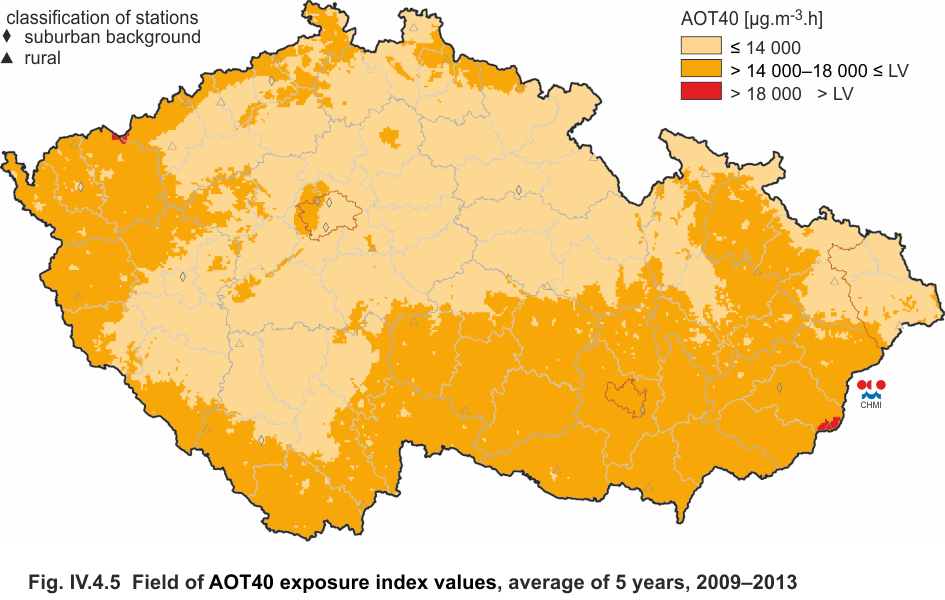
Fig. IV.4.5 |
Field of exposure index AOT40 values, average for 5
years, 2009–2013 |
|
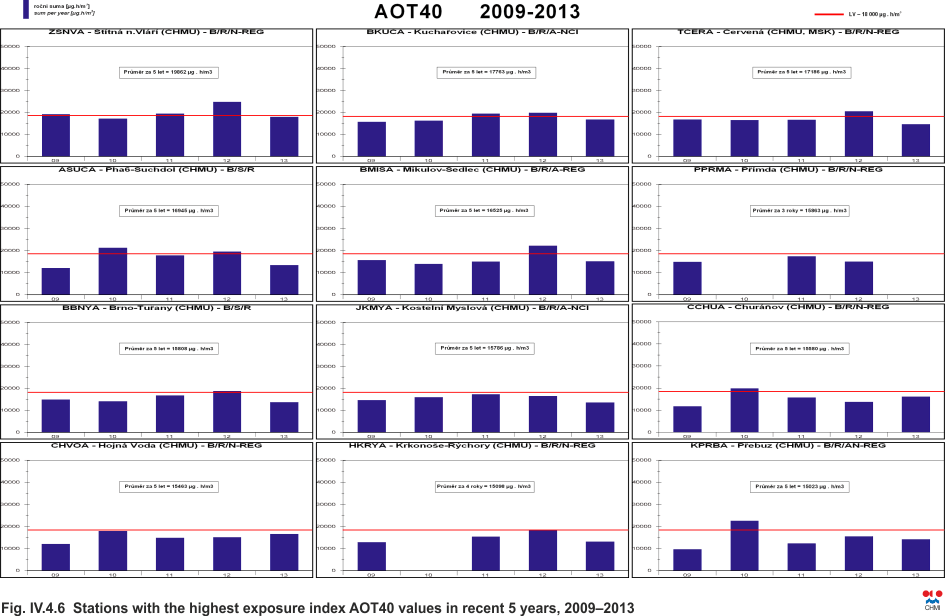
Fig. IV.4.6 |
Stations with the highest exposure index AOT40
values in recent 5 years, 2009–2013 |
|
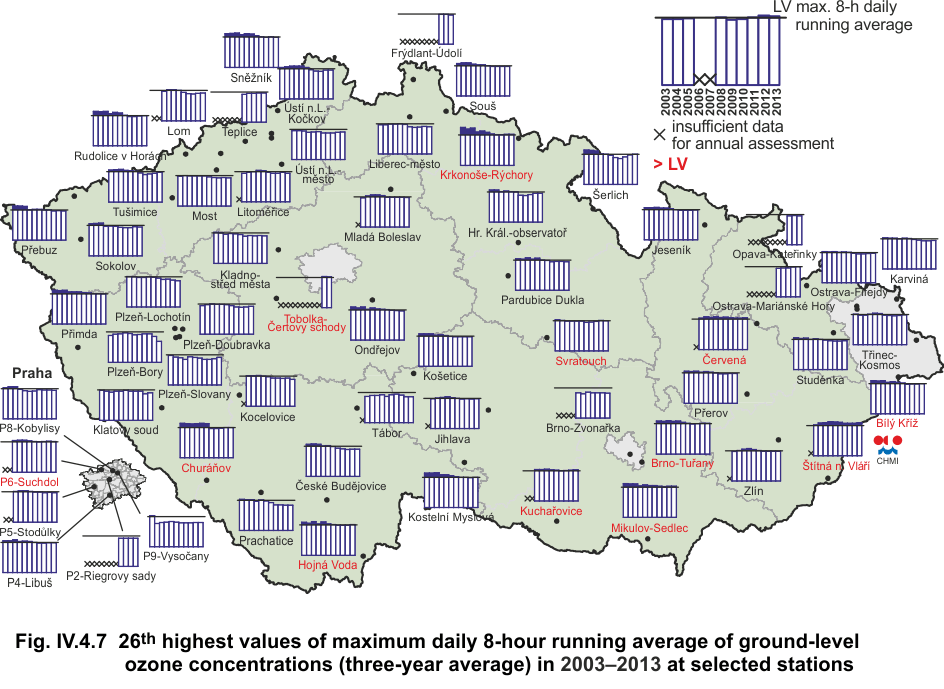
Fig. IV.4.7 |
26th highest values of maximum daily 8-hour running
average of ground-level ozone concentrations (three-year
average) in 2003–2013 at selected stations |
|
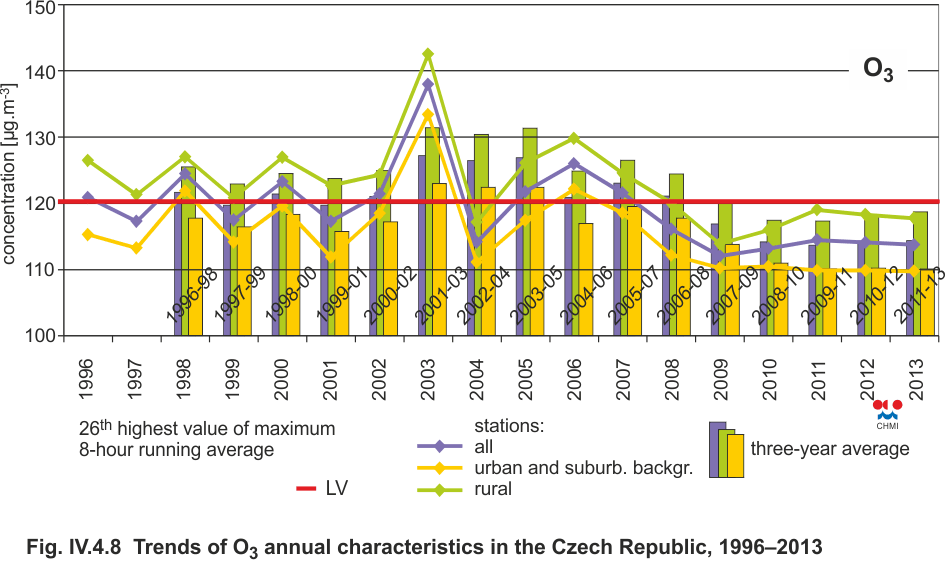
Fig. IV.4.8 |
Trends of O3 annual characteristics in the Czech
Republic, 1996–2013 |
|
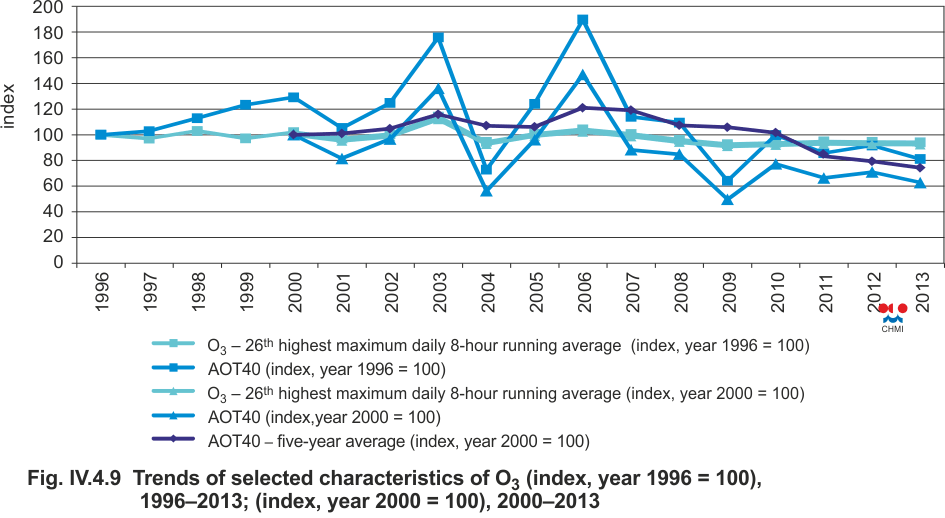
Fig. IV.4.9 |
Trends of selected characteristics of O3 (index,
year 1996 = 100), 1996–2012; (index, year 2000 = 100),
2000–2013 |
|
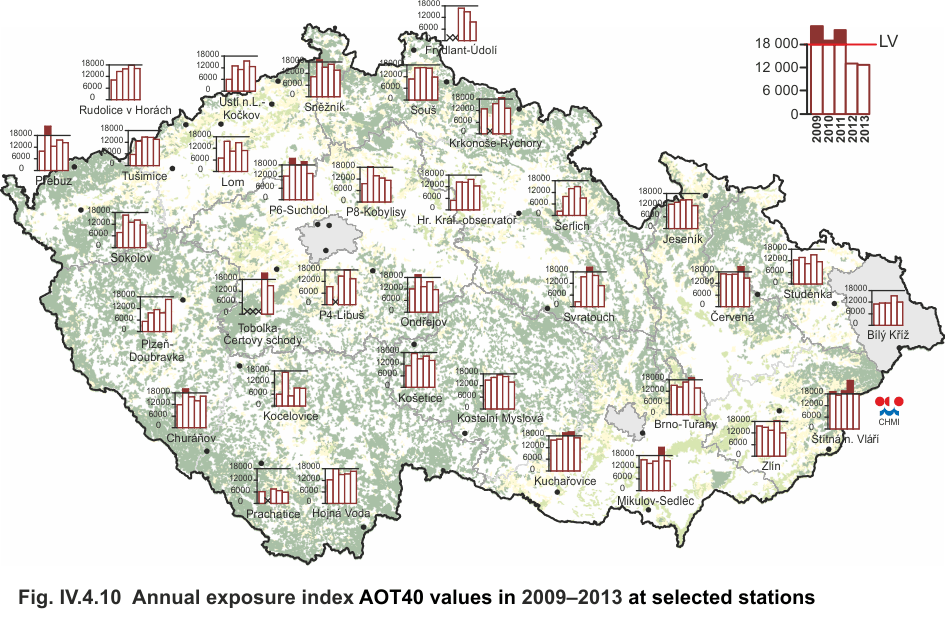
Fig. IV.4.10 |
Ozone exposure index AOT40 values in 2003–2013 at
selected stations, average for 5 years |
|
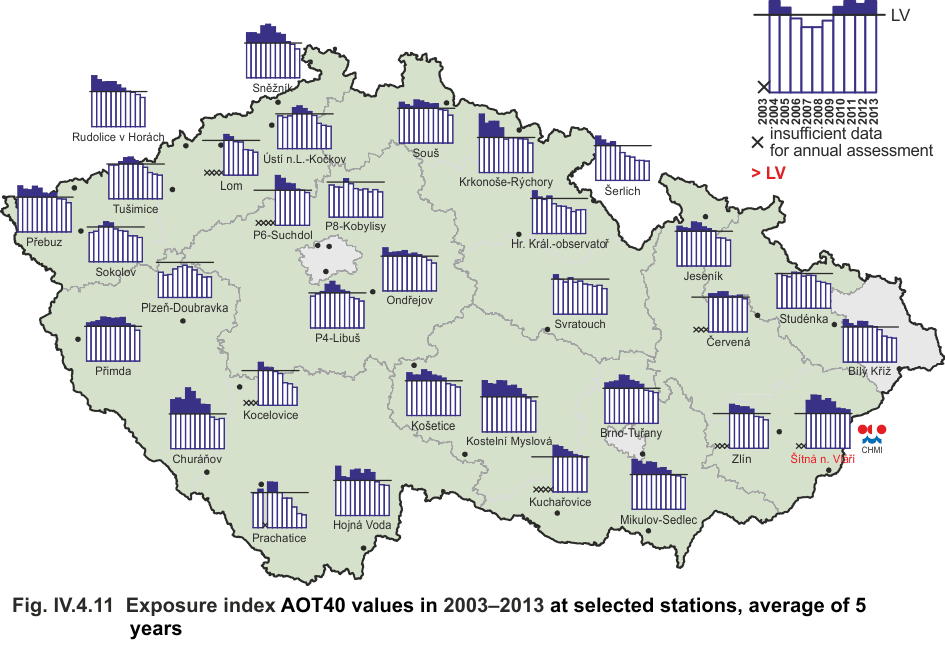
Fig. IV.4.11 |
Annual values of ozone exposure index AOT40 in
2009–2013 at selected stations |
|
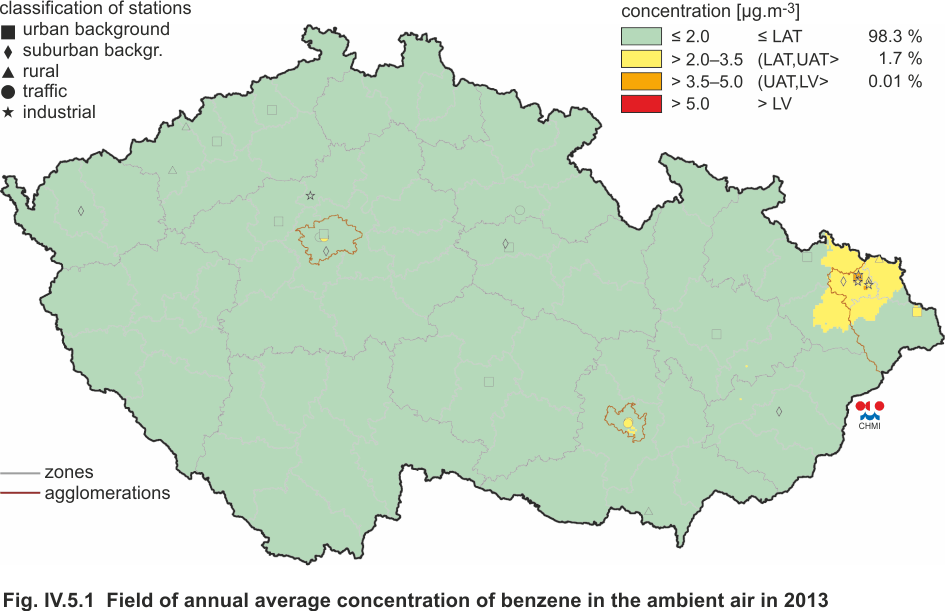
Fig. IV.5.1 |
Field of annual average concentration of benzene in
the ambient air in 2013 |
|
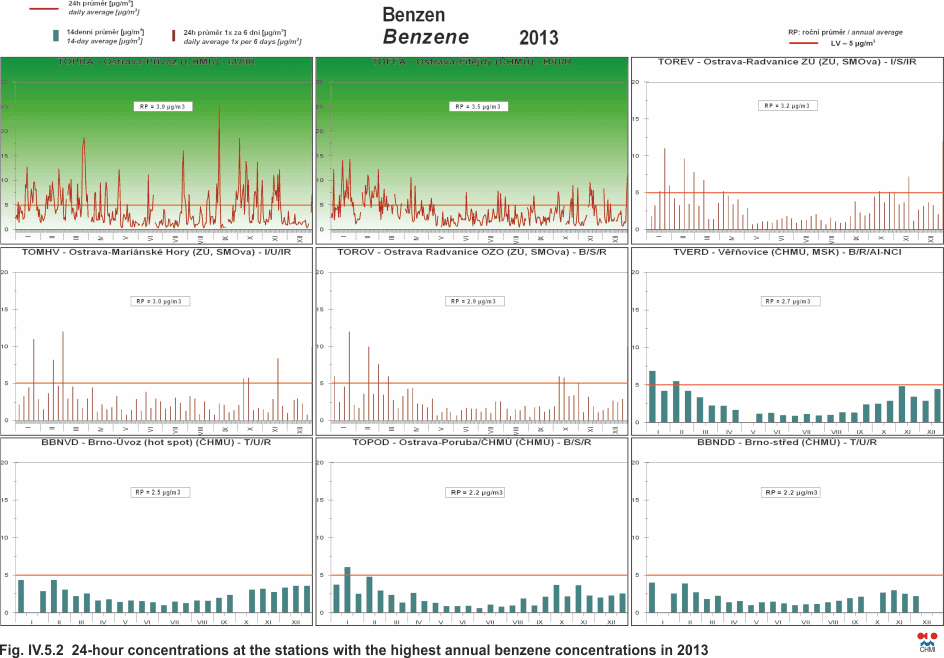
Fig. IV.5.2 |
24-hour concentrations at the stations with the
highest annual benzene concentrations in 2013 |
|
Fig. IV.5.3 |
Annual average concentrations of benzene in
2003–2013 at selected stations |
|
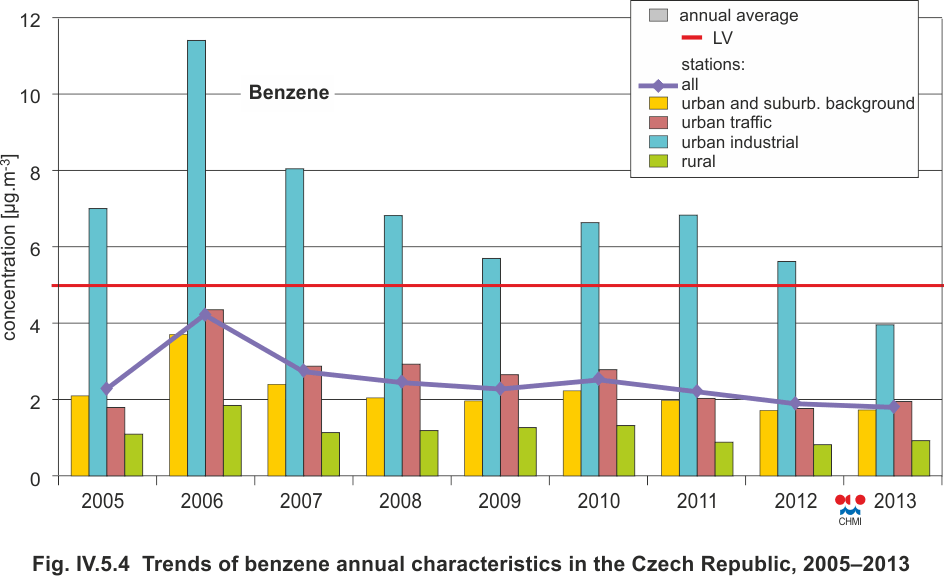
Fig. IV.5.4 |
Trends of benzene annual characteristics in the
Czech Republic, 2005–2013 |
|
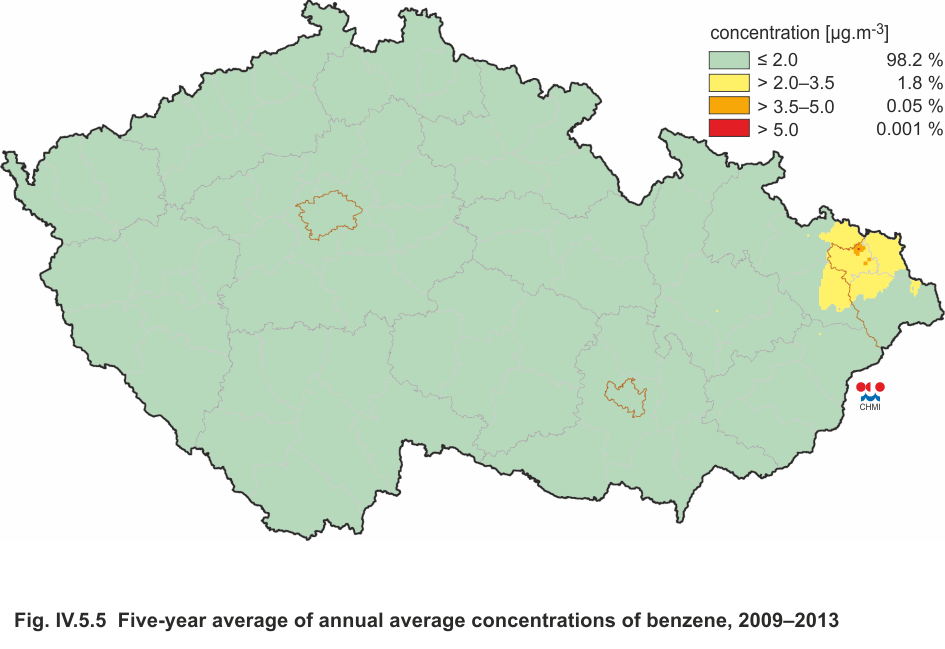
Fig. IV.5.5 |
Five-year average of annual average concentrations
of benzene, 2009–2013 |
|
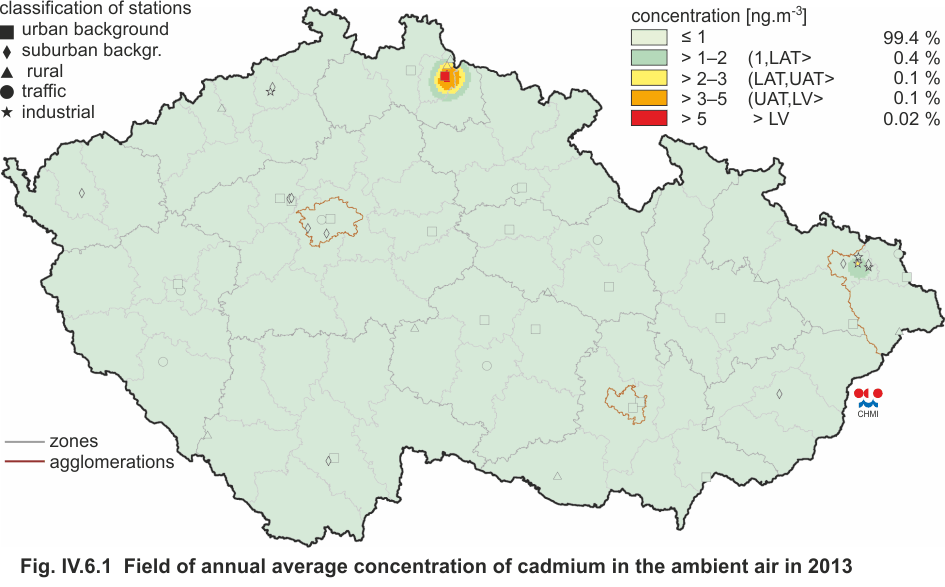
Fig. IV.6.1 |
Field of annual average concentration of cadmium in
the ambient air in2013 |
|
Fig. IV.6.2 |
Field of annual average concentration of arsenic in
the ambient air in 2013 |
|
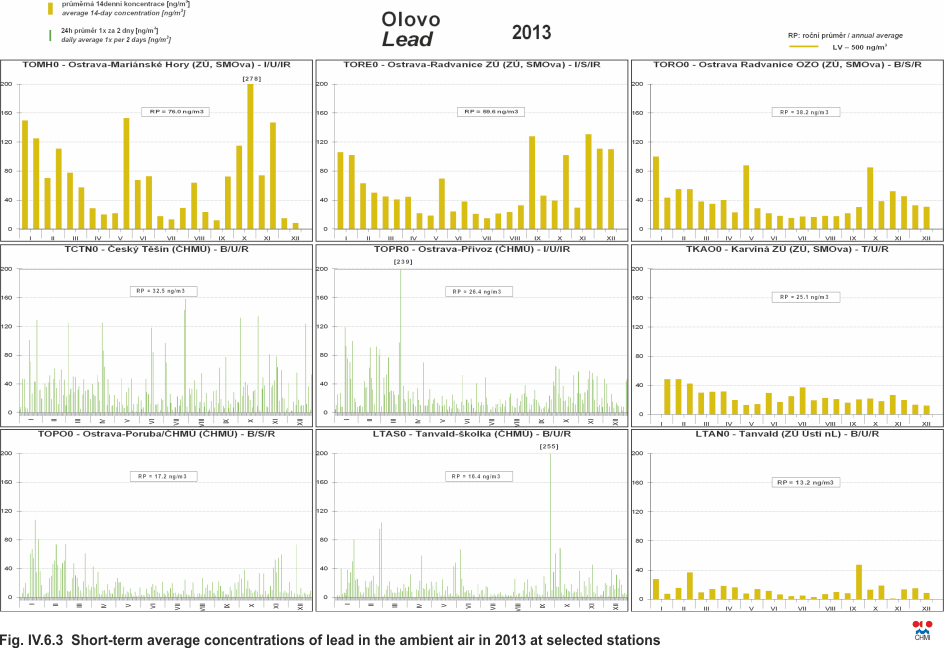
Fig. IV.6.3 |
Short-term average concentrations of lead in the
ambient air in 2013 at selected stations |
|
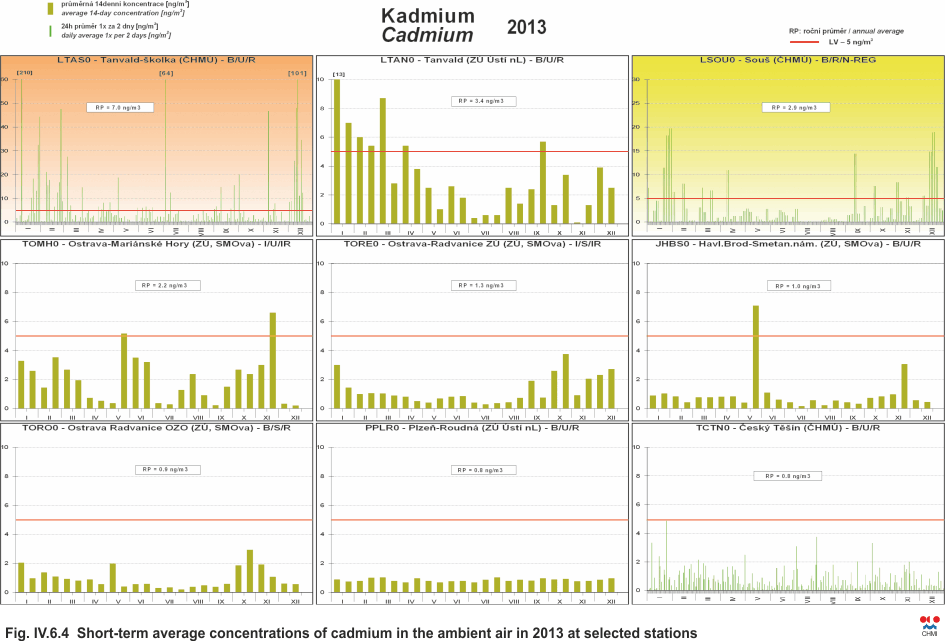
Fig. IV.6.4 |
Short-term average concentrations of cadmium in the
ambient air in 2013 at selected stations |
|
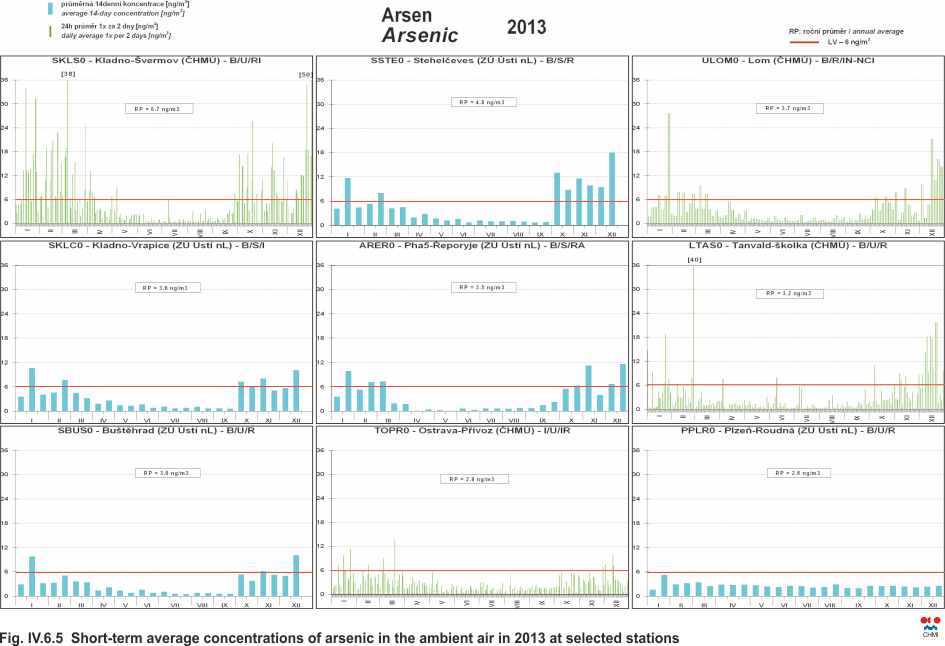
Fig. IV.6.5 |
Short-term average concentrations of arsenic in the
ambient air in 2013 at selected stations |
|
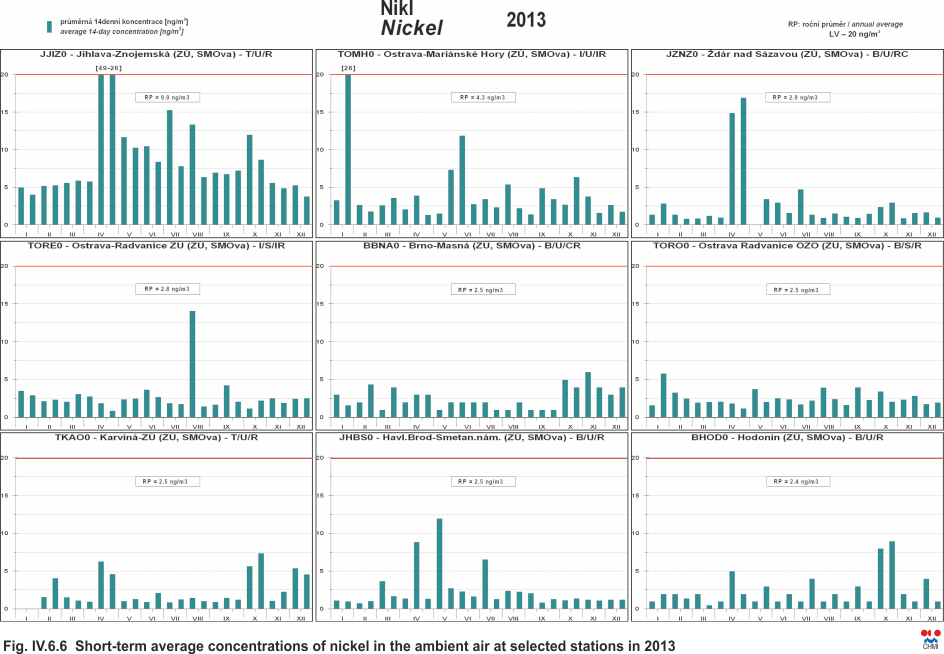
Fig. IV.6.6 |
Short-term average concentrations of nickel in the
ambient air in 2013 at selected stations |
|
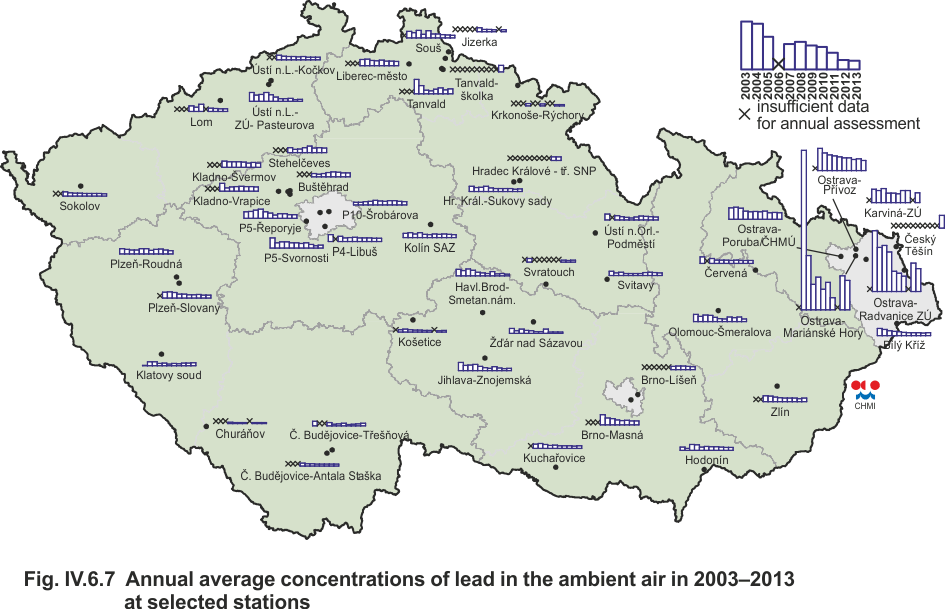
Fig. IV.6.7 |
Annual average concentrations of lead in the ambient
air in 2003–2013 at selected stations |
|
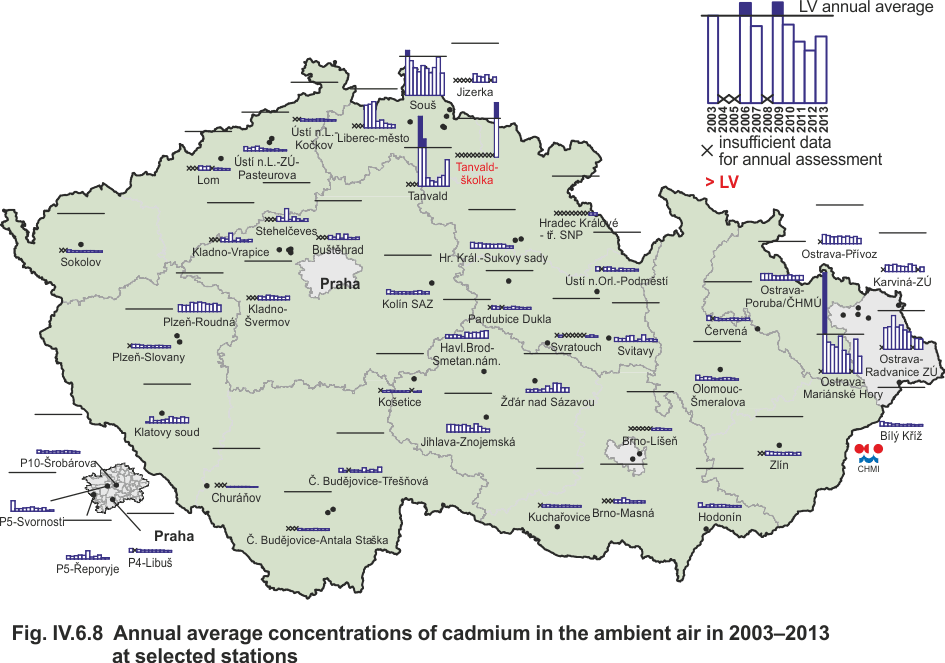
Fig. IV.6.8 |
Annual average concentrations of cadmium in the
ambient air in 2003–2013 at selected stations |
|
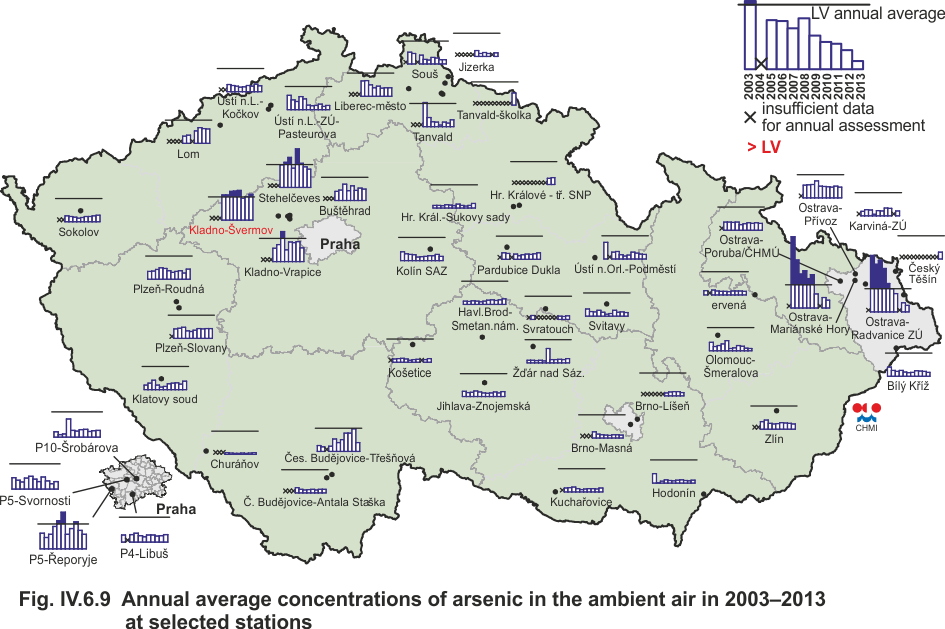
Fig. IV.6.9 |
Annual average concentrations of arsenic in the
ambient air in 2003–2013 at selected stations |
|
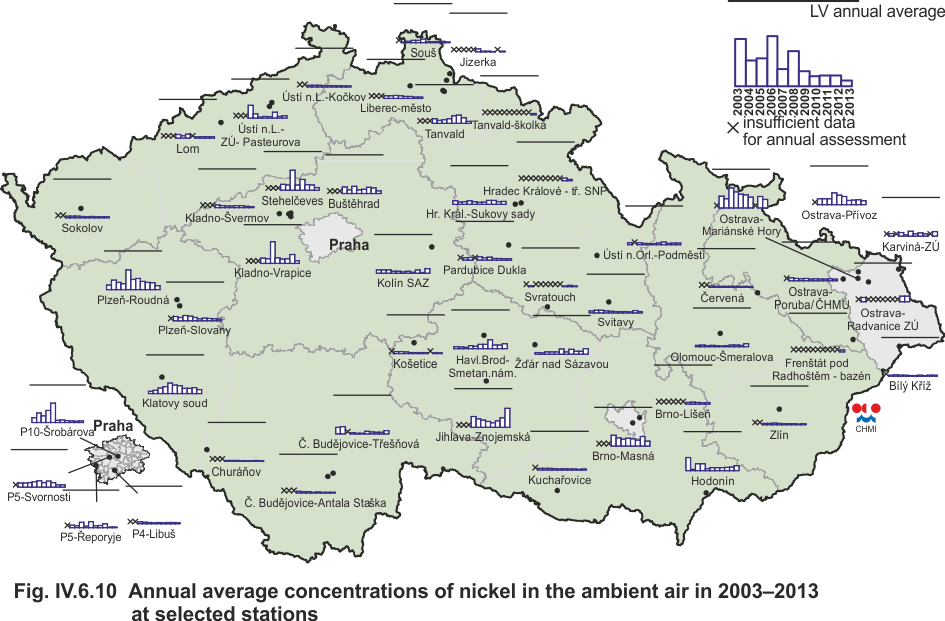
Fig. IV.6.10 |
Annual average concentrations of nickel in the
ambient air in 2003–2013 at selected stations |
|
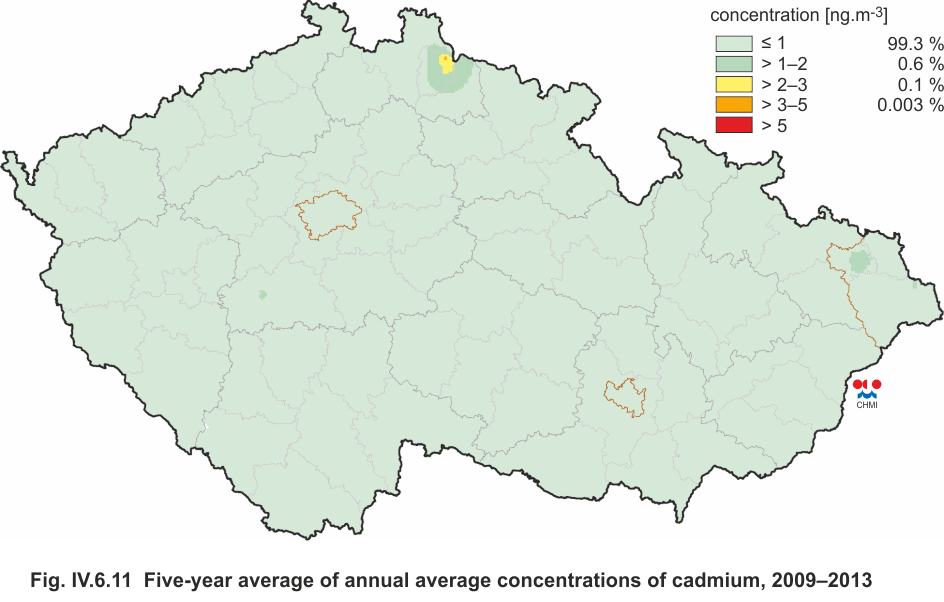
Fig. IV.6.11 |
Five-year average of annual average concentrations
of cadmium, 2009–2013 |
|
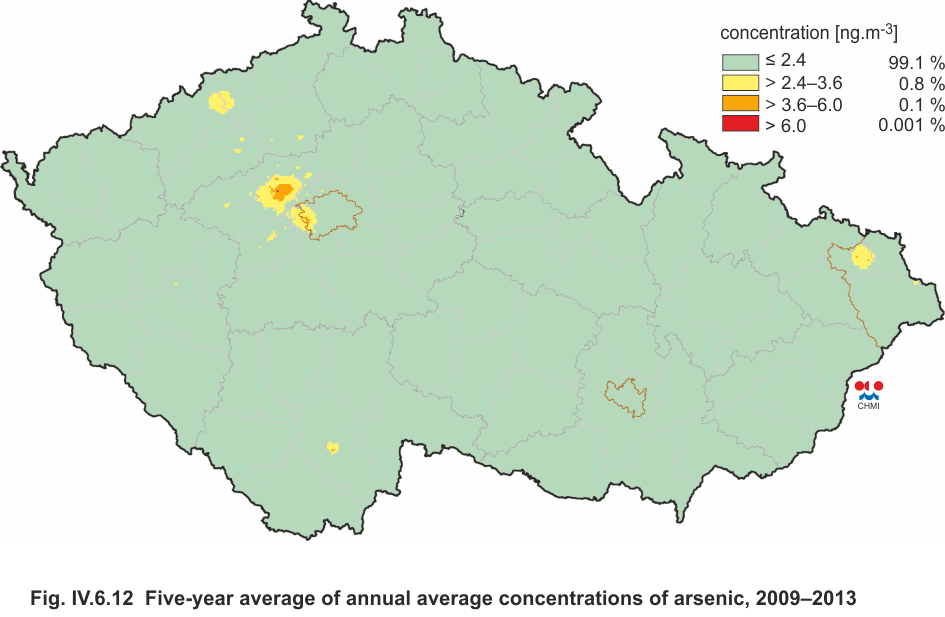
Fig. IV.6.12 |
Five-year average of annual average concentrations
of arsenic, 2009–2013 |
|
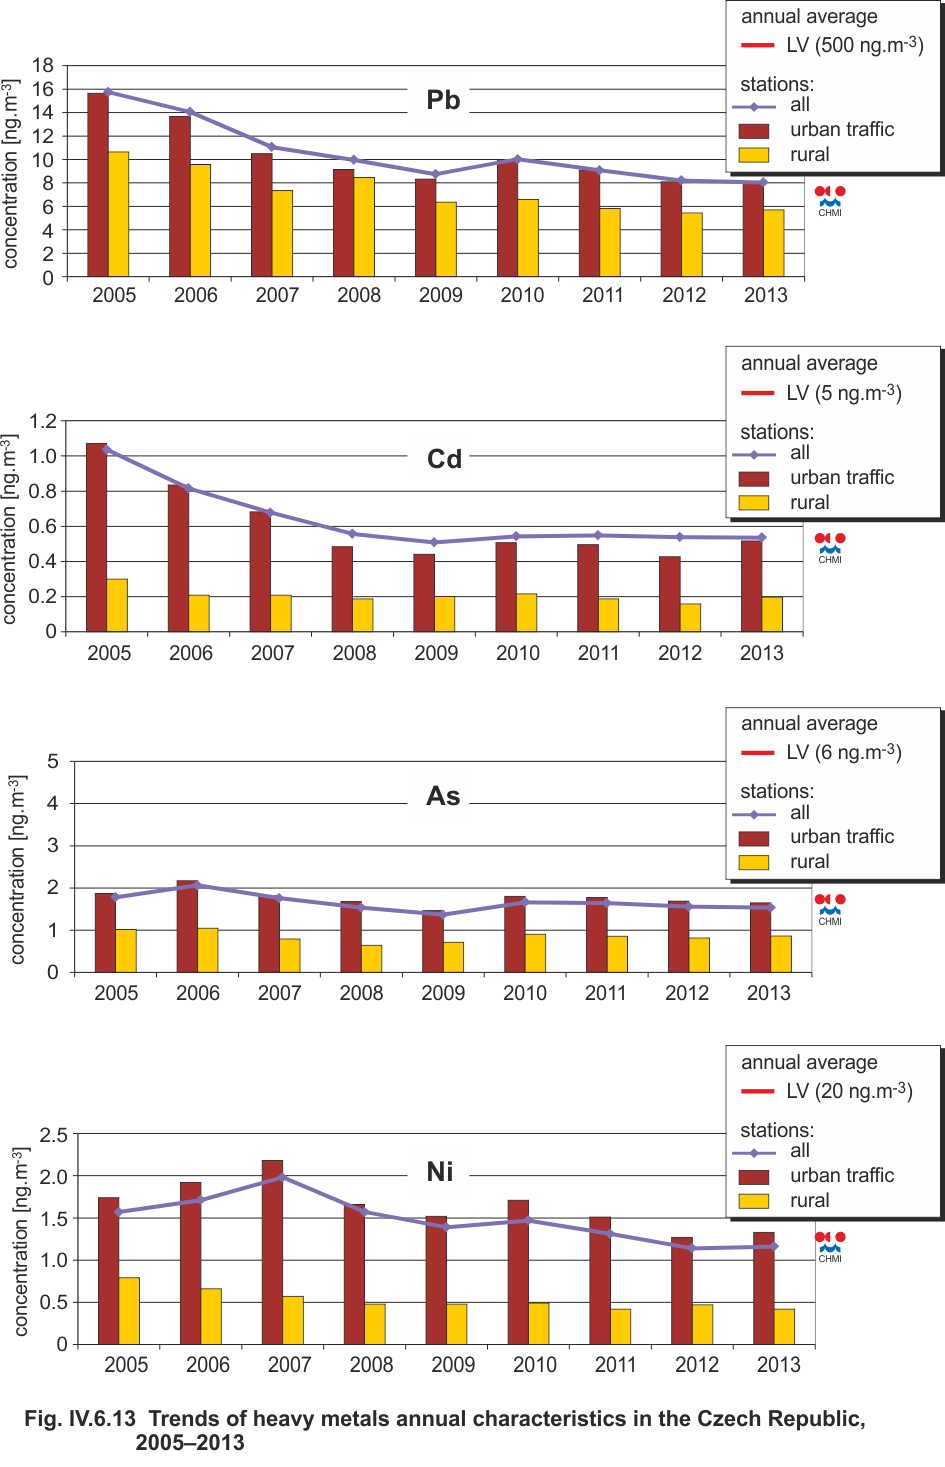
Fig. IV.6.13 |
Trends of heavy metals annual characteristics in the
Czech Republic, 2005–2013 |
|
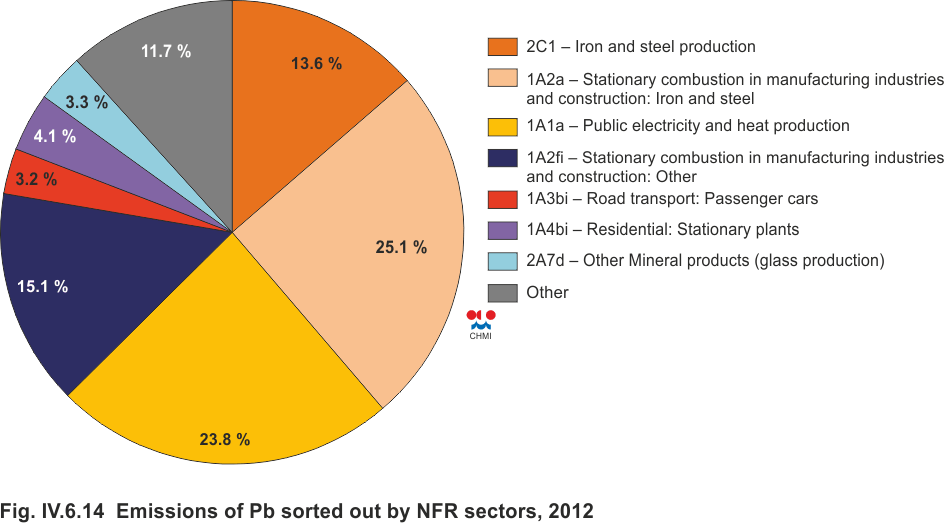
Fig. IV.6.14 |
Emissions of Pb sorted out by NFR sectors, 2012 |
|
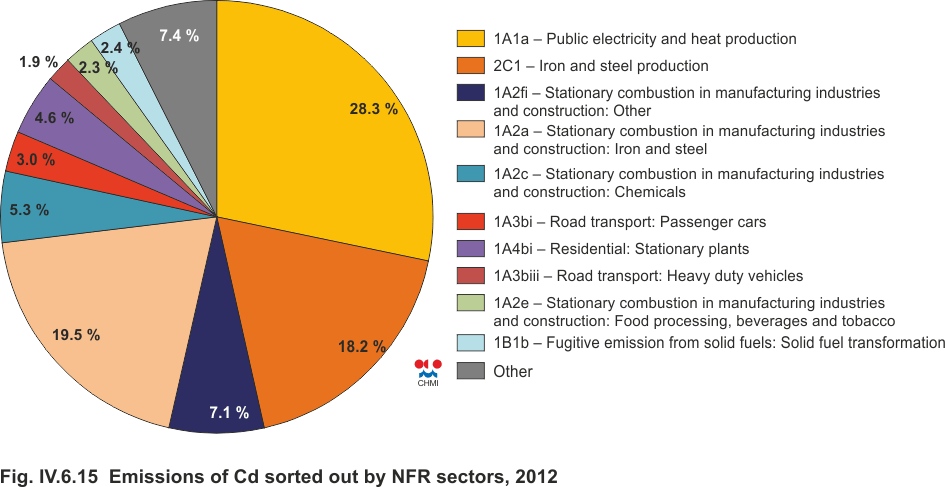
Fig. IV.6.15 |
Emissions of Cd sorted out by NFR sectors, 2012 |
|
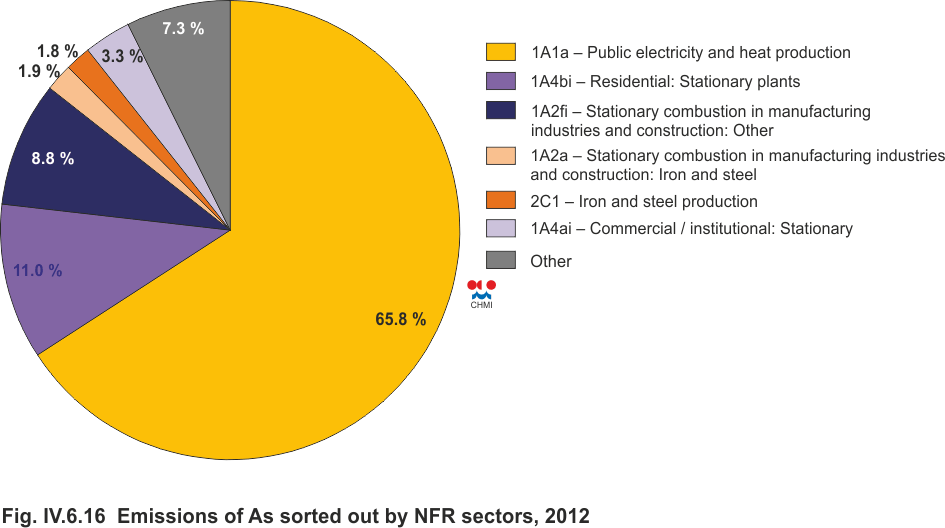
Fig. IV.6.16 |
Emissions of As sorted out by NFR sectors, 2012 |
|
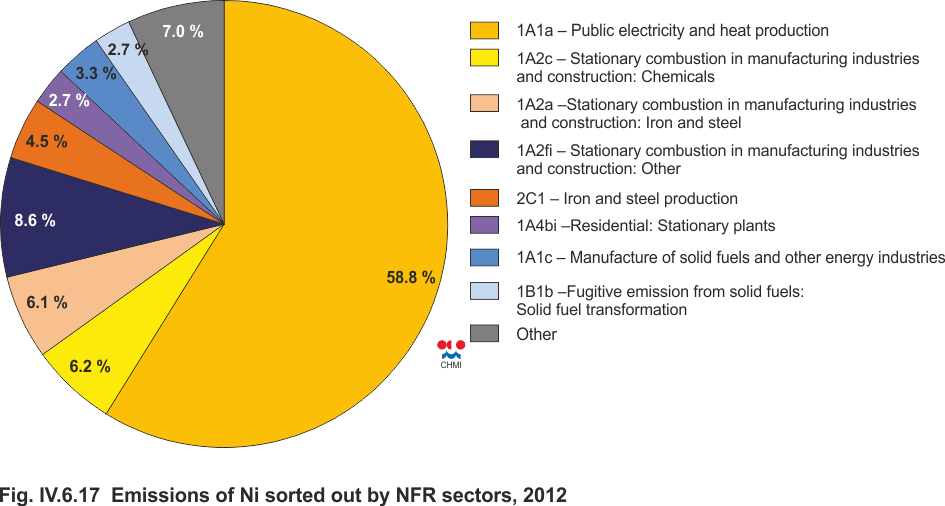
Fig. IV.6.17 |
Emissions of Ni sorted out by NFR sectors, 2012 |
|
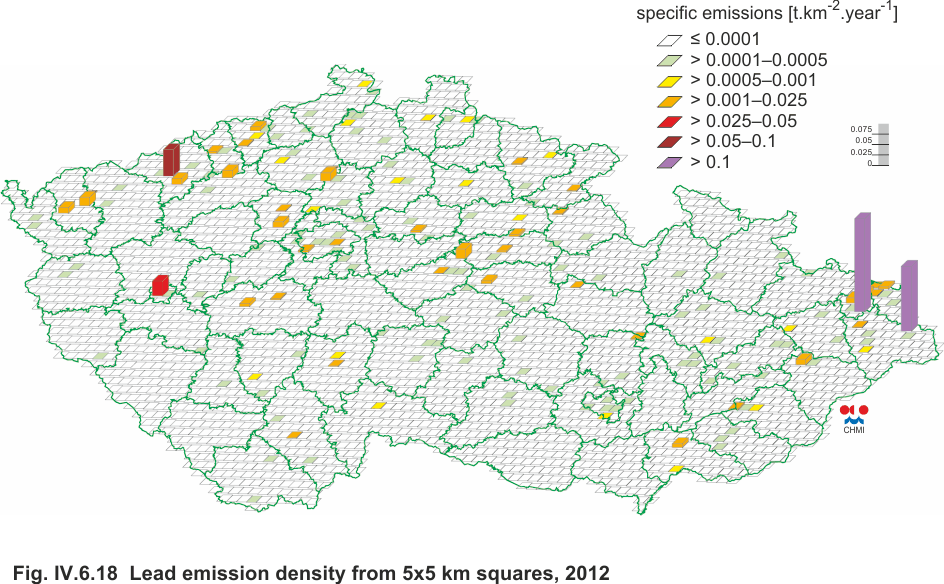
Fig. IV.6.18 |
Pb emission density from 5x5 km squares, 2012 |
|
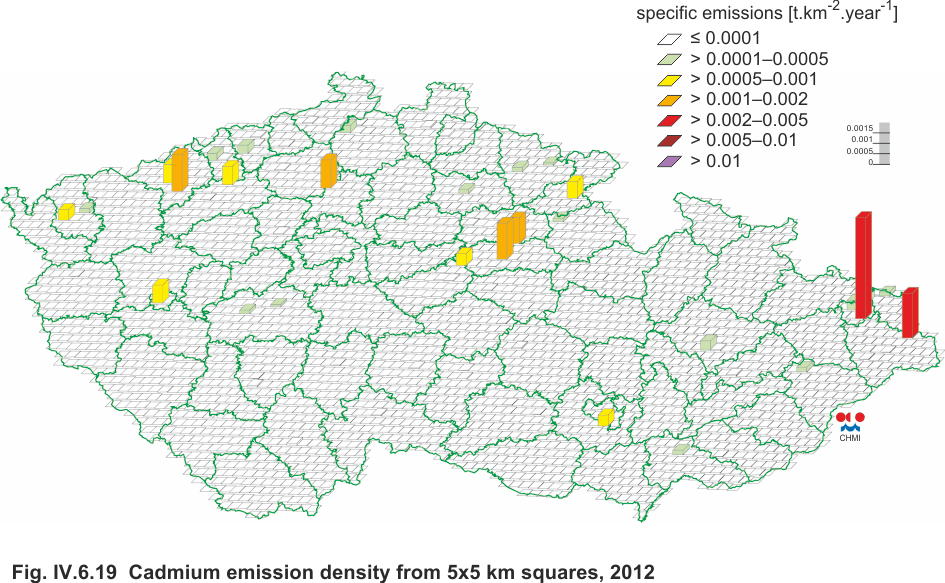
Fig. IV.6.19 |
Cd emission density from 5x5 km squares, 2012 |
|
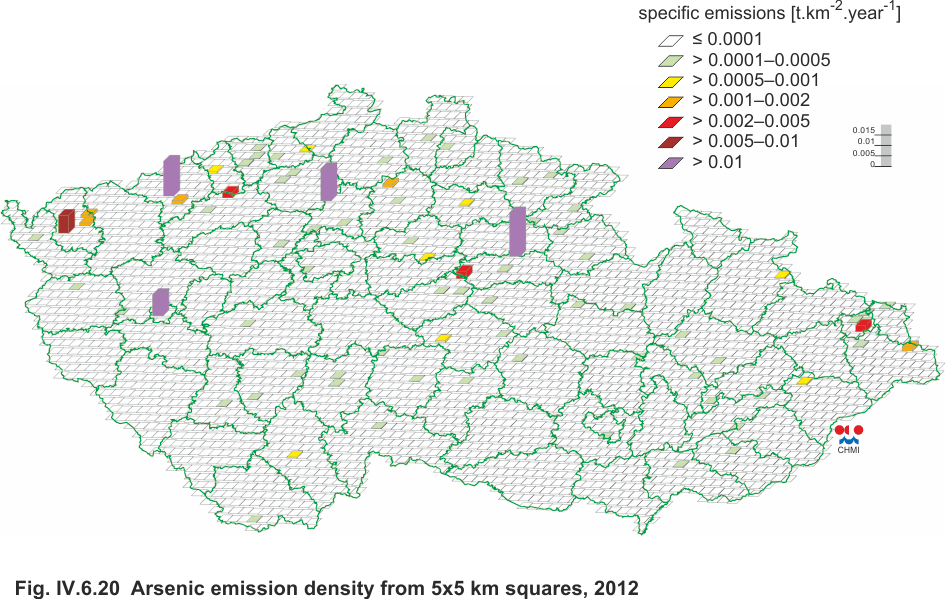
Fig. IV.6.20 |
As emission density from 5x5 km squares, 2012 |
|
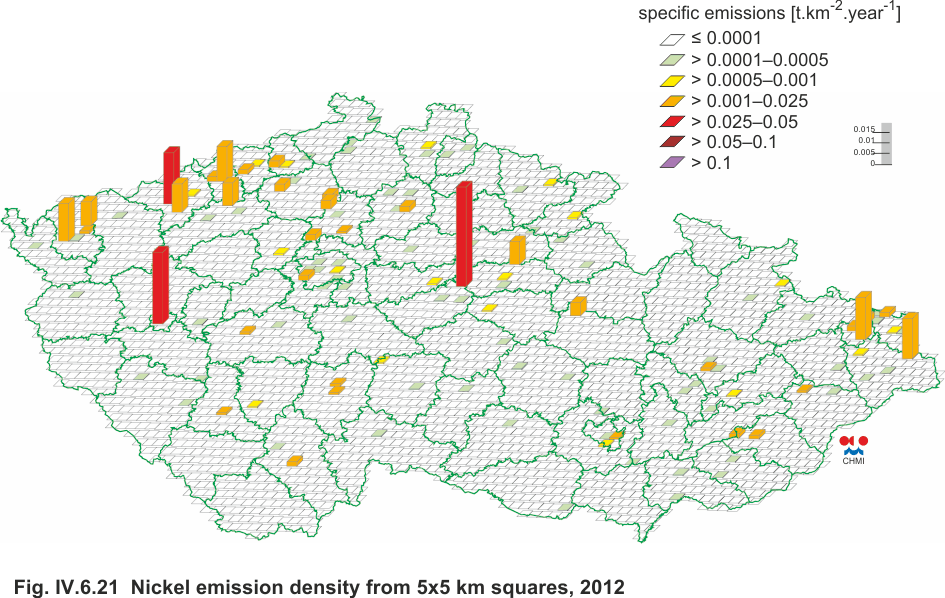
Fig. IV.6.21 |
Ni emission density from 5x5 km squares, 2012 |
|
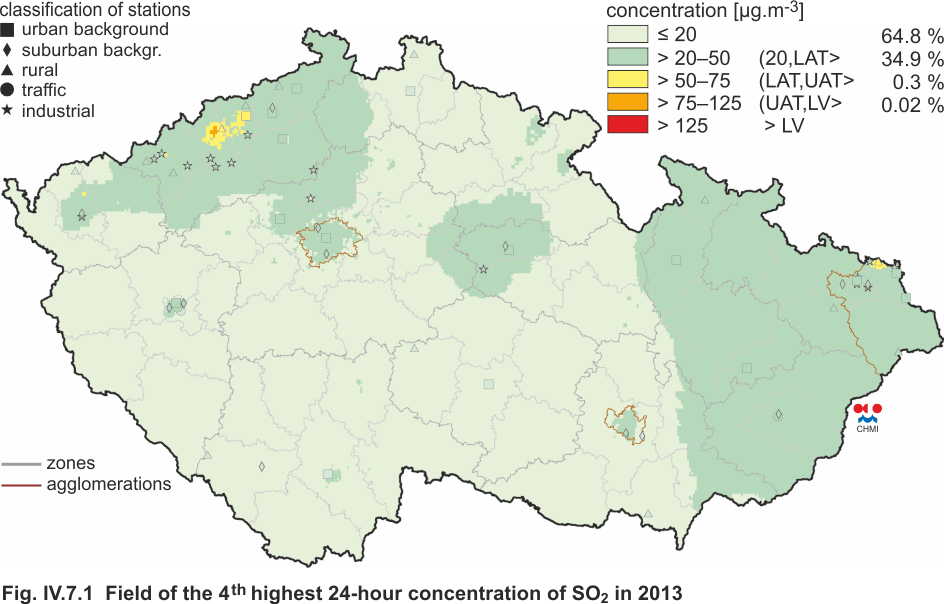
Fig. IV.7.1 |
Field of the 4th highest 24-hour concentration of
SO2 in 2013 |
|
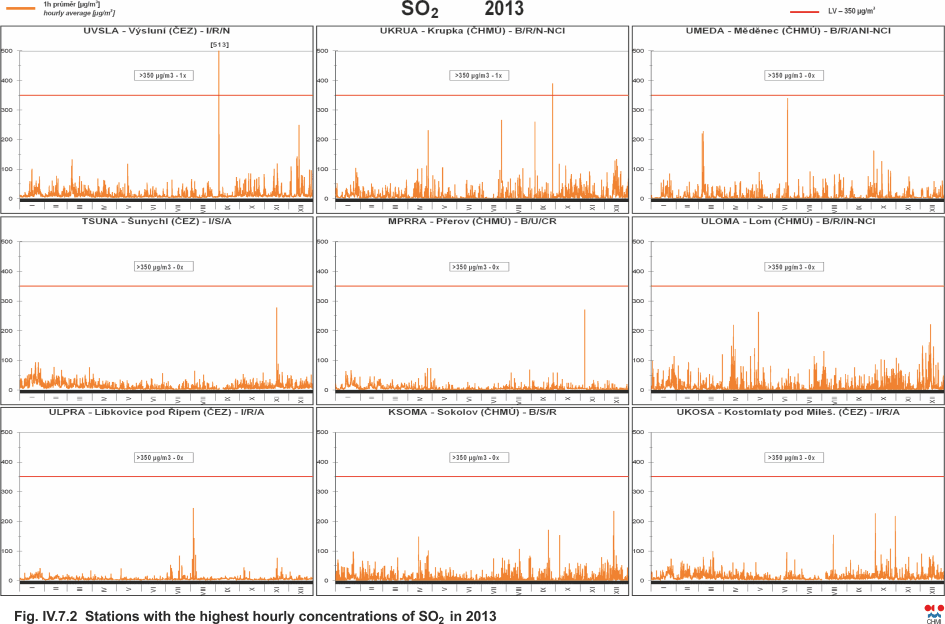
Fig. IV.7.2 |
Stations with the highest hourly concentrations of
SO2 in 2013 |
|
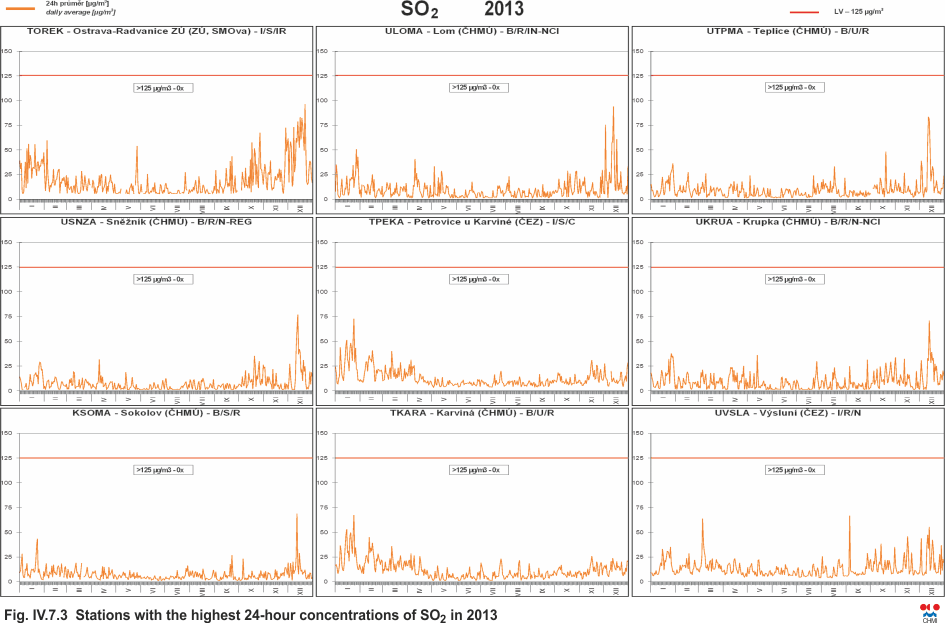
Fig. IV.7.3 |
Stations with the highest 24-hour concentrations of
SO2 in 2013 |
|
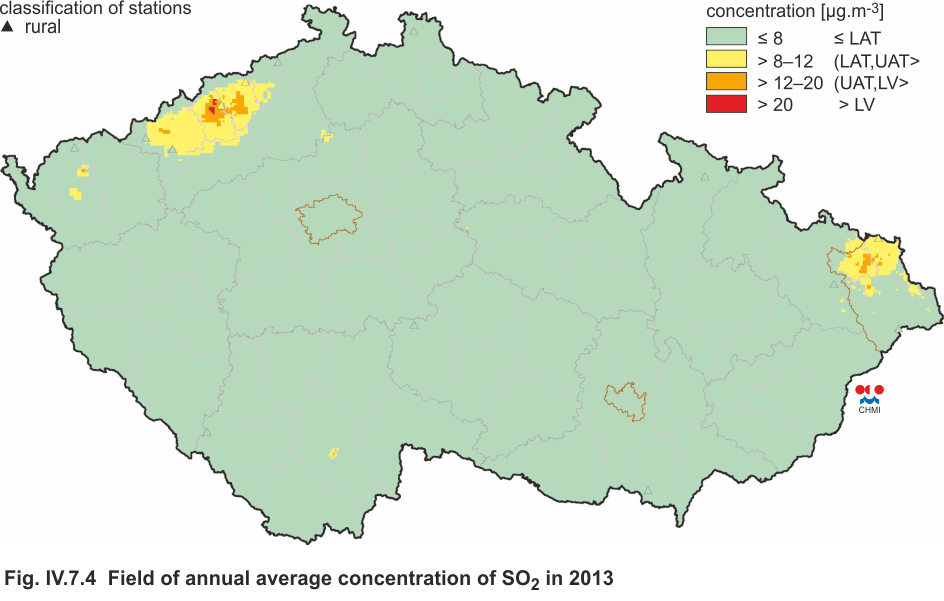
Fig. IV.7.4 |
Field of annual average concentration of SO2 in 2013 |
|
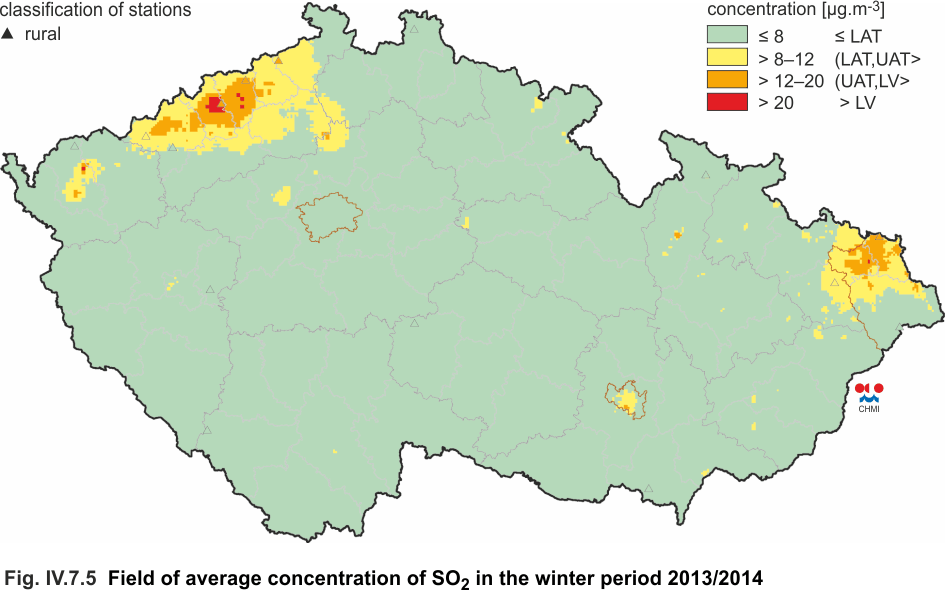
Fig. IV.7.5 |
Field of average concentration of SO2 in the winter
period 2013/2014 |
|
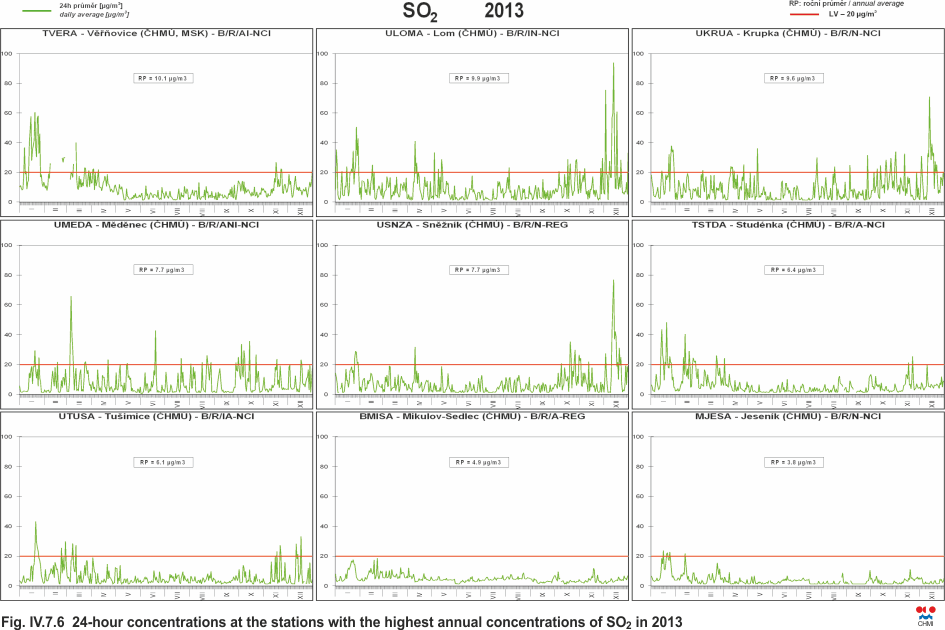
Fig. IV.7.6 |
24-hour concentrations at the stations with the
highest annual concentrations of SO2 in 2013 |
|
Fig. IV.7.7 |
24-hour concentrations at the stations with the
highest winter concentrations of SO2 in the winter
period 2013/2014 |
|
Fig. IV.7.8 |
4th highest 24-hour concentrations and 25th highest
hourly concentrations of SO2 in 2003–2013 at selected
stations |
|
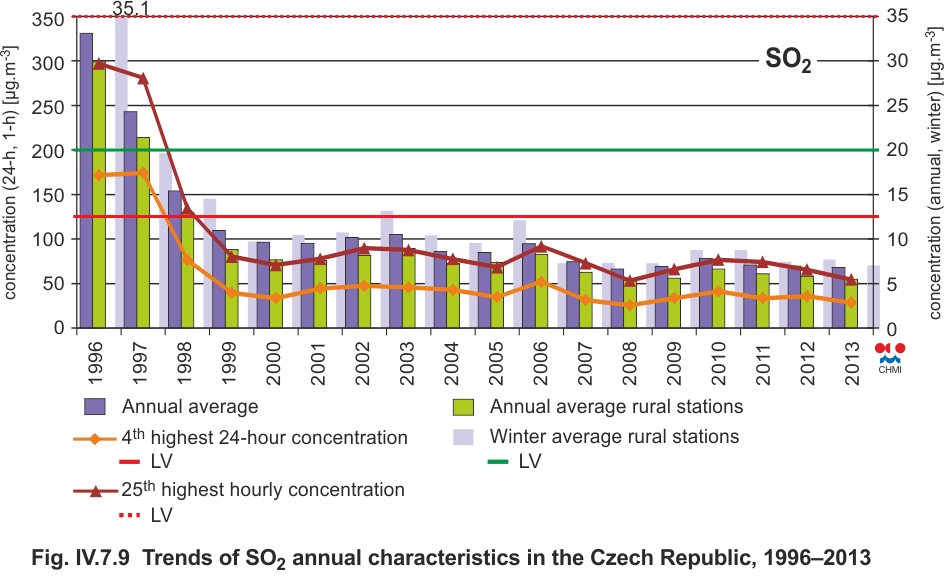
Fig. IV.7.9 |
Trends of SO2 annual characteristics in the Czech
Republic, 1996–2013 |
|
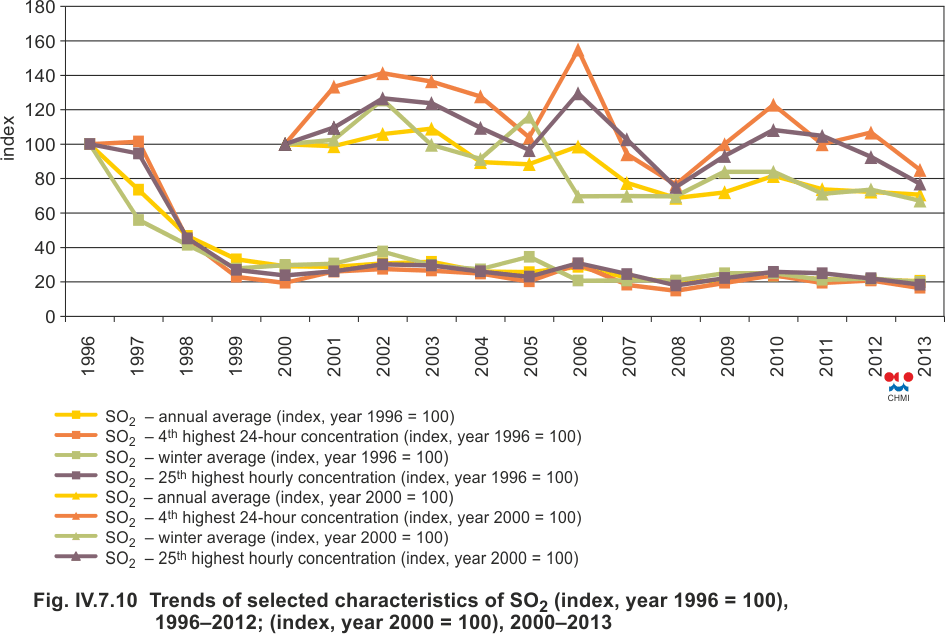
Fig. IV.7.10 |
Trends of selected characteristics of SO2 (index,
year 1996 = 100), 1996–2013; (index, year 2000 = 100),
2000–2013 |
|
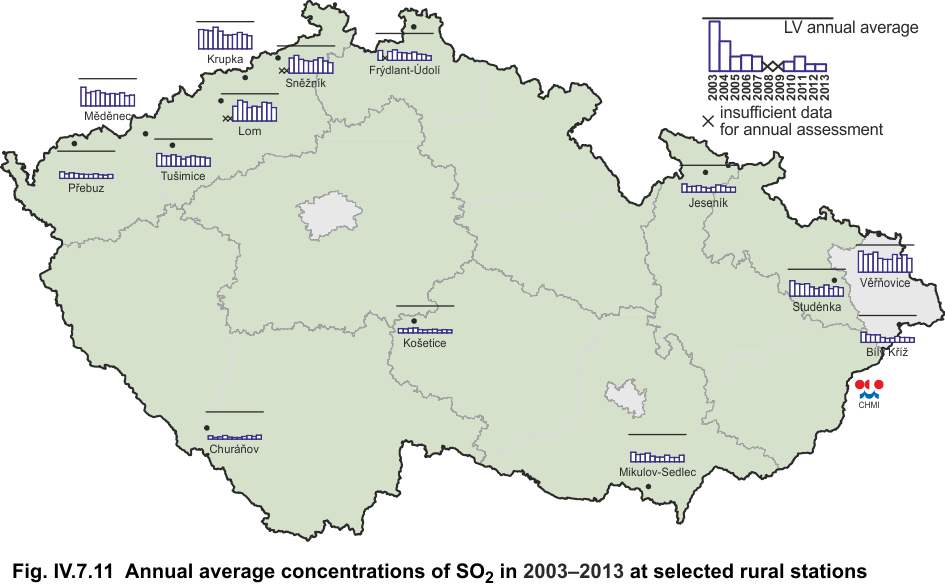
Fig. IV.7.11 |
Annual average concentrations of SO2 in 2003–2013 at
selected rural stations |
|
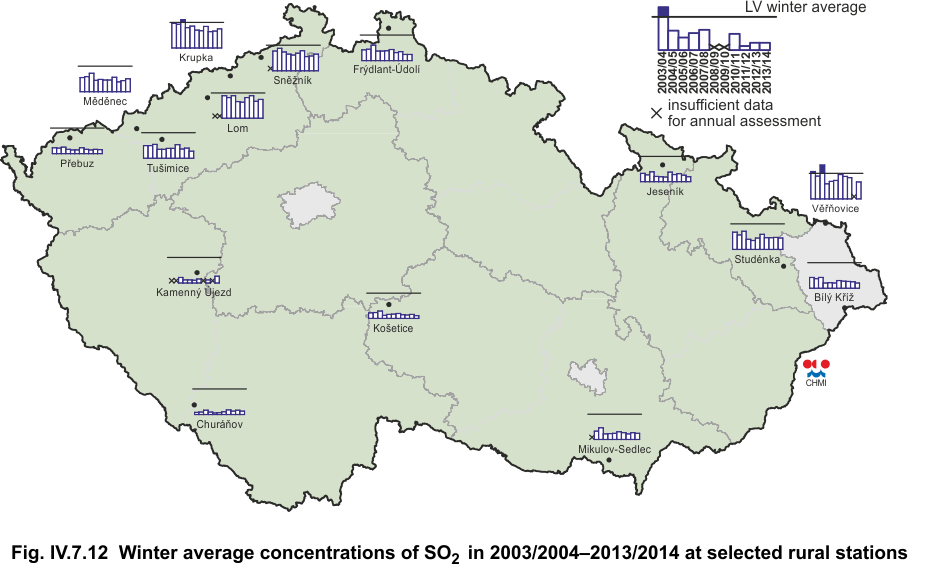
Fig. IV.7.12 |
Winter average concentrations of SO2 in
2003/2004–2013/2014 at selected rural stations |
|
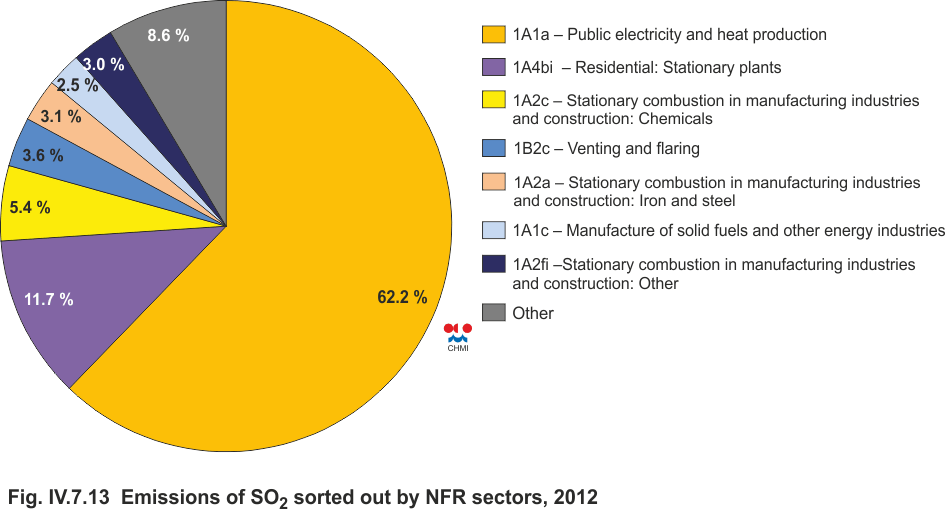
Fig. IV.7.13 |
Emissions of SO2 sorted out by NFR sectors, 2012 |
|
Fig. IV.7.14 |
The development of SO2 emissions, 2007–2012 |
|
Fig. IV.7.15 |
Sulphur dioxide emission density from 5x5 km
squares, 2012 |
|
Fig. IV.8.1 |
Stations with the highest values of maximum daily
8-hour running average concentrations of CO in 2013 |
|
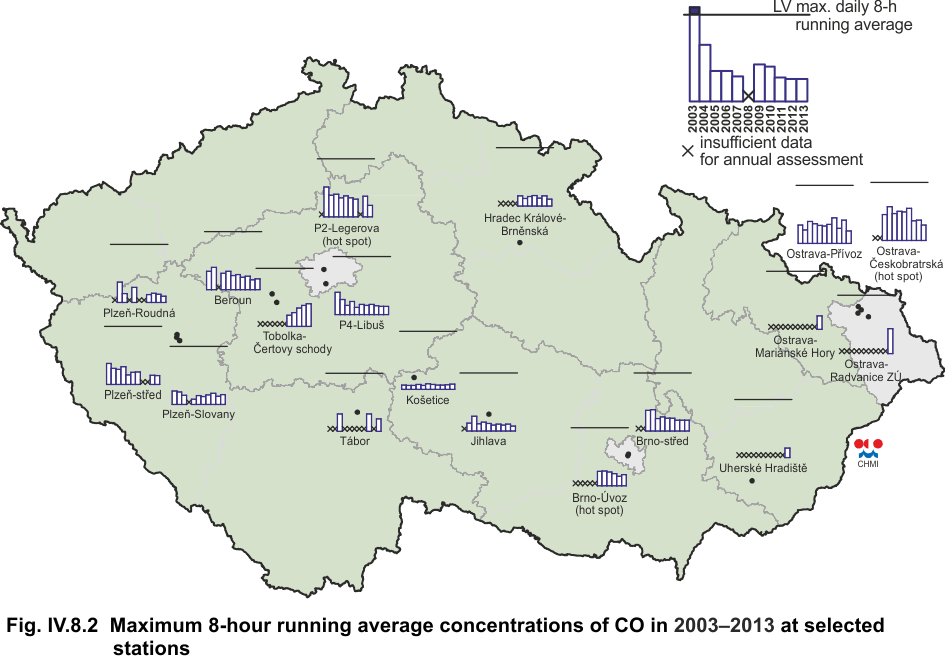
Fig. IV.8.2 |
Maximum daily 8-hour running average concentrations
of CO in 2003–2013 at selected stations |
|
Fig. IV.8.3 |
Emissions of CO sorted out by NFR sectors, 2012 |
|
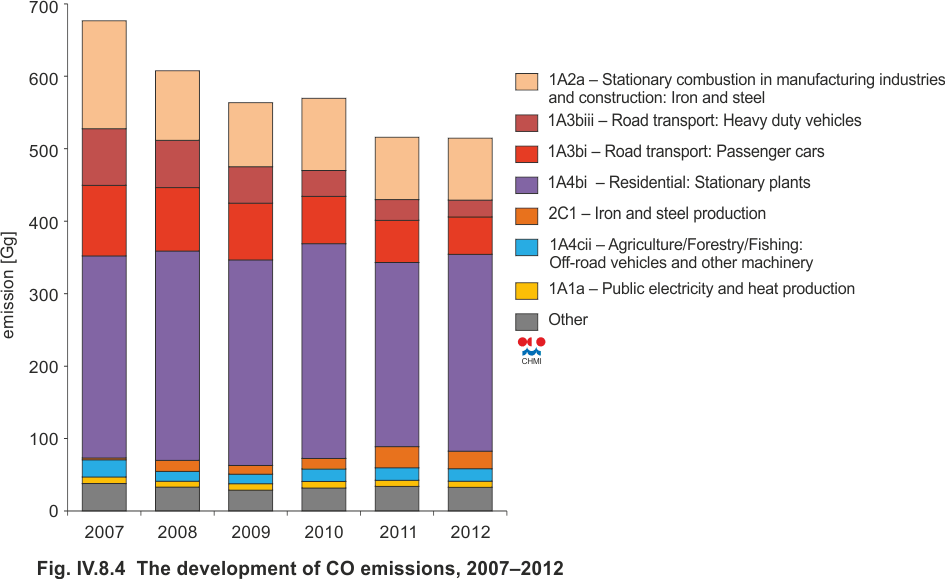
Fig. IV.8.4 |
The development of CO emissions, 2007–2012 |
|
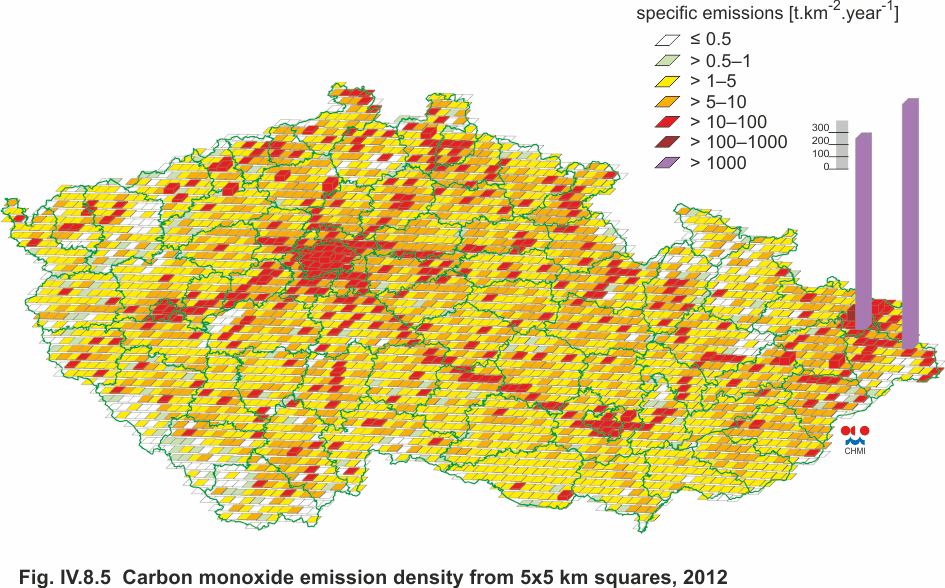
Fig. IV.8.5 |
Carbon monoxide emission density from 5x5 km
squares, 2012 |
|
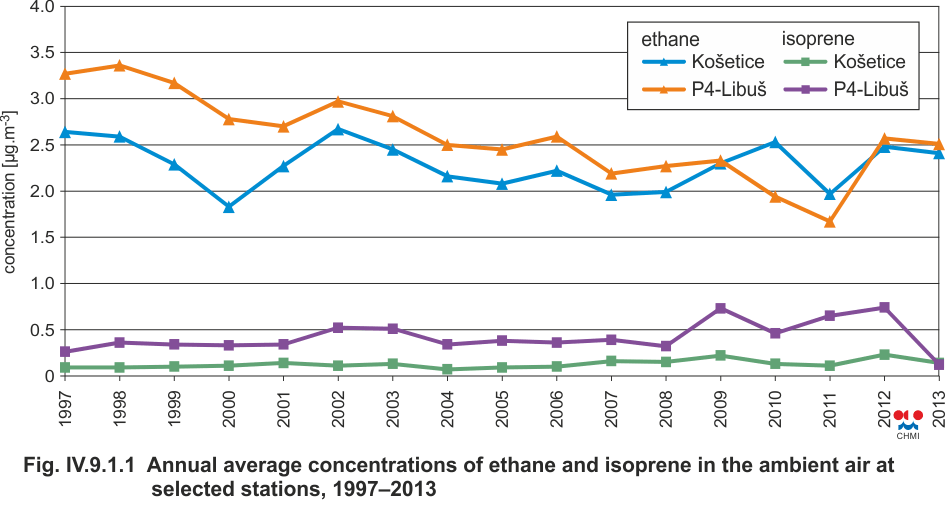
Fig. IV.9.1.1 |
Annual average concentrations of fethane and isoprene
in the ambient air at selected stations, 1997–2013 |
|
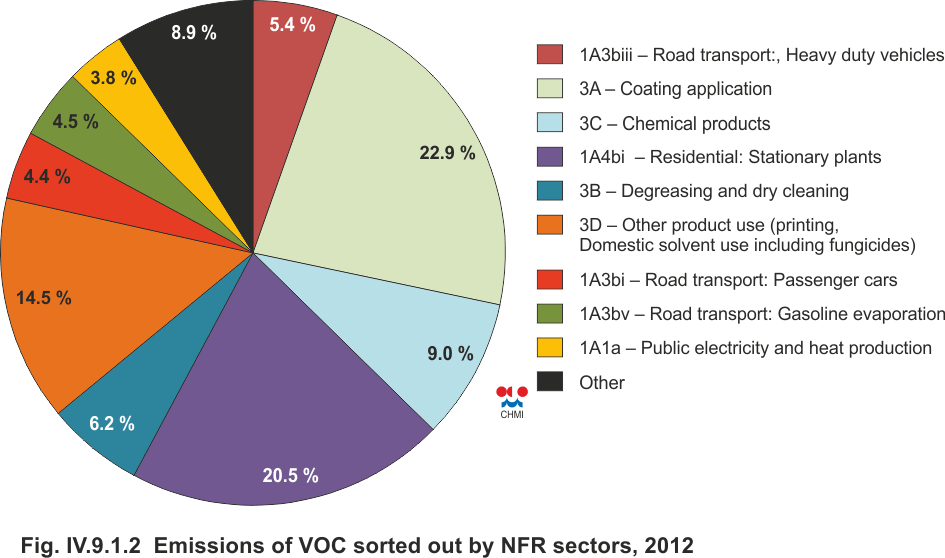
Fig. IV.9.1.2 |
Emissions of VOC sorted out by NFR sectors, 2012 |
|
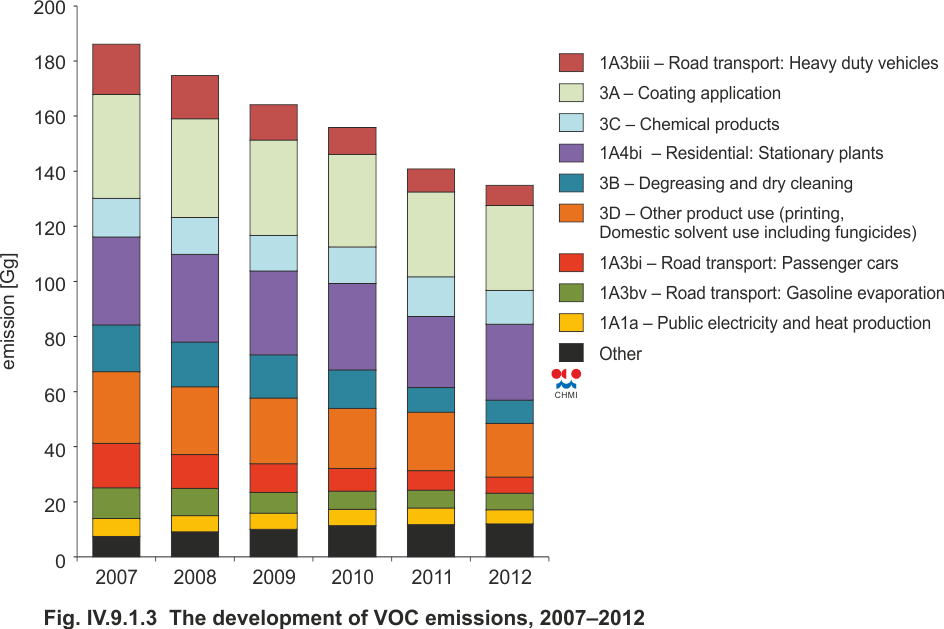
Fig. IV.9.1.3 |
The development of VOC emissions, 2007–2012 |
|
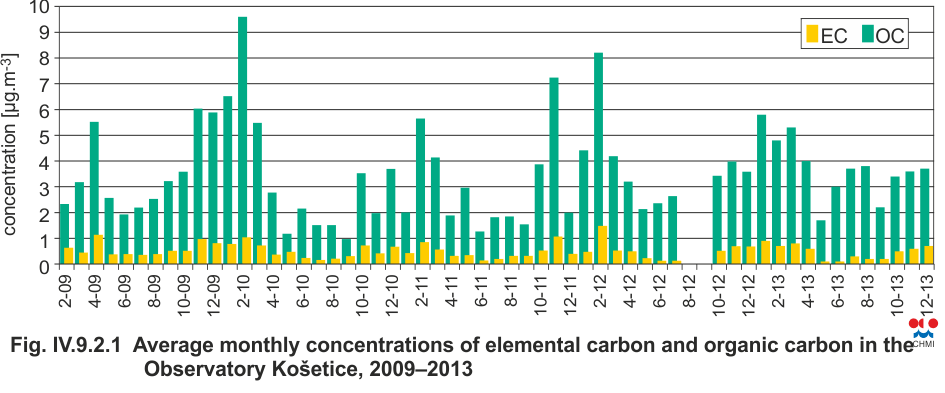
Fig. IV.9.2.1 |
Average monthly concentrations of elemental carbon
and organic carbon in the Observatory Košetice,
2009–2013 |
|
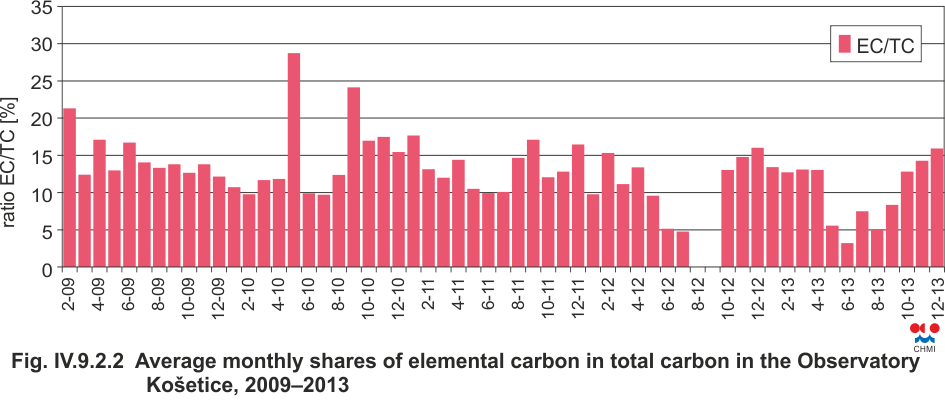
Fig. IV.9.2.2 |
Average monthly shares of elemental carbon in total
carbon in the Observatory Košetice, 2009–2013 |
|
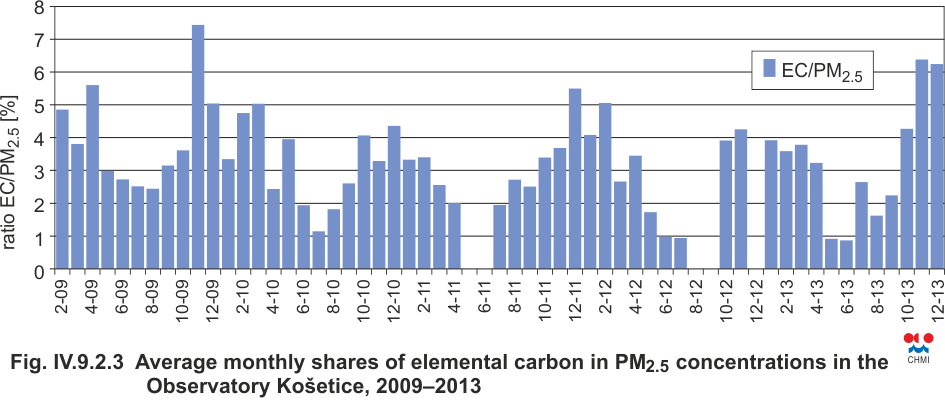
Fig. IV.9.2.3 |
Average monthly shares of elemental carbon in PM2.5
concentrations in the Observatory Košetice, 2009–2013 |
|
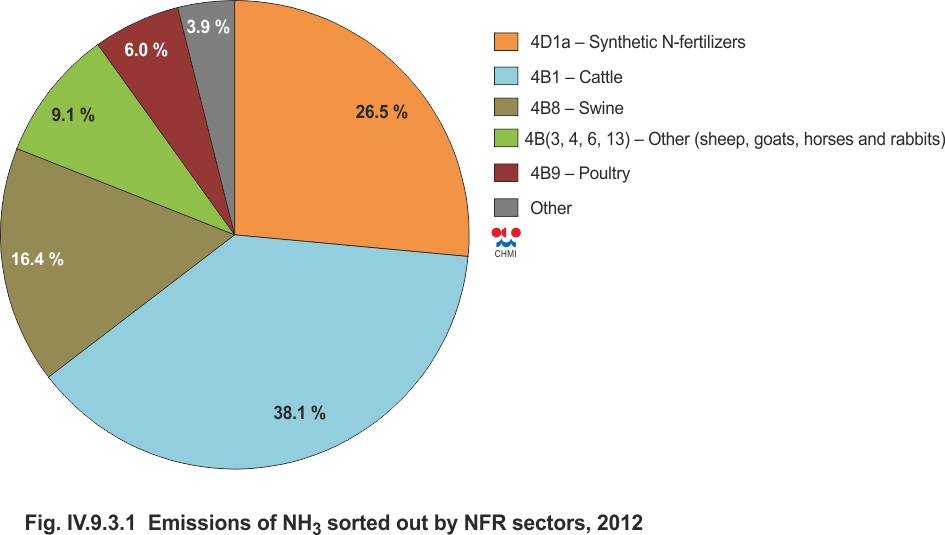
Fig. IV.9.3.1 |
Emissions of NH3 sorted out by NFR sectors, 2012 |
|
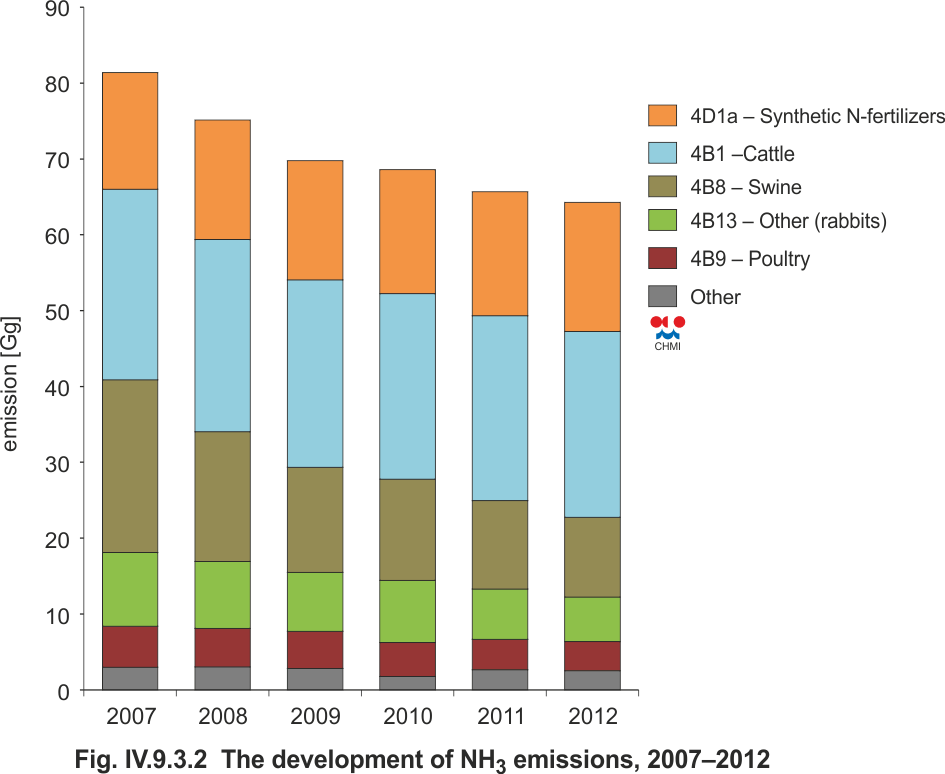
Fig. IV.9.3.2 |
The development of NH3 emissions, 2007–2012 |
|
Fig. V.1 |
Trends of SO2, NO2 and CO (1996–2013) and benzene
(2005–2013) annual characteristics in agglomerations |
|
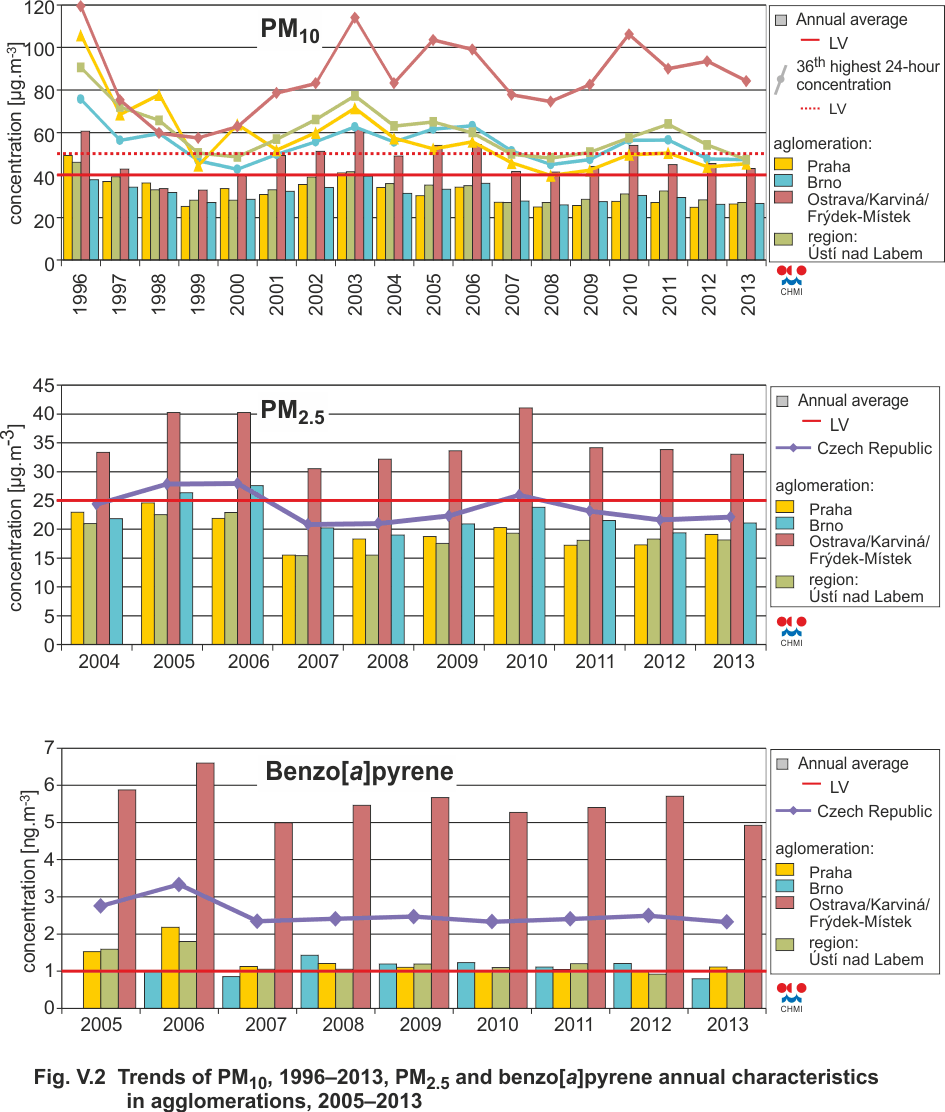
Fig. V.2 |
Trends of PM10 (1996–2013), PM2.5 (2004–2013) and
benzo[a]pyrene (2005–2013) annual characteristics in
agglomerations |
|
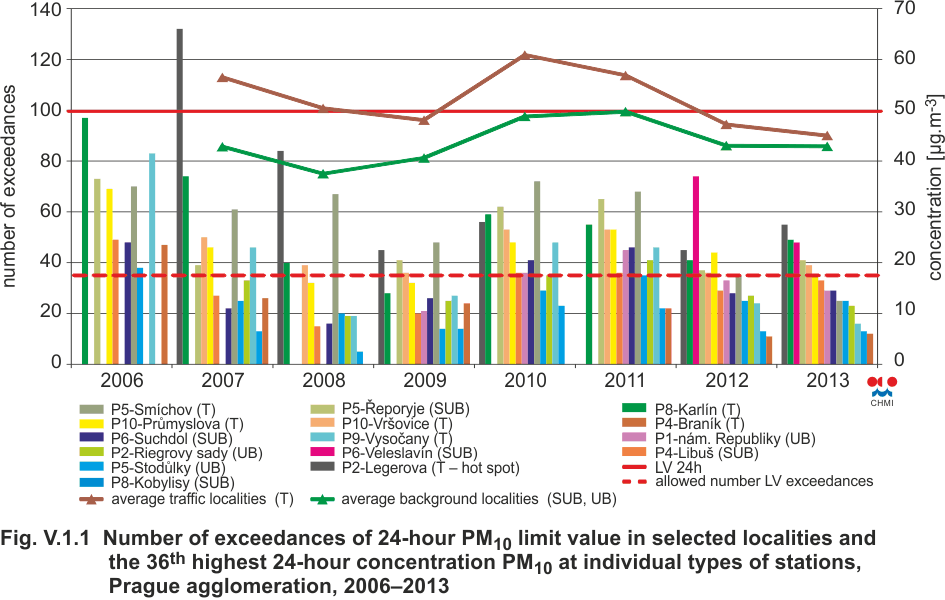
Fig. V.1.1 |
Number of exceedances of 24-hour PM10 limit value in
selected localities and the 36th highest 24-hour
concentration PM10 at individual types of stations,
agglomeration of Prague, 2006–2013 |
|
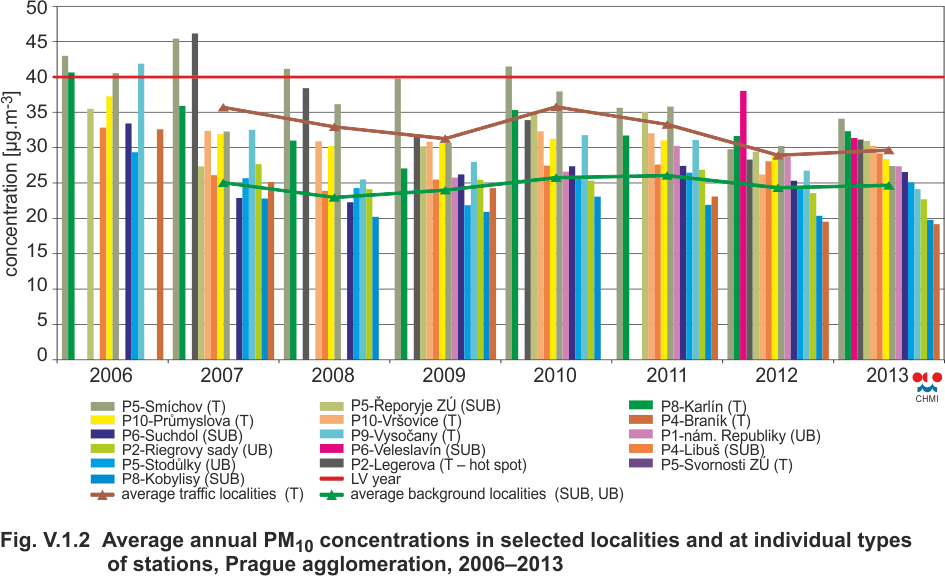
Fig. V.1.2 |
Average annual PM10 concentrations in selected
localities and at individual types of stations,
agglomeration of Prague, 2006–2013 |
|
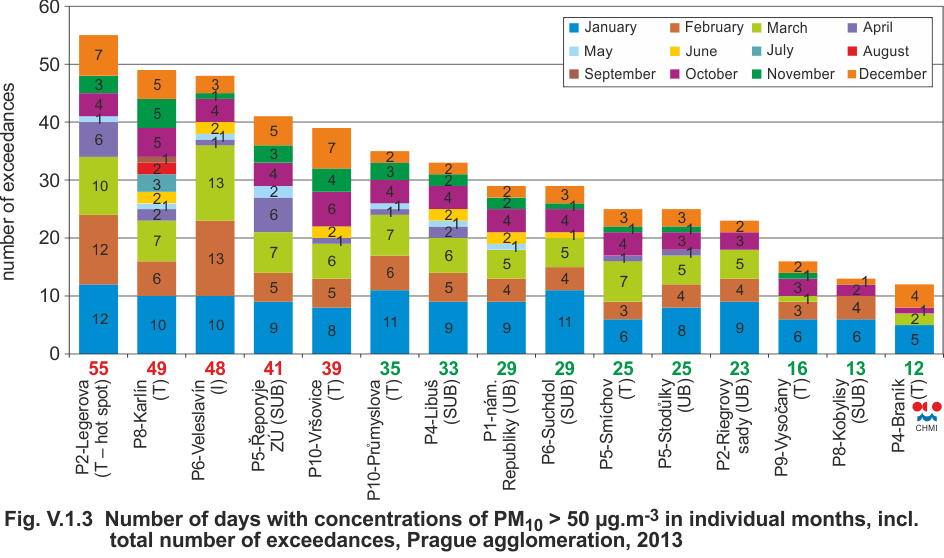
Fig. V.1.3 |
Number of days with concentrations of PM10 > 50
µg.m-3 in individual months, incl. total number of
exceedances, agglomeration of Prague, 2013 |
|
Fig. V.1.4 |
Average annual PM2.5 concentrations, agglomeration
of Prague, 2004–2013 |
|
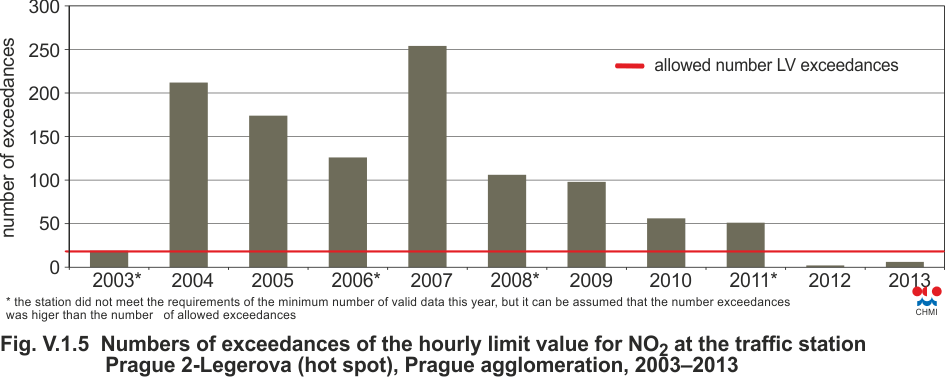
Fig. V.1.5 |
Numbers of exceedances of the hourly limit value for
NO2 at the traffic station Prague 2-Legerova (hot spot),
agglomeration of Prague, 2003–2013 |
|
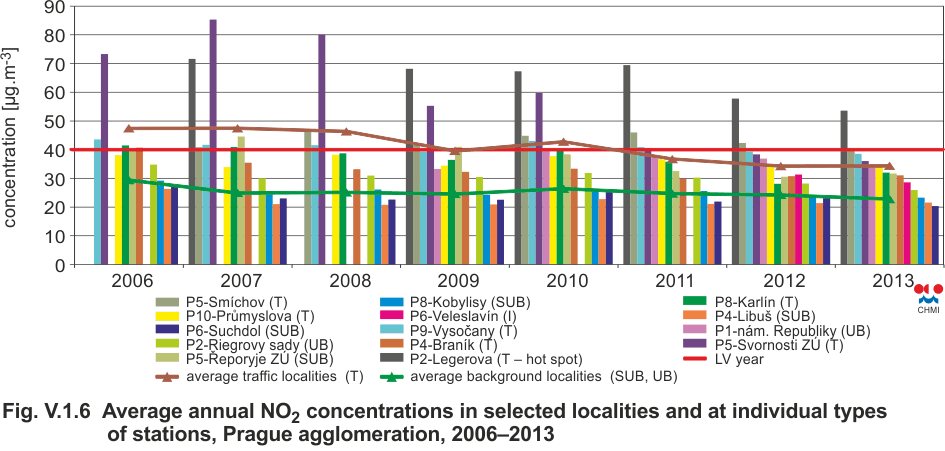
Fig. V.1.6 |
Average annual NO2 concentrations in selected
localities and at individual types of stations,
agglomeration of Prague, 2006–2013 |
|
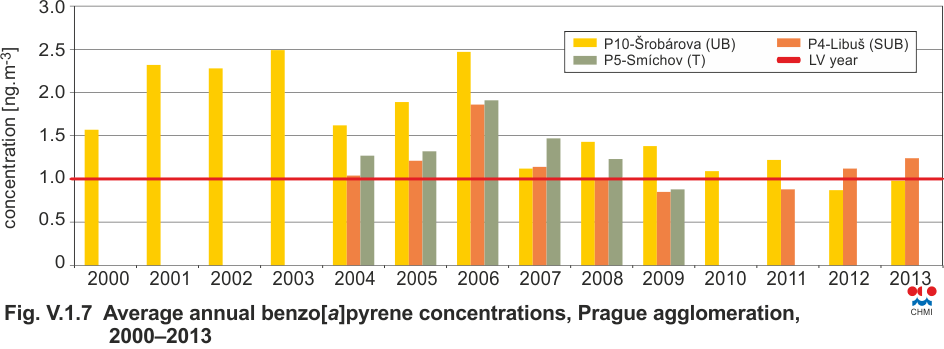
Fig. V.1.7 |
Average annual benzo[a]pyrene concentrations,
agglomeration of Prague, 2000–2013 |
|
Fig. V.1.8 |
Numbers of exceedances of the limit value of O3 in
the average for three years, agglomeration of Prague,
2006–2013 |
|
Fig. V.1.9 |
Field of the annual concentration of NO2,
agglomeration of Prague, 2013 |
|
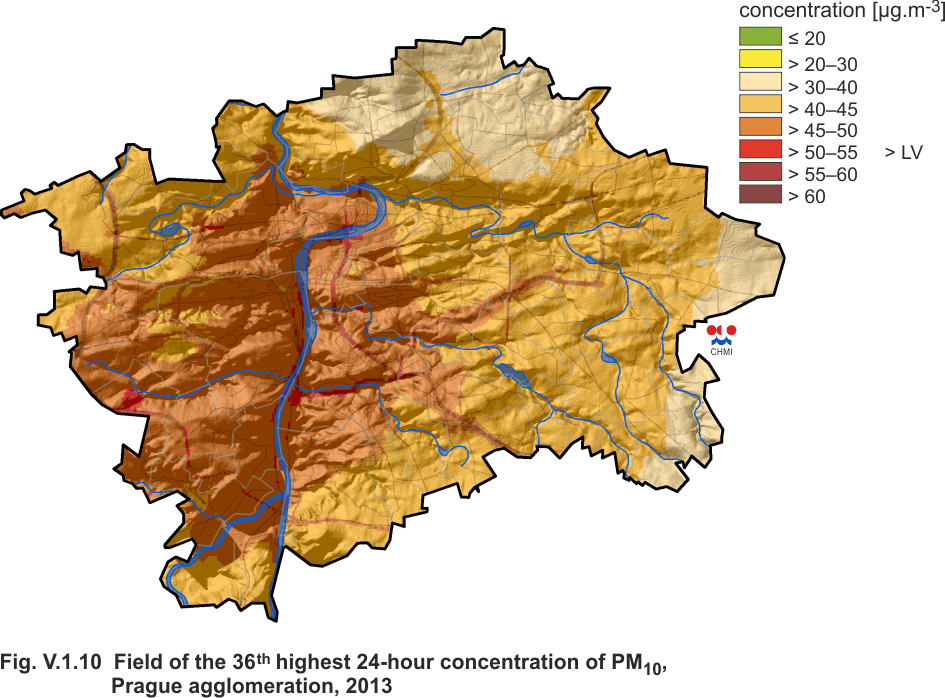
Fig. V.1.10 |
Field of the 36th highest 24-hour concentration of
PM10, agglomeration of Prague, 2013 |
|
Fig. V.1.11 |
Emissions of selected pollutants listed according to
REZZO in the agglomeration of Prague |
|
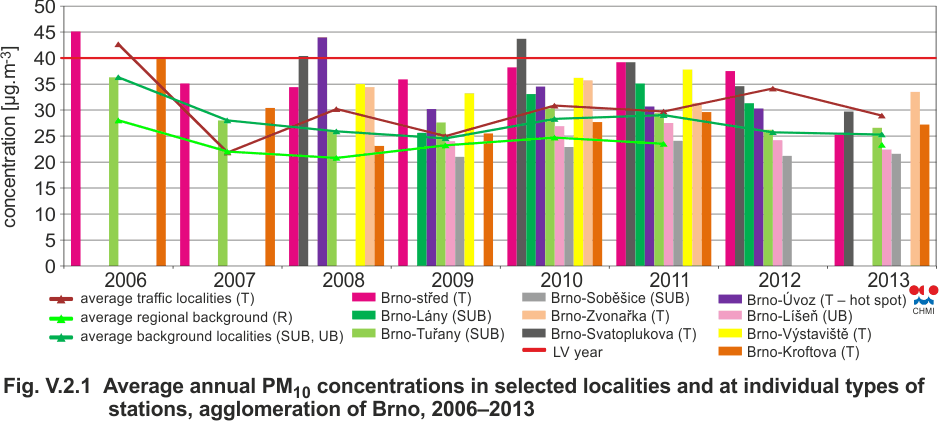
Fig. V.2.1 |
Average annual PM10 concentrations in selected
localities and at individual types of stations,
agglomeration of Brno, 2006–2013 |
|
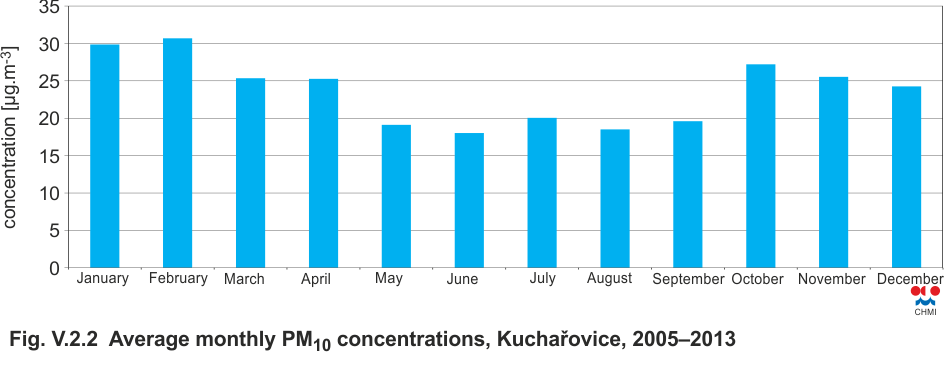
Fig. V.2.2 |
Average monthly PM10 concentrations in the locality
Kuchařovice (average for 2005–2012) |
|
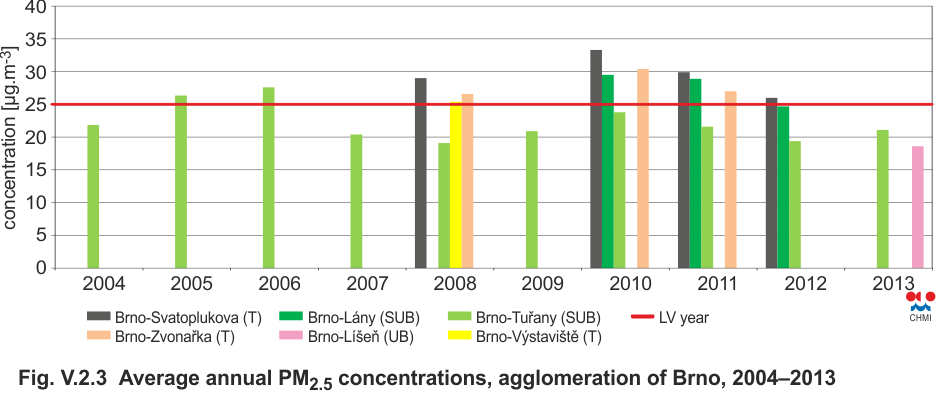
Fig. V.2.3 |
Average annual PM2.5 concentrations, agglomeration
of Brno, 2004–2013 |
|
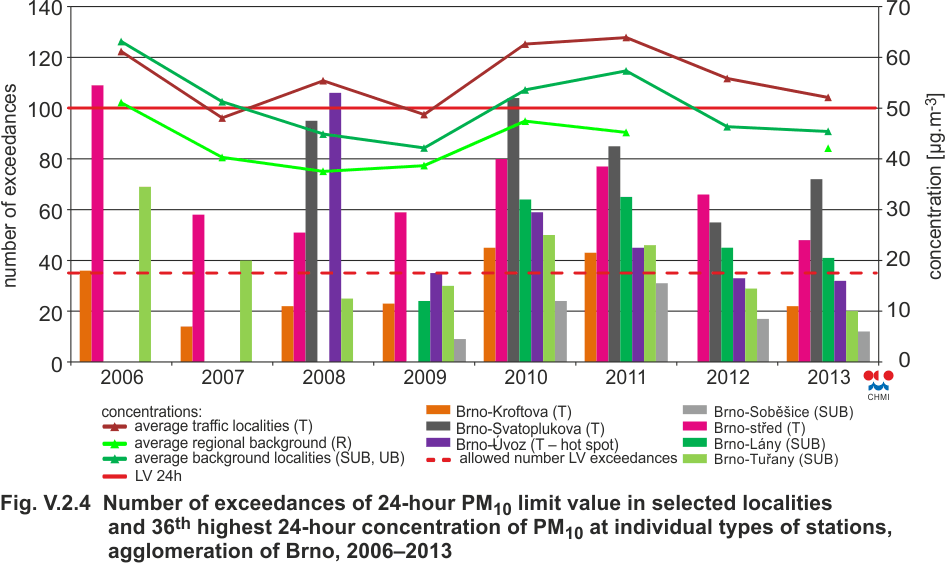
Fig. V.2.4 |
Number of exceedances of 24-hour PM10 limit value in
selected localities and 36th highest 24-hour
concentration of PM10 at individual types of stations,
agglomeration of Brno, 2006–2013 |
|
Fig. V.2.5 |
Number of days with concentrations of PM10 > 50
µg.m-3 in individual months, incl. total number of
exceedances, agglomeration of Brno, 2013 |
|
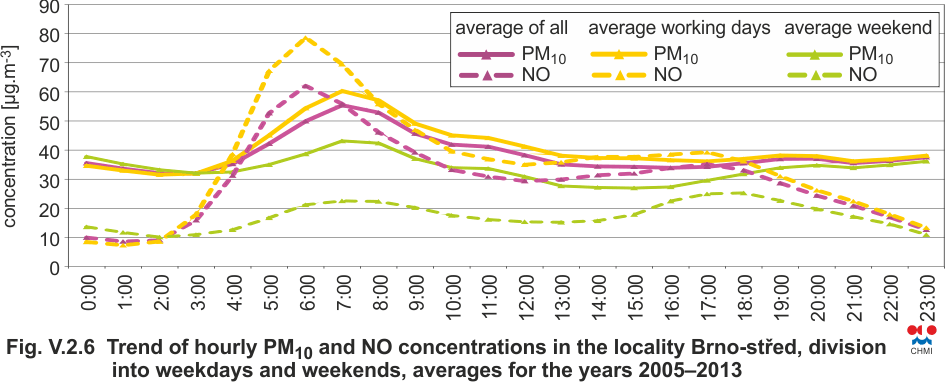
Fig. V.2.6 |
Trend of hourly PM10 and NO concentrations in the
locality Brno-střed, division into weekdays and
weekends, averages for the years 2005–2013 |
|
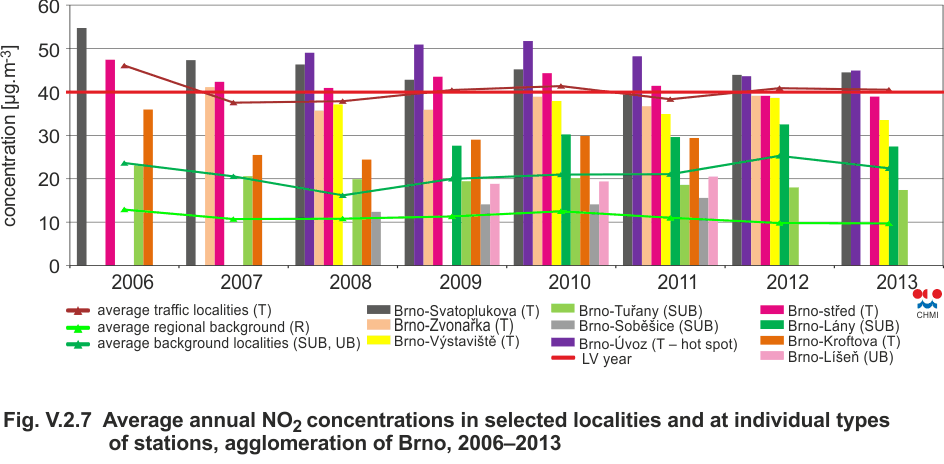
Fig. V.2.7 |
Average annual NO2 concentrations in selected
localities and at individual types of stations,
agglomeration of Brno, 2006–2013 |
|
Fig. V.2.8 |
Average annual benzo[a]pyrene concentrations,
agglomeration of Brno, 2006–2013 |
|
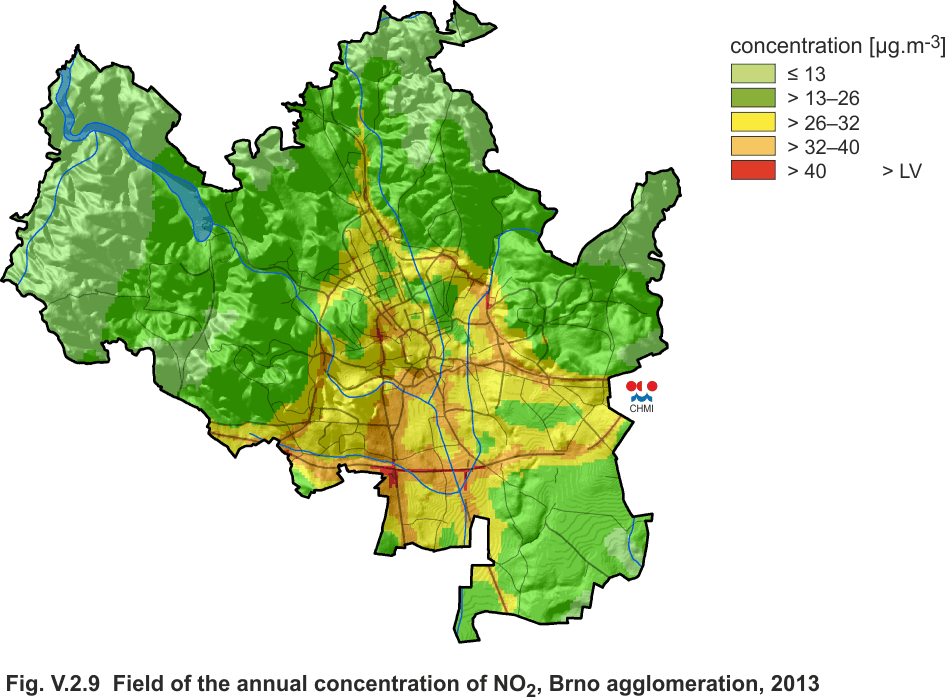
Fig. V.2.9 |
Field of the annual concentration of NO2,
agglomeration of Brno, 2013 |
|
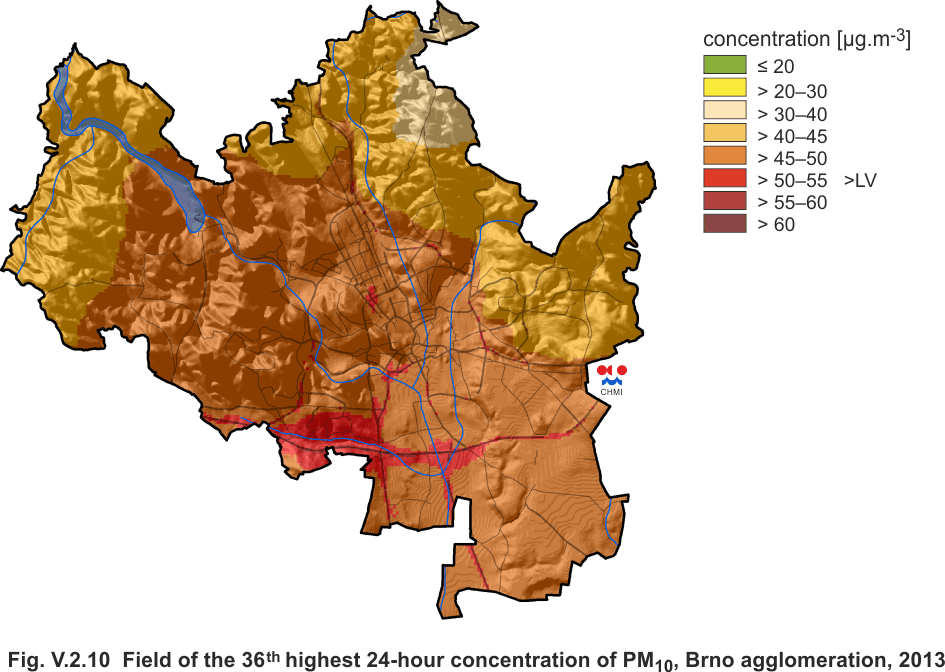
Fig. V.2.10 |
Field of the 36th highest 24-hour concentration of
PM10, agglomeration of Brno, 2013 |
|
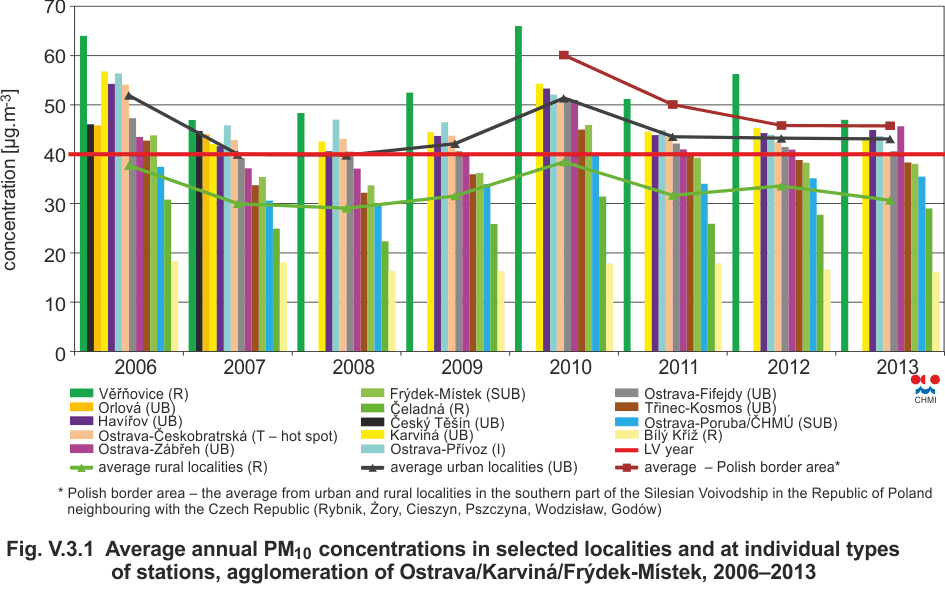
Fig. V.3.1 |
Average annual PM10 concentrations in selected
localities and at individual types of stations,
agglomeration of Ostrava/Karviná/Frýdek-Místek,
2006–2013 |
|
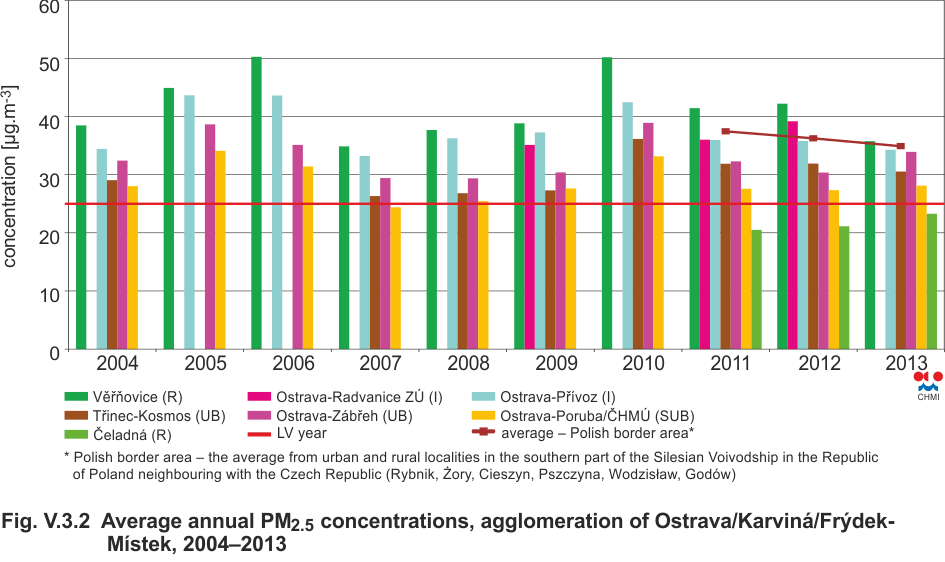
Fig. V.3.2 |
Average annual PM2.5 concentrations, agglomeration
of Ostrava/Karviná/Frýdek-Místek, 2004–2013 |
|
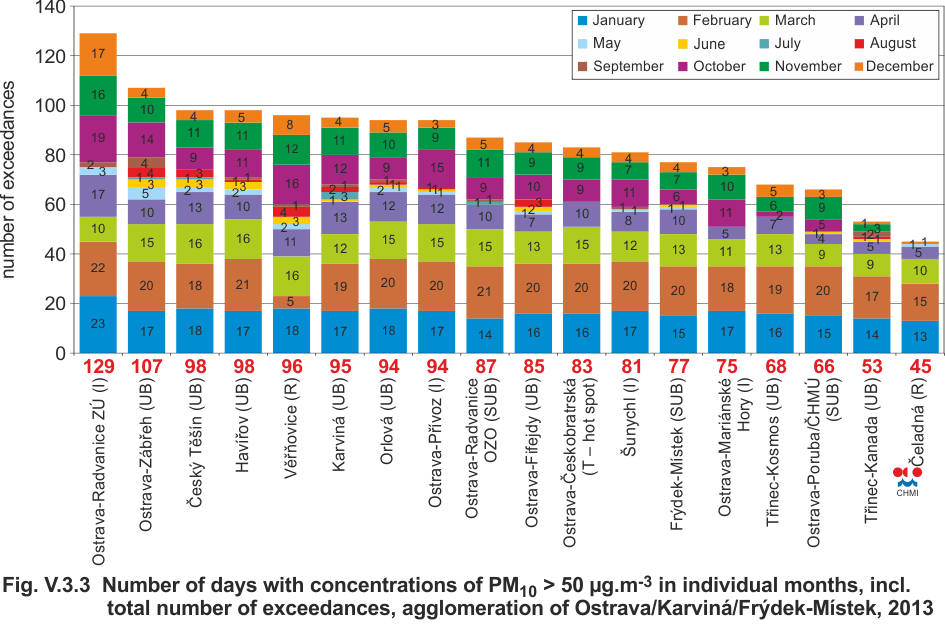
Fig. V.3.3 |
Number of days with concentrations of PM10 > 50
µg.m-3, agglomeration of Ostrava/Karviná/Frýdek-Místek,
2013 |
|
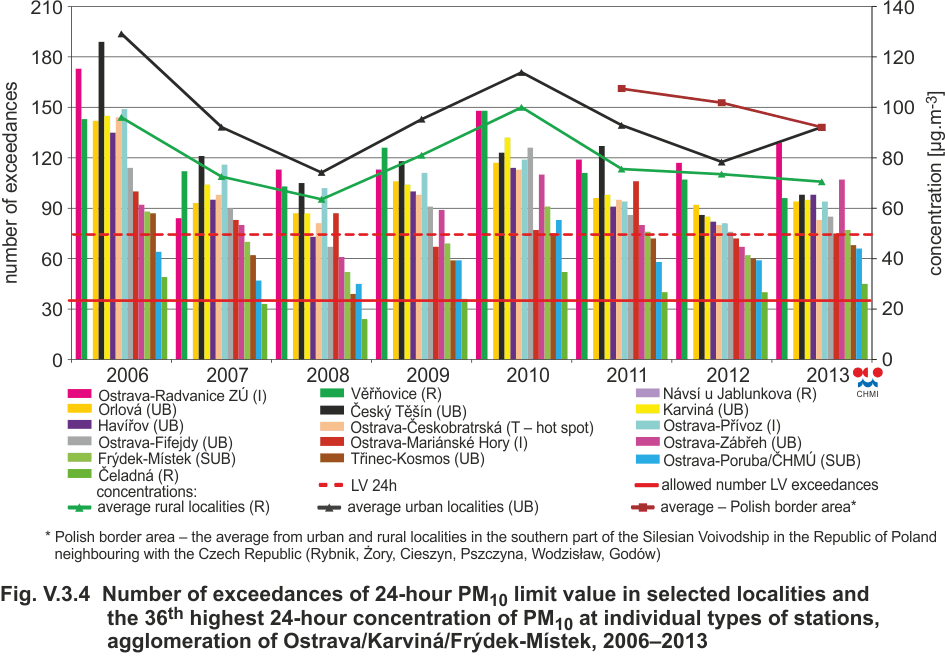
Fig. V.3.4 |
Number of exceedances of 24-hour limit value for
PM10 in selected localities and the 36th highest 24-hour
concentrations of PM10 at individual types of stations,
agglomeration of Ostrava/Karviná/Frýdek-Místek,
2006–2013 |
|
Fig. V.3.5 |
Average annual NO2 concentrations in selected
localities and at individual types of stations,
agglomeration of Ostrava/Karviná/Frýdek-Místek,
2006–2013 |
|
Fig. V.3.6 |
Average annual benzo[a]pyrene concentrations,
agglomeration of Ostrava/Karviná/Frýdek-Místek,
2000–2013 |
|
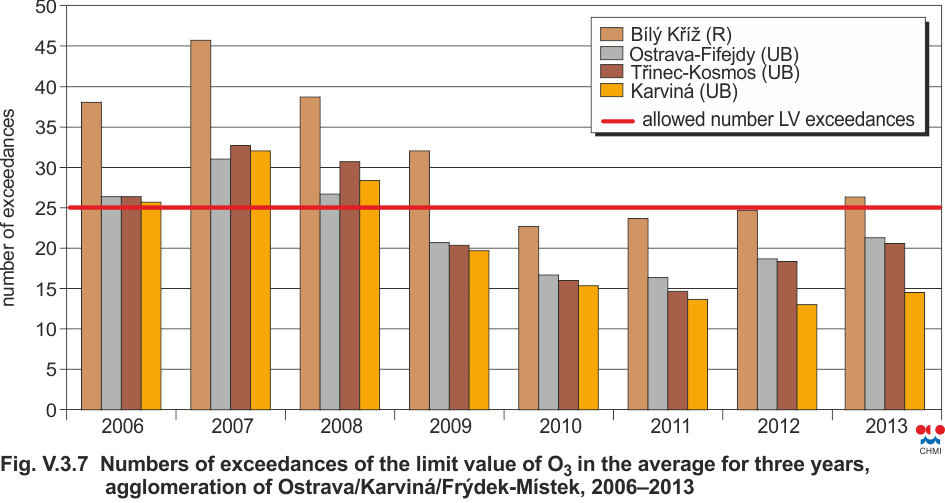
Fig. V.3.7 |
Number of exceedances of the target value of O3 in
the average for three years, agglomeration of
Ostrava/Karviná/Frýdek-Místek, 2006–2013 |
|
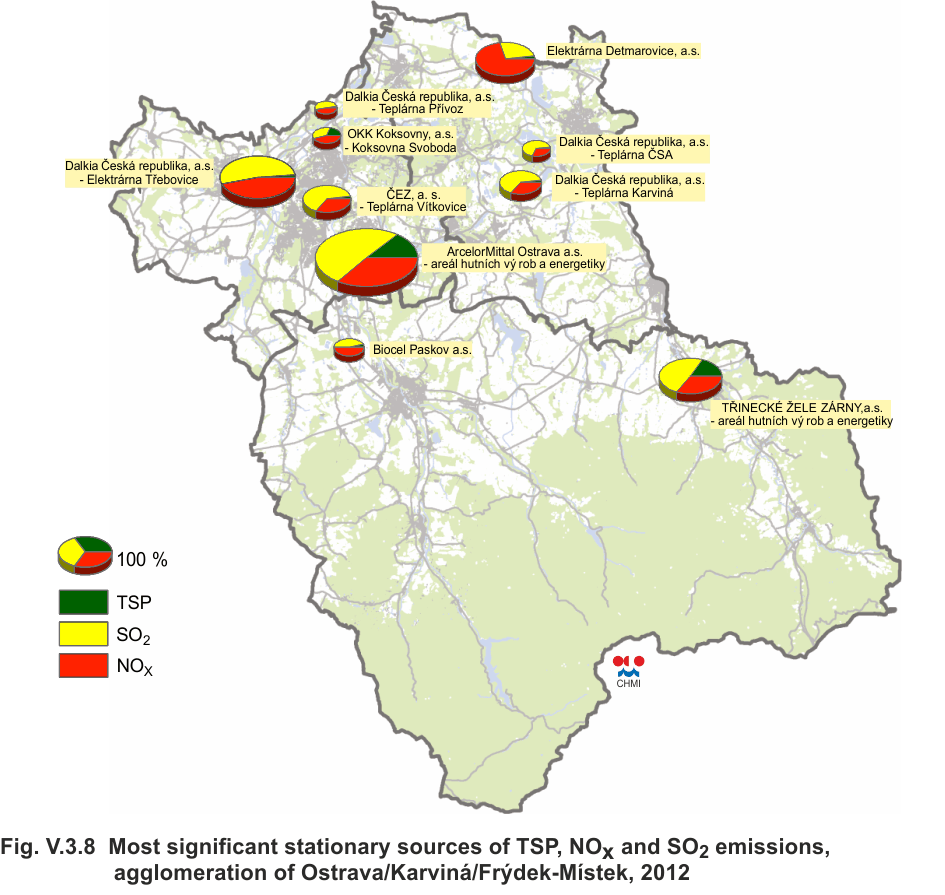
Fig. V.3.8 |
Most significant stationary sources of TSP, NOx and
SO2 emissions, agglomeration of
Ostrava/Karviná/Frýdek-Místek, 2012 |
|
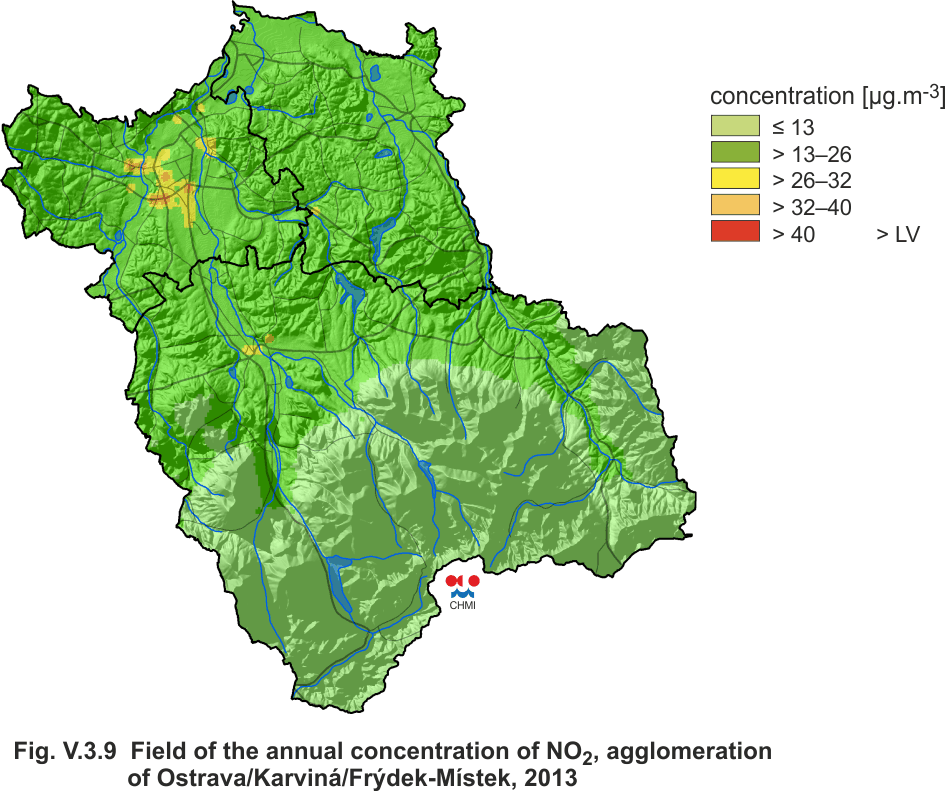
Fig. V.3.9 |
Field of the annual concentration of NO2,
agglomeration of Ostrava/Karviná/Frýdek-Místek, 2013 |
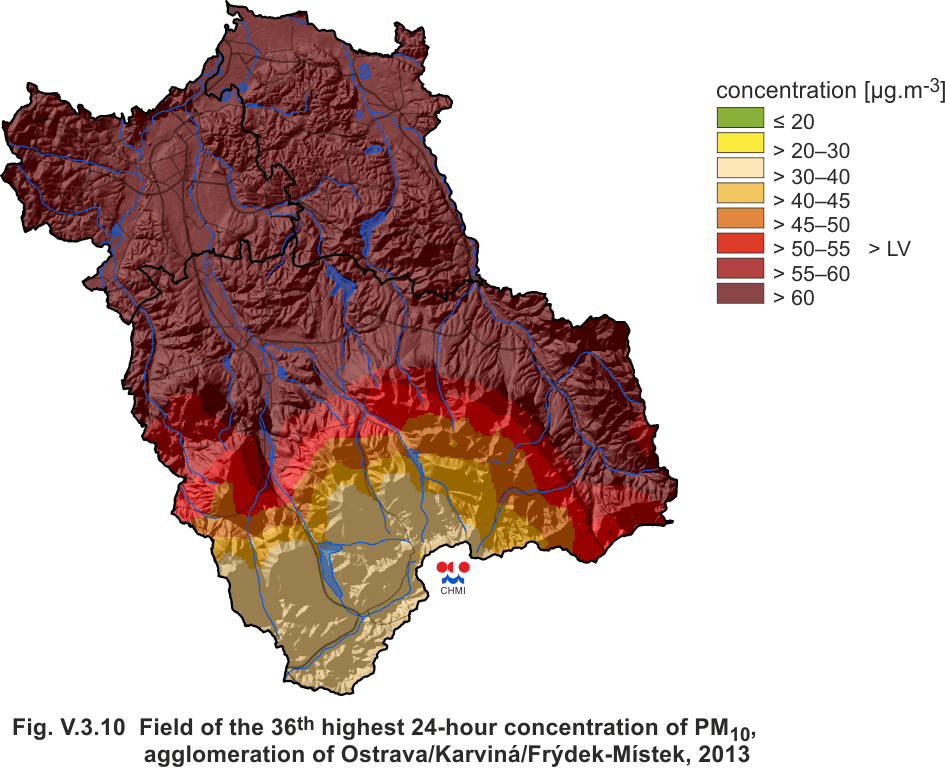
|
Fig. V.3.10 |
Field of the 36th highest 24-hour concentration of
PM10, agglomeration of Ostrava/Karviná/Frýdek-Místek,
2013 |
|
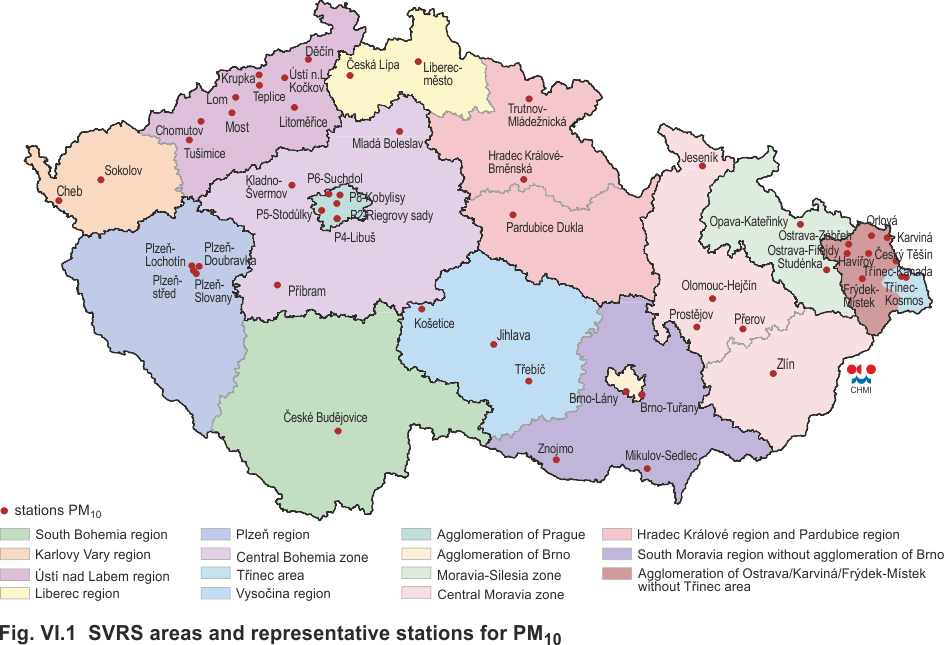
Fig. VI.1 |
SVRS areas and representative stations for PM10 |
|
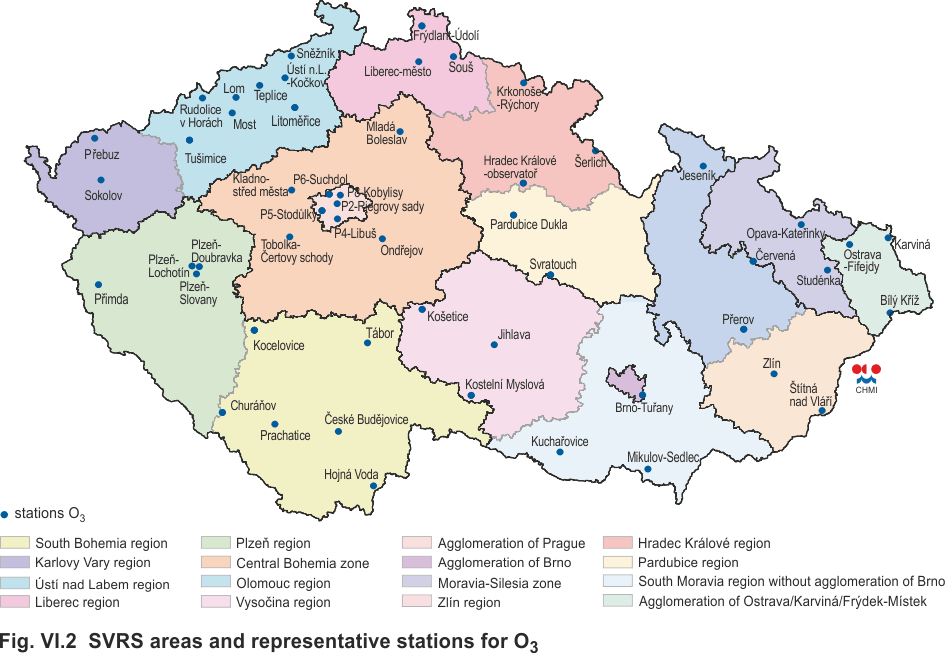
Fig. VI.2 |
SVRS areas and representative stations for O3 |
|
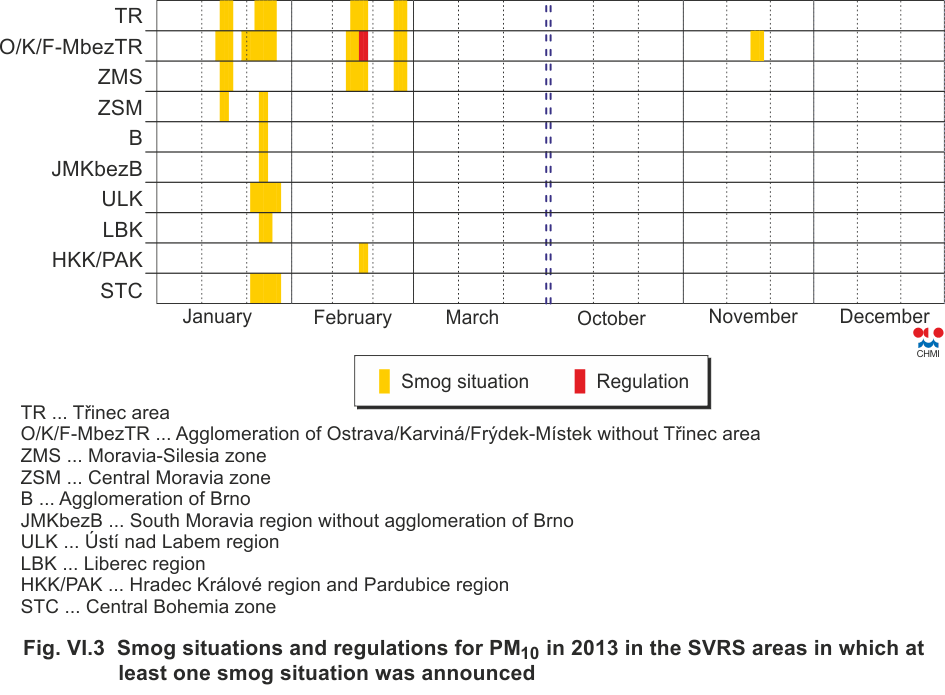
Fig. VI.3 |
Smog situations and regulations for PM10 in 2013 in
the SVRS areas in which at least one smog situation was
announced |
|
Fig. VII.1 |
Areas with exceeding of the health protection limit
values, ground-level ozone excluded, 2013 |
|
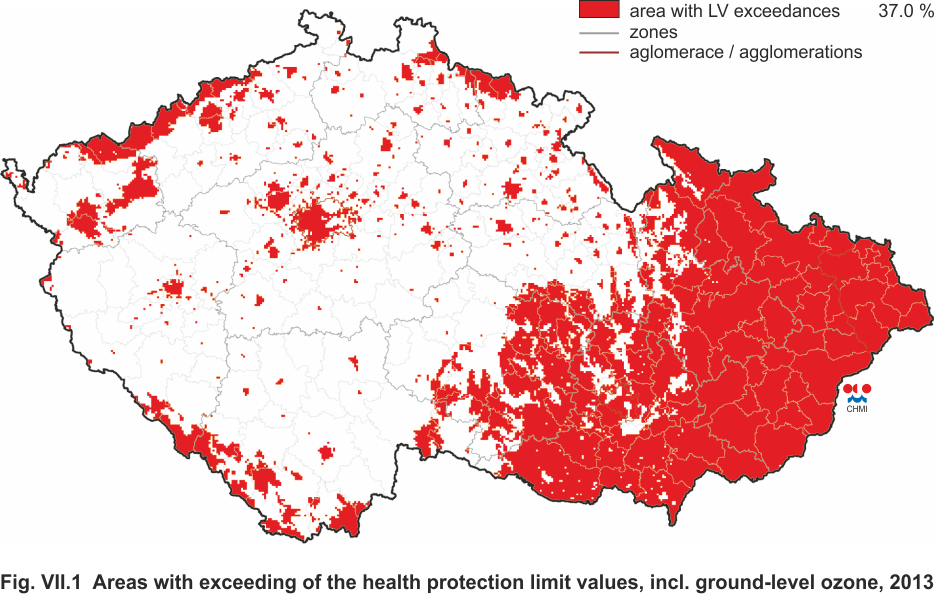
Fig. VII.2 |
Areas with exceeding of the health protection limit
values, incl. ground-level ozone, 2013 |
|
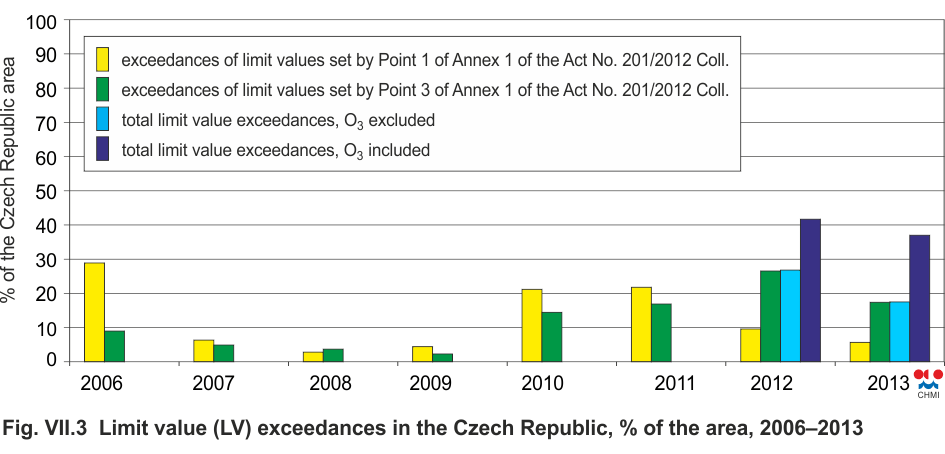
Fig. VII.3 |
Limit value (LV) exceedances in the Czech Republic,
% of the area, 2006–2013 |
|
Fig. VII.4 |
Areas with exceeding of the health protection limit
values, ground-level ozone excluded, 2013 |
|
Fig. VII.5 |
Areas with exceeding of the health protection limit
values, incl. ground-level ozone, 2013 |
|
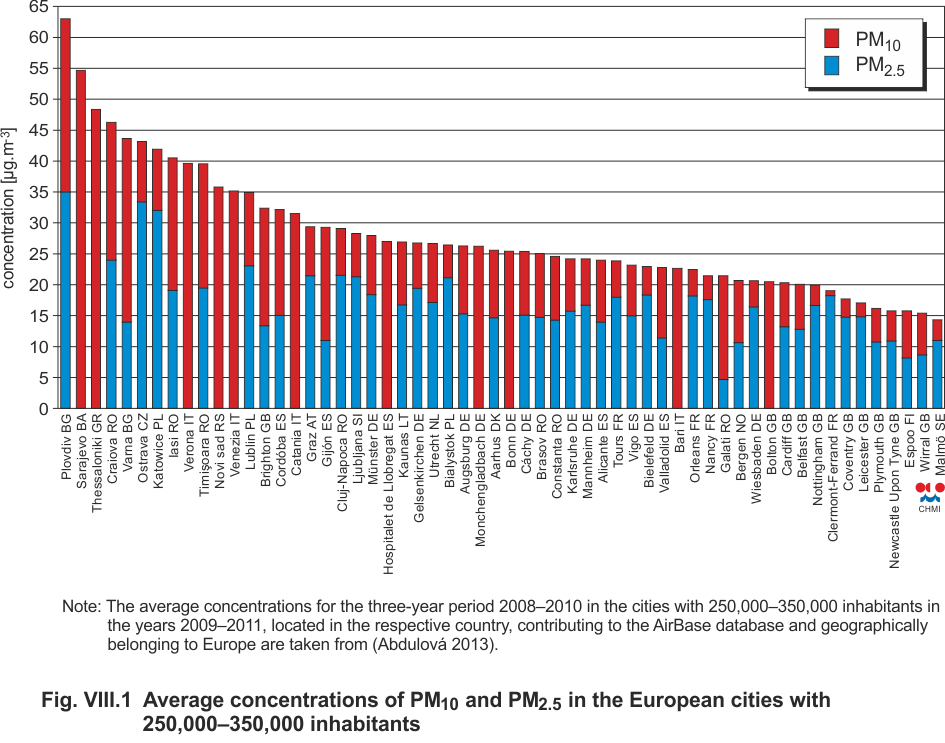
Fig. VIII.1 |
Average concentrations of PM10 and PM2.5 in the
European cities with 250,000–350, 000 inhabitants |
|
Fig. VIII.2 |
Concentrations of PM2.5, benzo[a]pyrene, NO2 (annual
average) and O3 (max. daily 8-hour average) in Europe,
2011 (Source: EEA 2013a) |
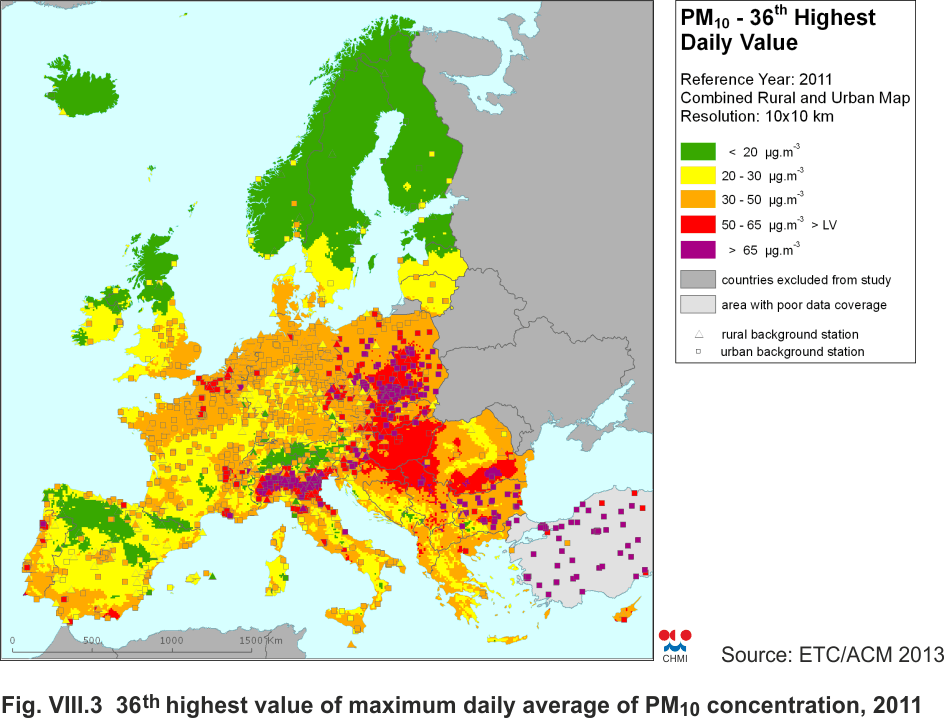
|
Fig. VIII.3 |
36th highest value of maximum daily average of PM10
concentration, 2011 (Source: ETC/ACM 2013) |
|
Fig. VIII.4 |
Annual mean concentrations of benzo[a]pyrene in Europe, 2011(Source: EEA 2013a) |
|
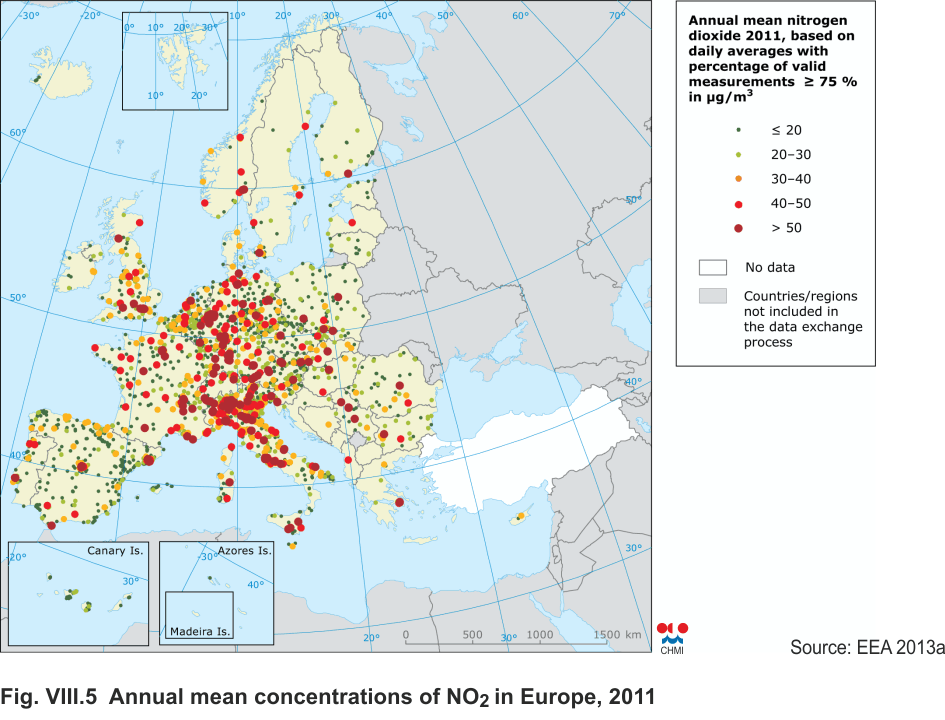
Fig. VIII.5 |
Annual mean concentrations of NO2 in Europe,
2011(Source: EEA 2013a) |
|
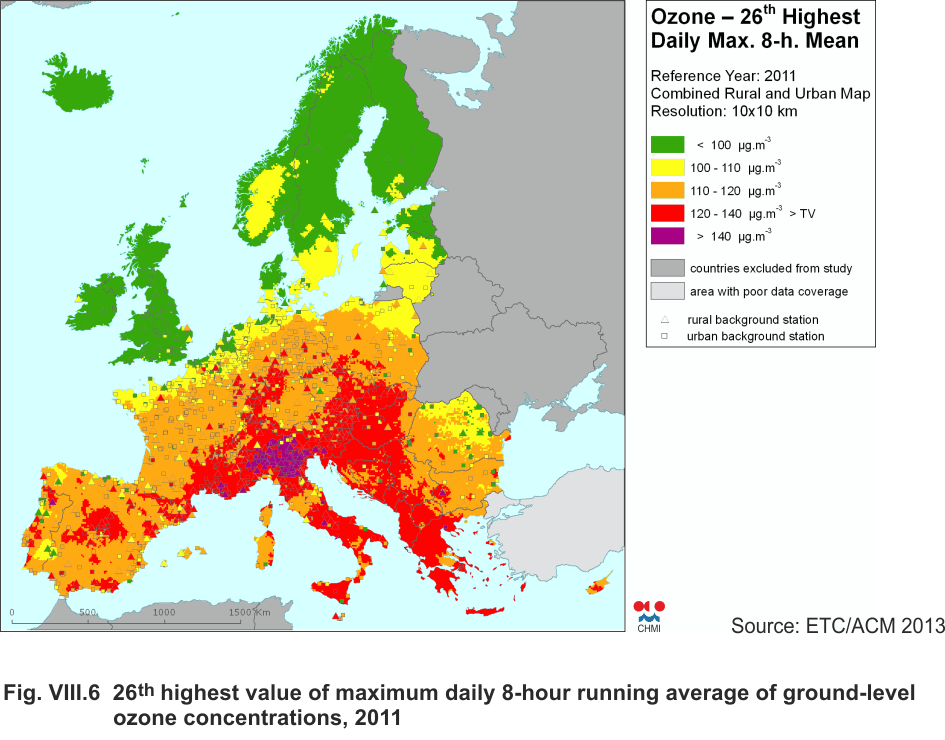
Fig. VIII.6 |
26th highest value of maximum daily 8-hour running
average of ground-level ozone concentrations,
2011(Source: ETC/ACM 2013) |
|
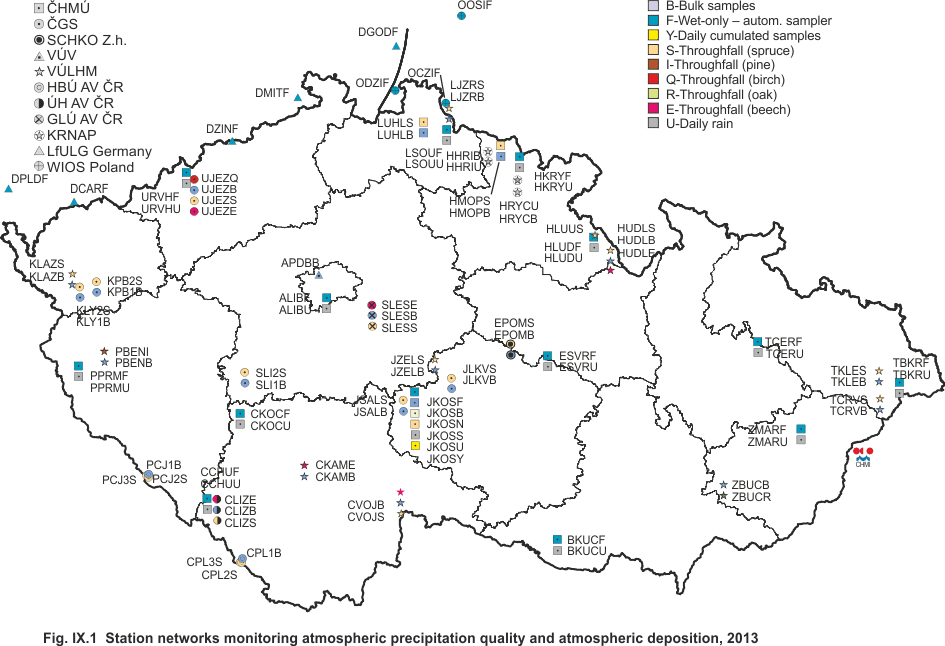
Fig. IX.1 |
Station networks monitoring atmospheric
precipitation quality and atmospheric deposition, 2013 |
|
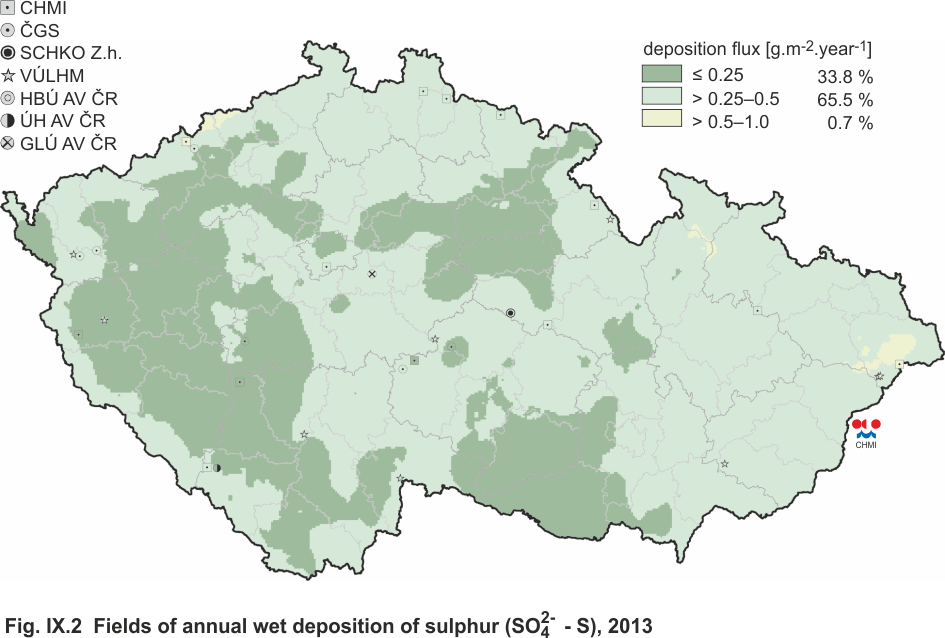
Fig. IX.2 |
Fields of annual wet deposition of sulphur (SO42- - S),
2013 |
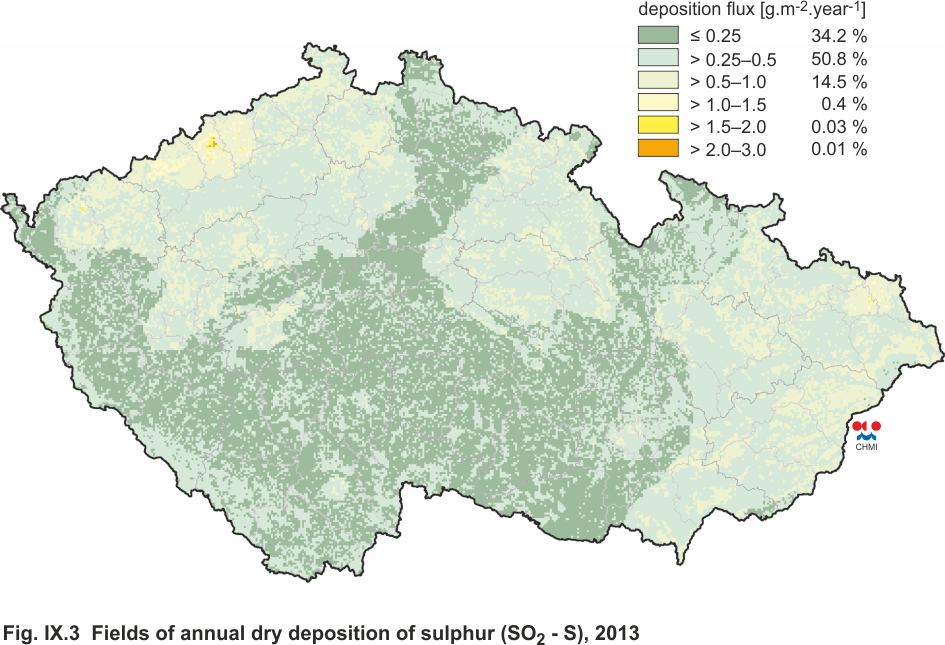
|
Fig. IX.3 |
Fields of annual dry deposition of sulphur (SO2 -
S), 2013 |
|
Fig. IX.4 |
Fields of annual total deposition of sulphur, 2013 |
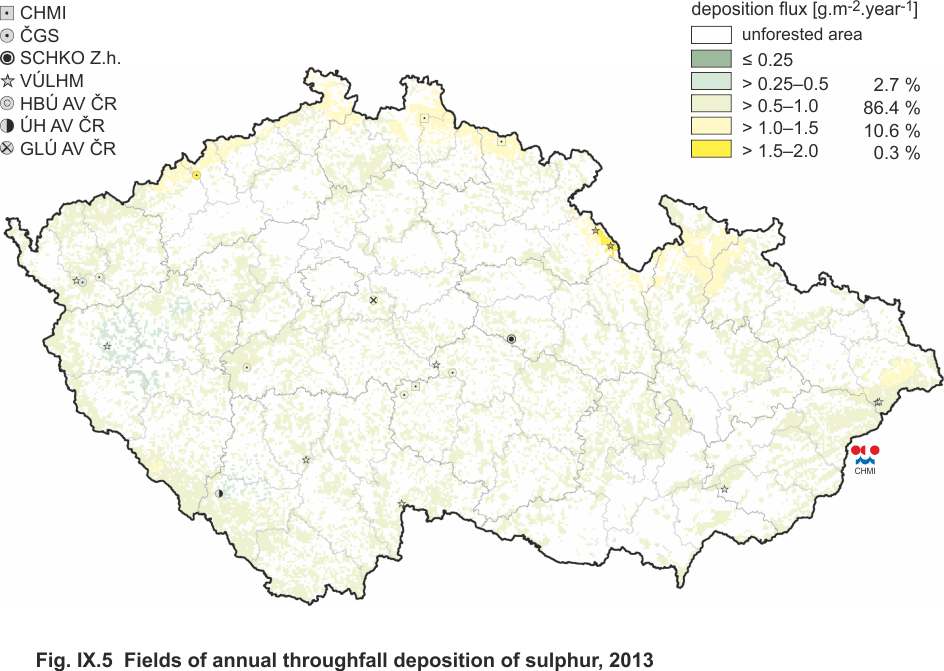
|
Fig. IX.5 |
Fields of annual throughfall deposition of sulphur,
2013 |
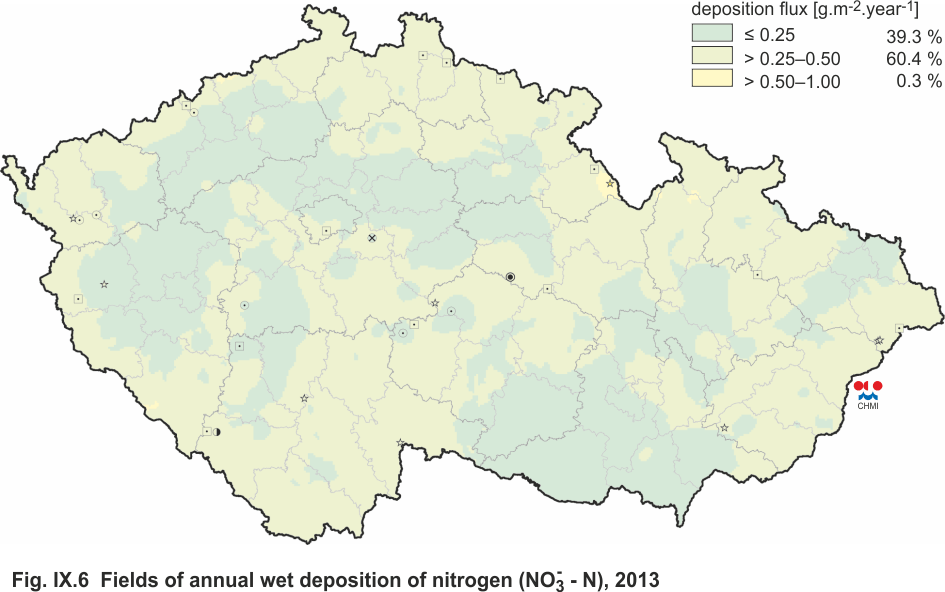
|
Fig. IX.6 |
Fields of annual wet deposition of nitrogen (NO3- -
N), 2013 |
|
Fig. IX.7 |
Fields of annual wet deposition of nitrogen (NH4+ -
N), 2013 |
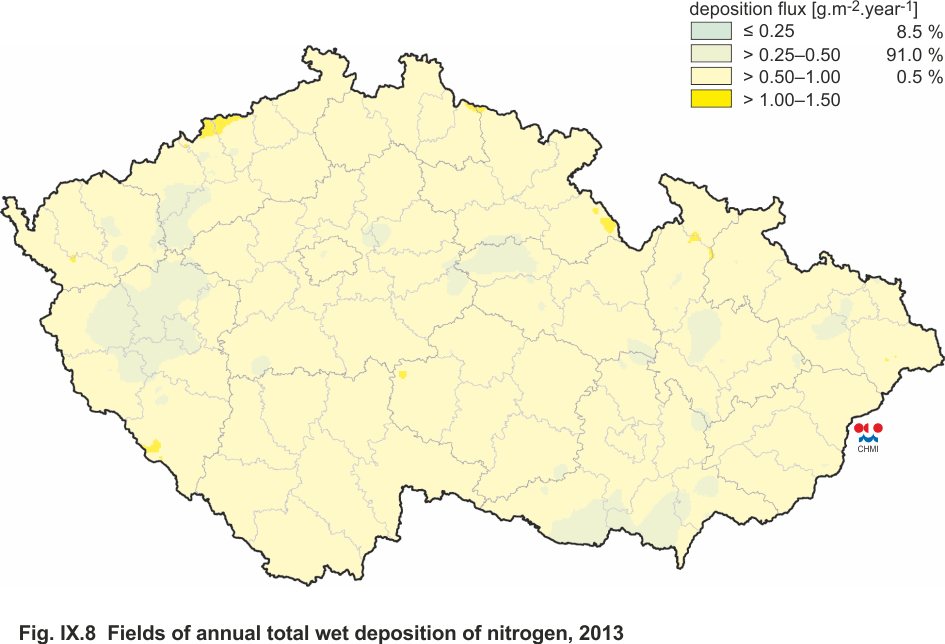
|
Fig. IX.8 |
Fields of annual total wet deposition of nitrogen,
2013 |
|
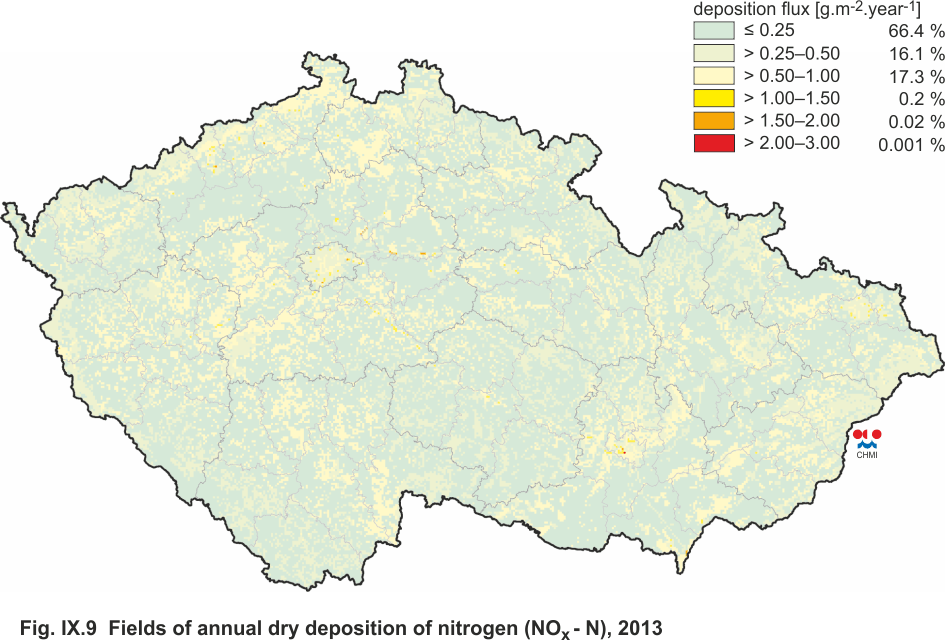
Fig. IX.9 |
Fields of annual dry deposition of nitrogen (NOx
- N),
2013 |
|
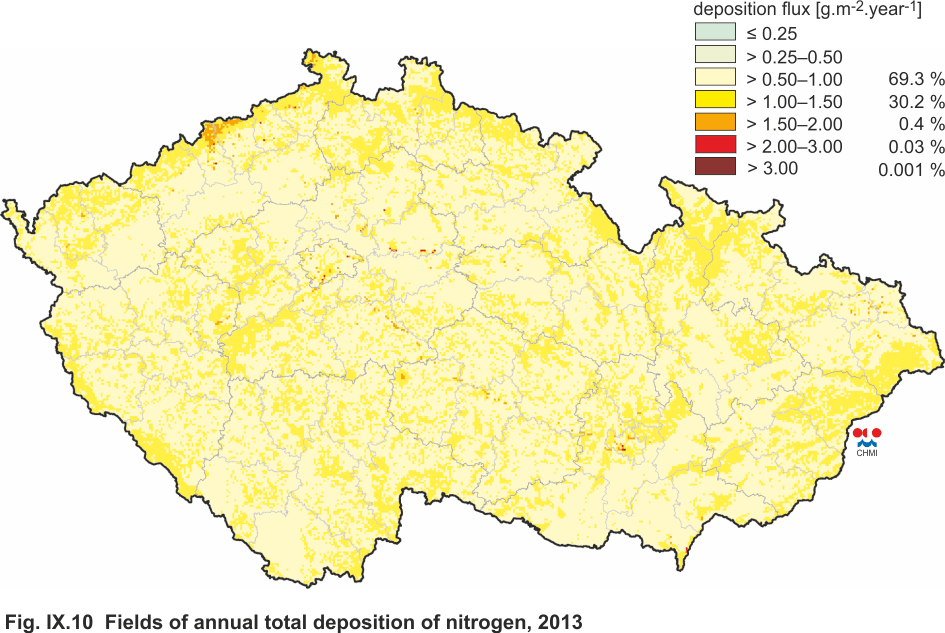
Fig. IX.10 |
Fields of annual total deposition of nitrogen, 2013 |
|
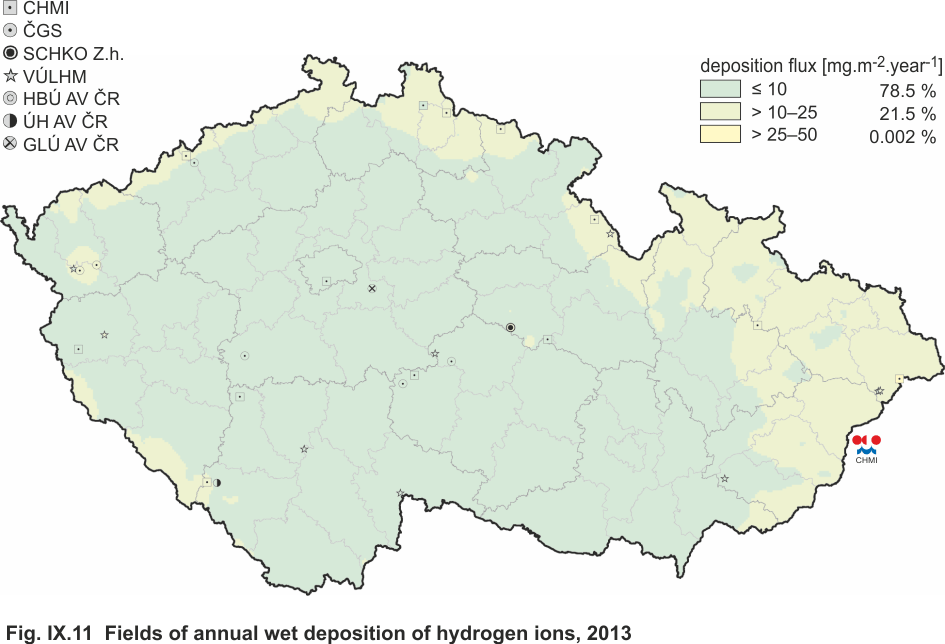
Fig. IX.11 |
Fields of annual wet deposition of hydrogen ions,
2013 |
|
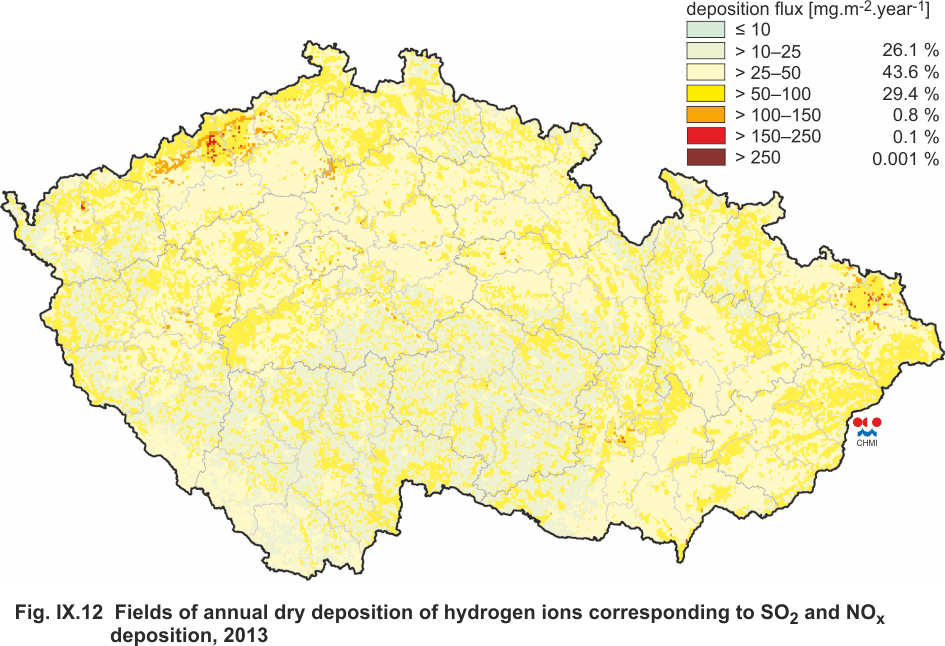
Fig. IX.12 |
Fields of annual dry deposition of hydrogen ions
corresponding to SO2 and NOx deposition, 2013 |
|
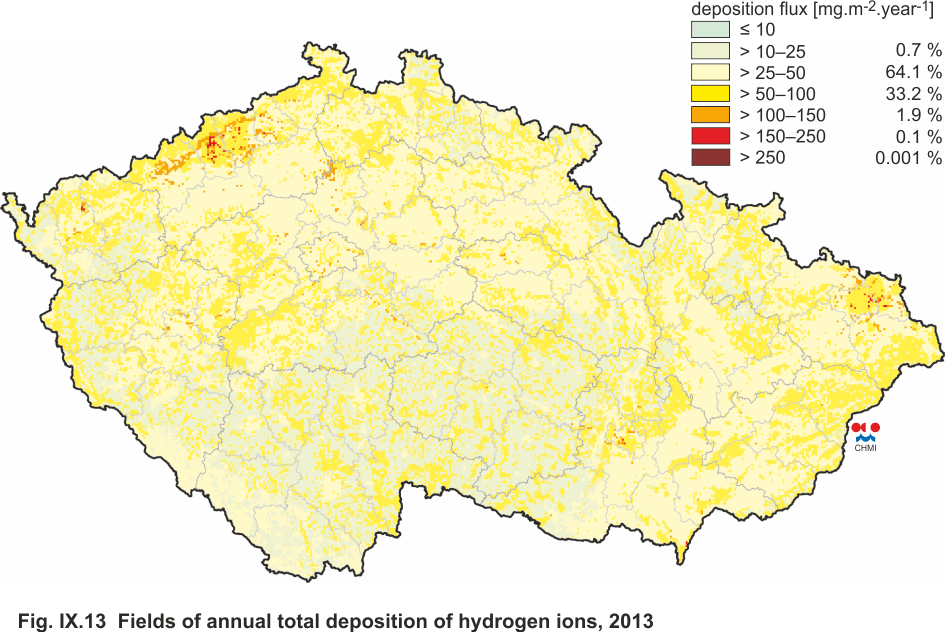
Fig. IX.13 |
Fields of annual total deposition of hydrogen ions,
2013 |
|
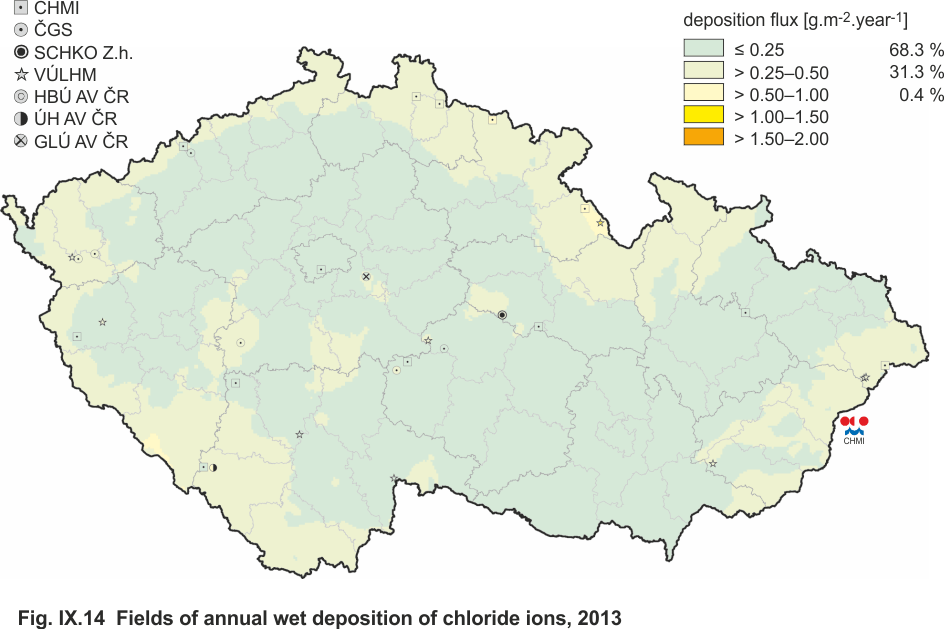
Fig. IX.14 |
Fields of annual wet deposition of chloride ions,,
2013 |
|
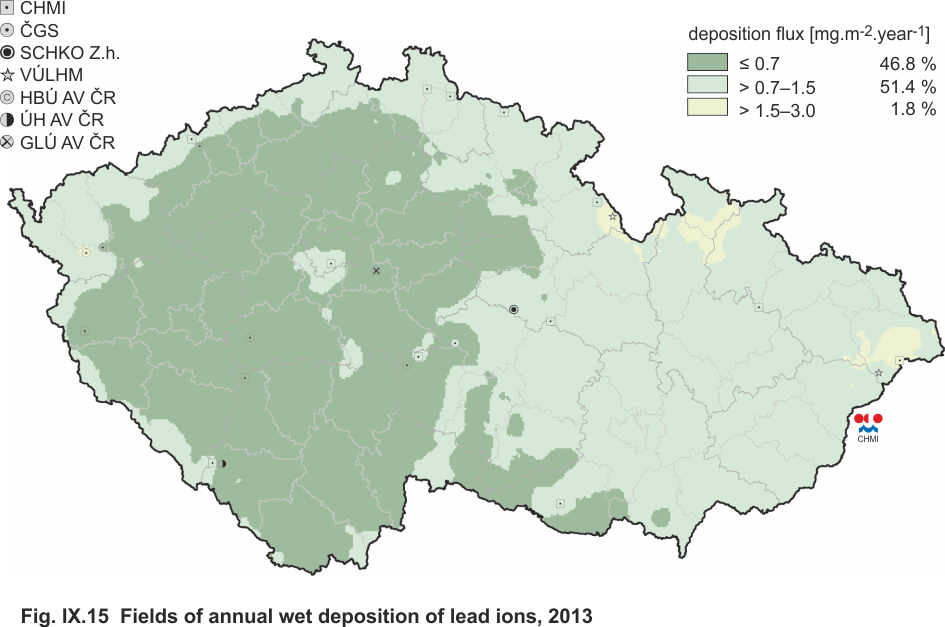
Fig. IX.15 |
Fields of annual wet deposition of lead ions, 2013 |
|
Fig. IX.16 |
Fields of annual dry deposition of lead, 2013 |
|
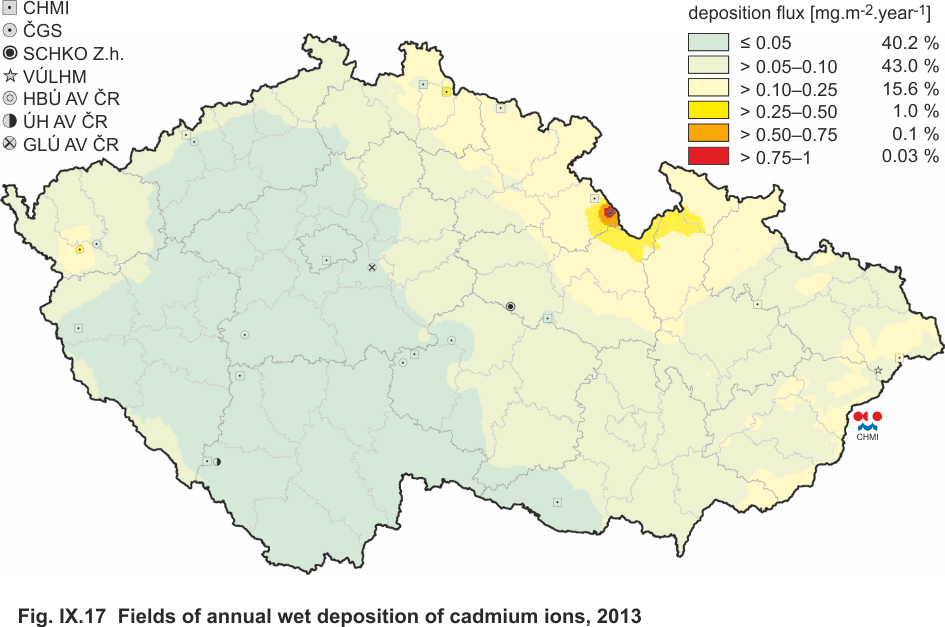
Fig. IX.17 |
Fields of annual wet deposition of cadmium ions,
2013 |
|
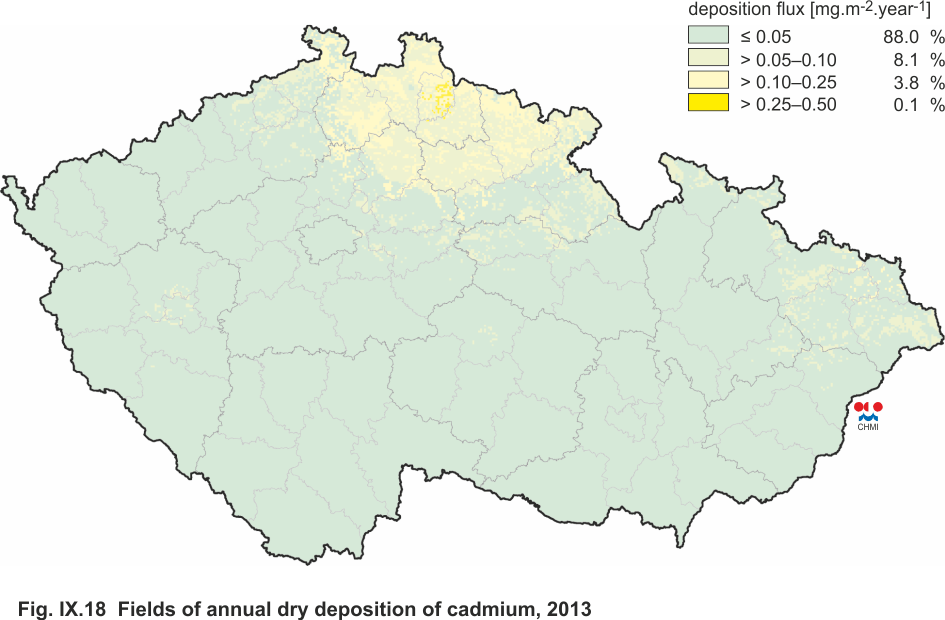
Fig. IX.18 |
Fields of annual dry deposition of cadmium, 2013 |
|
Fig. IX.19 |
Fields of annual wet deposition of nickel ions, 2013 |
|
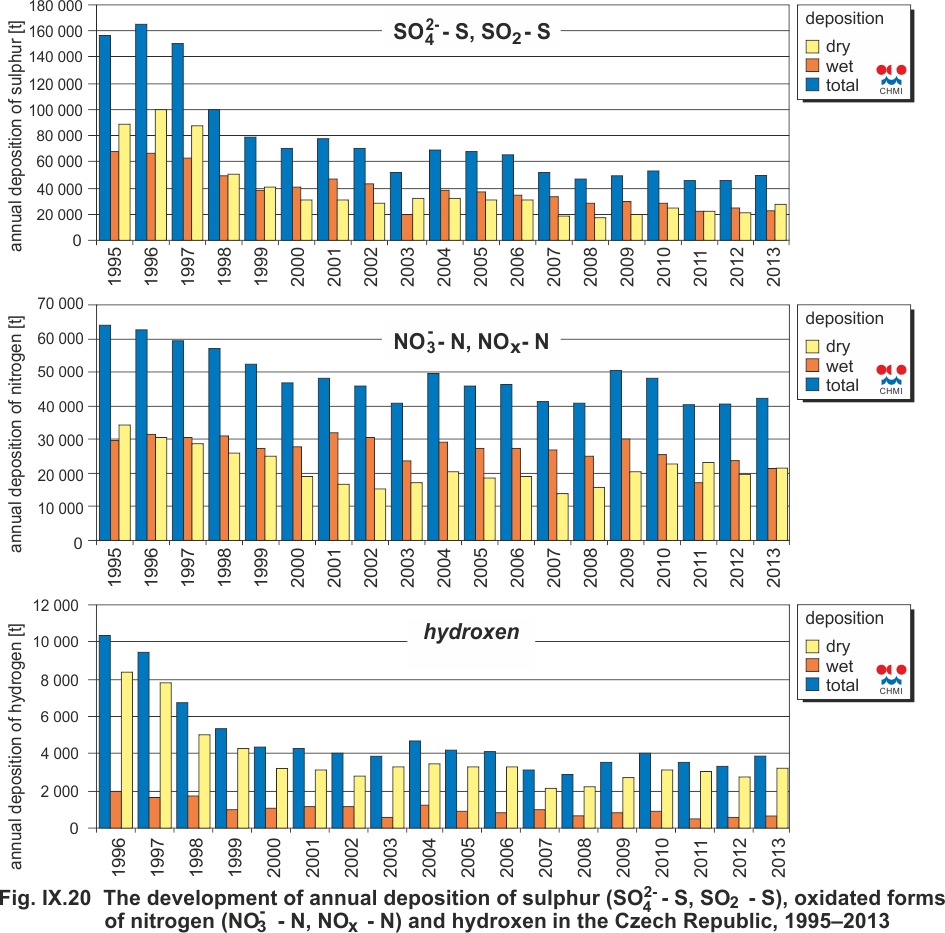
Fig. IX.20 |
The development of annual deposition of sulphur
(SO42- - S, SO2 - S) and oxidated forms of nitrogen (NO3-
- N,
NOx - N) and hydrogen in the Czech Republic, 1995–2013 |
|
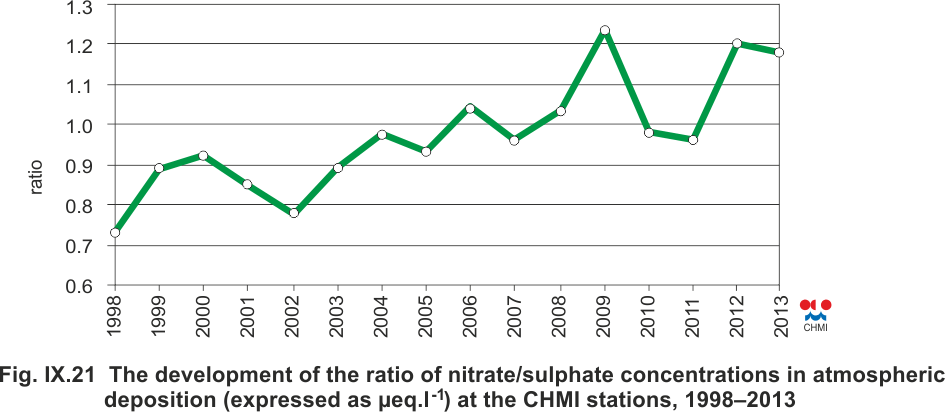
Fig. IX.21 |
The development of the ratio of nitrate/sulphate
concentrations in atmospheric deposition (expressed as µeq.
l-1) at the CHMI stations, 1998–2013 |
|
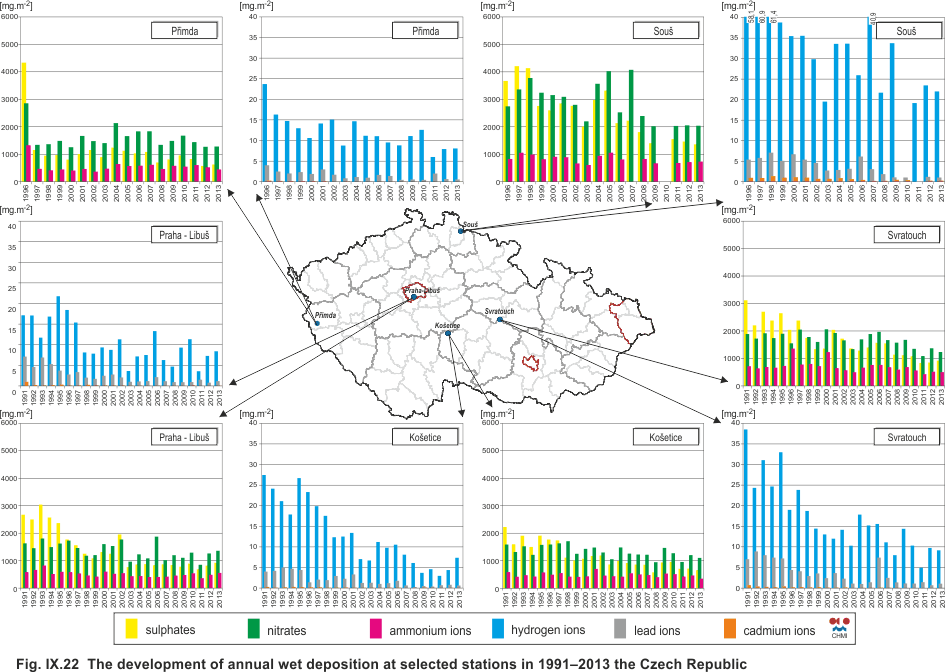
Fig. IX.22 |
The development of annual wet deposition at selected
stations in 1991–2013, Czech Republic |
|
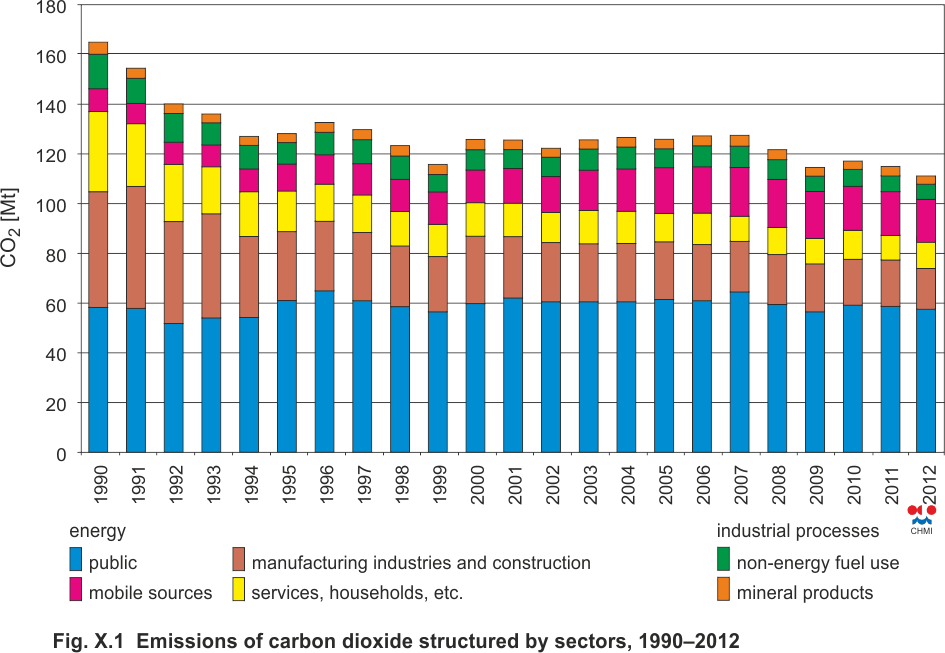
Fig. X.1 |
Emissions of carbon dioxide structured by sectors,
1990–2012 |
|
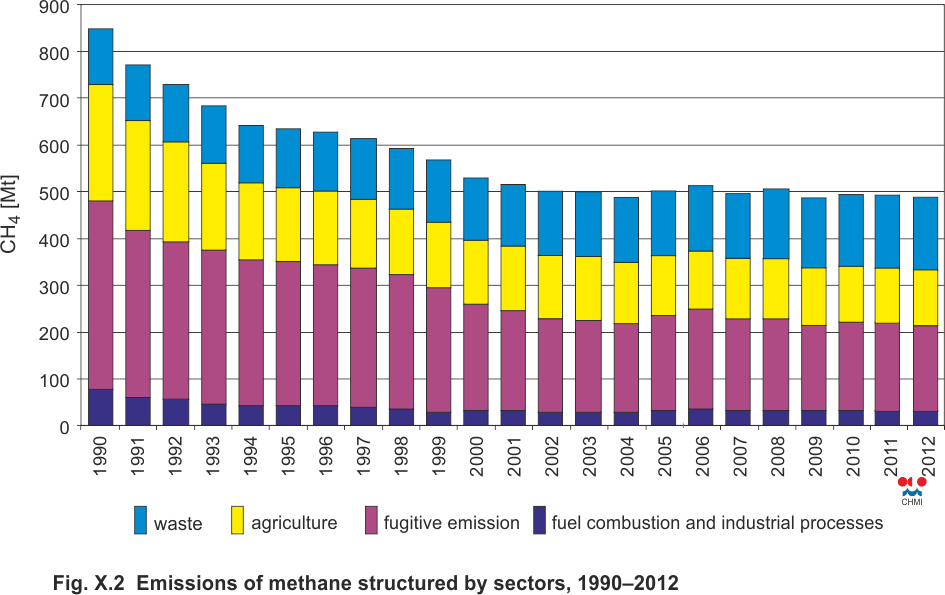
Fig. X.2 |
Emissions of methane structured by sectors,
1990–2012 |
|
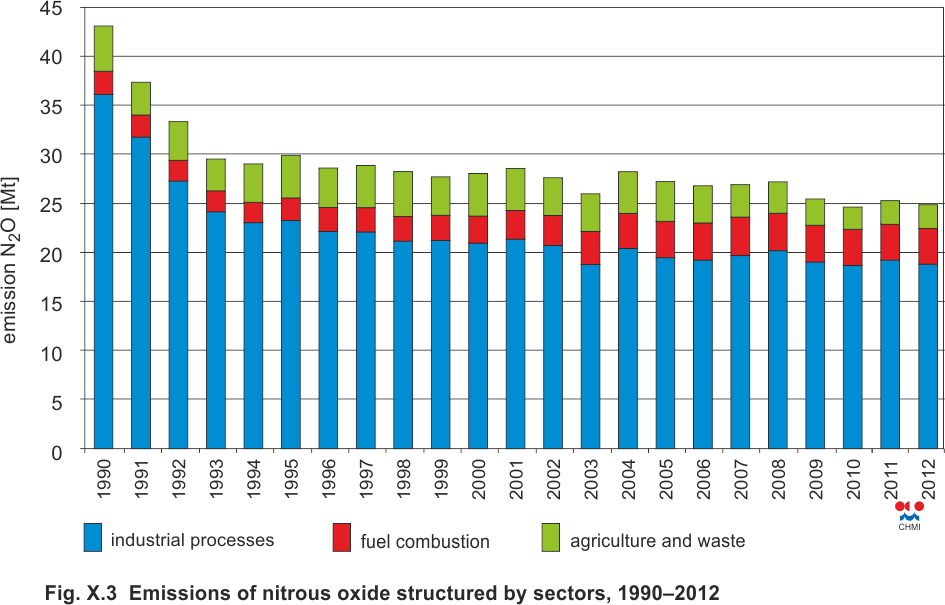
Fig. X.3 |
Emissions of nitrous oxide structured by sectors,
1990–2012 |
|
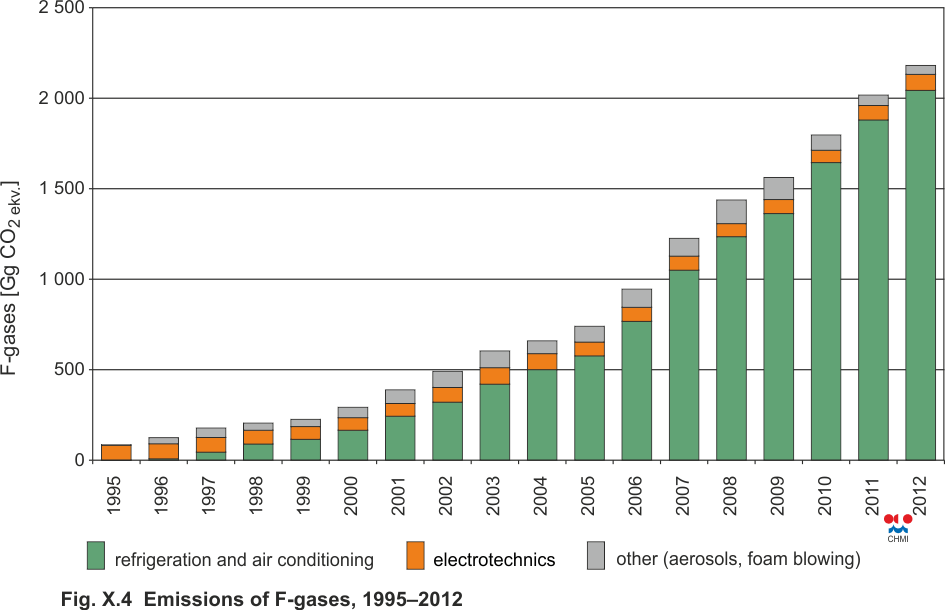
Fig. X.4 |
Emissions of F-gases, 1995–2012 |
|
Fig. X.5 |
Carbon dioxide emissions from the plants registered
in EU ETS, 2005–2013 |
|
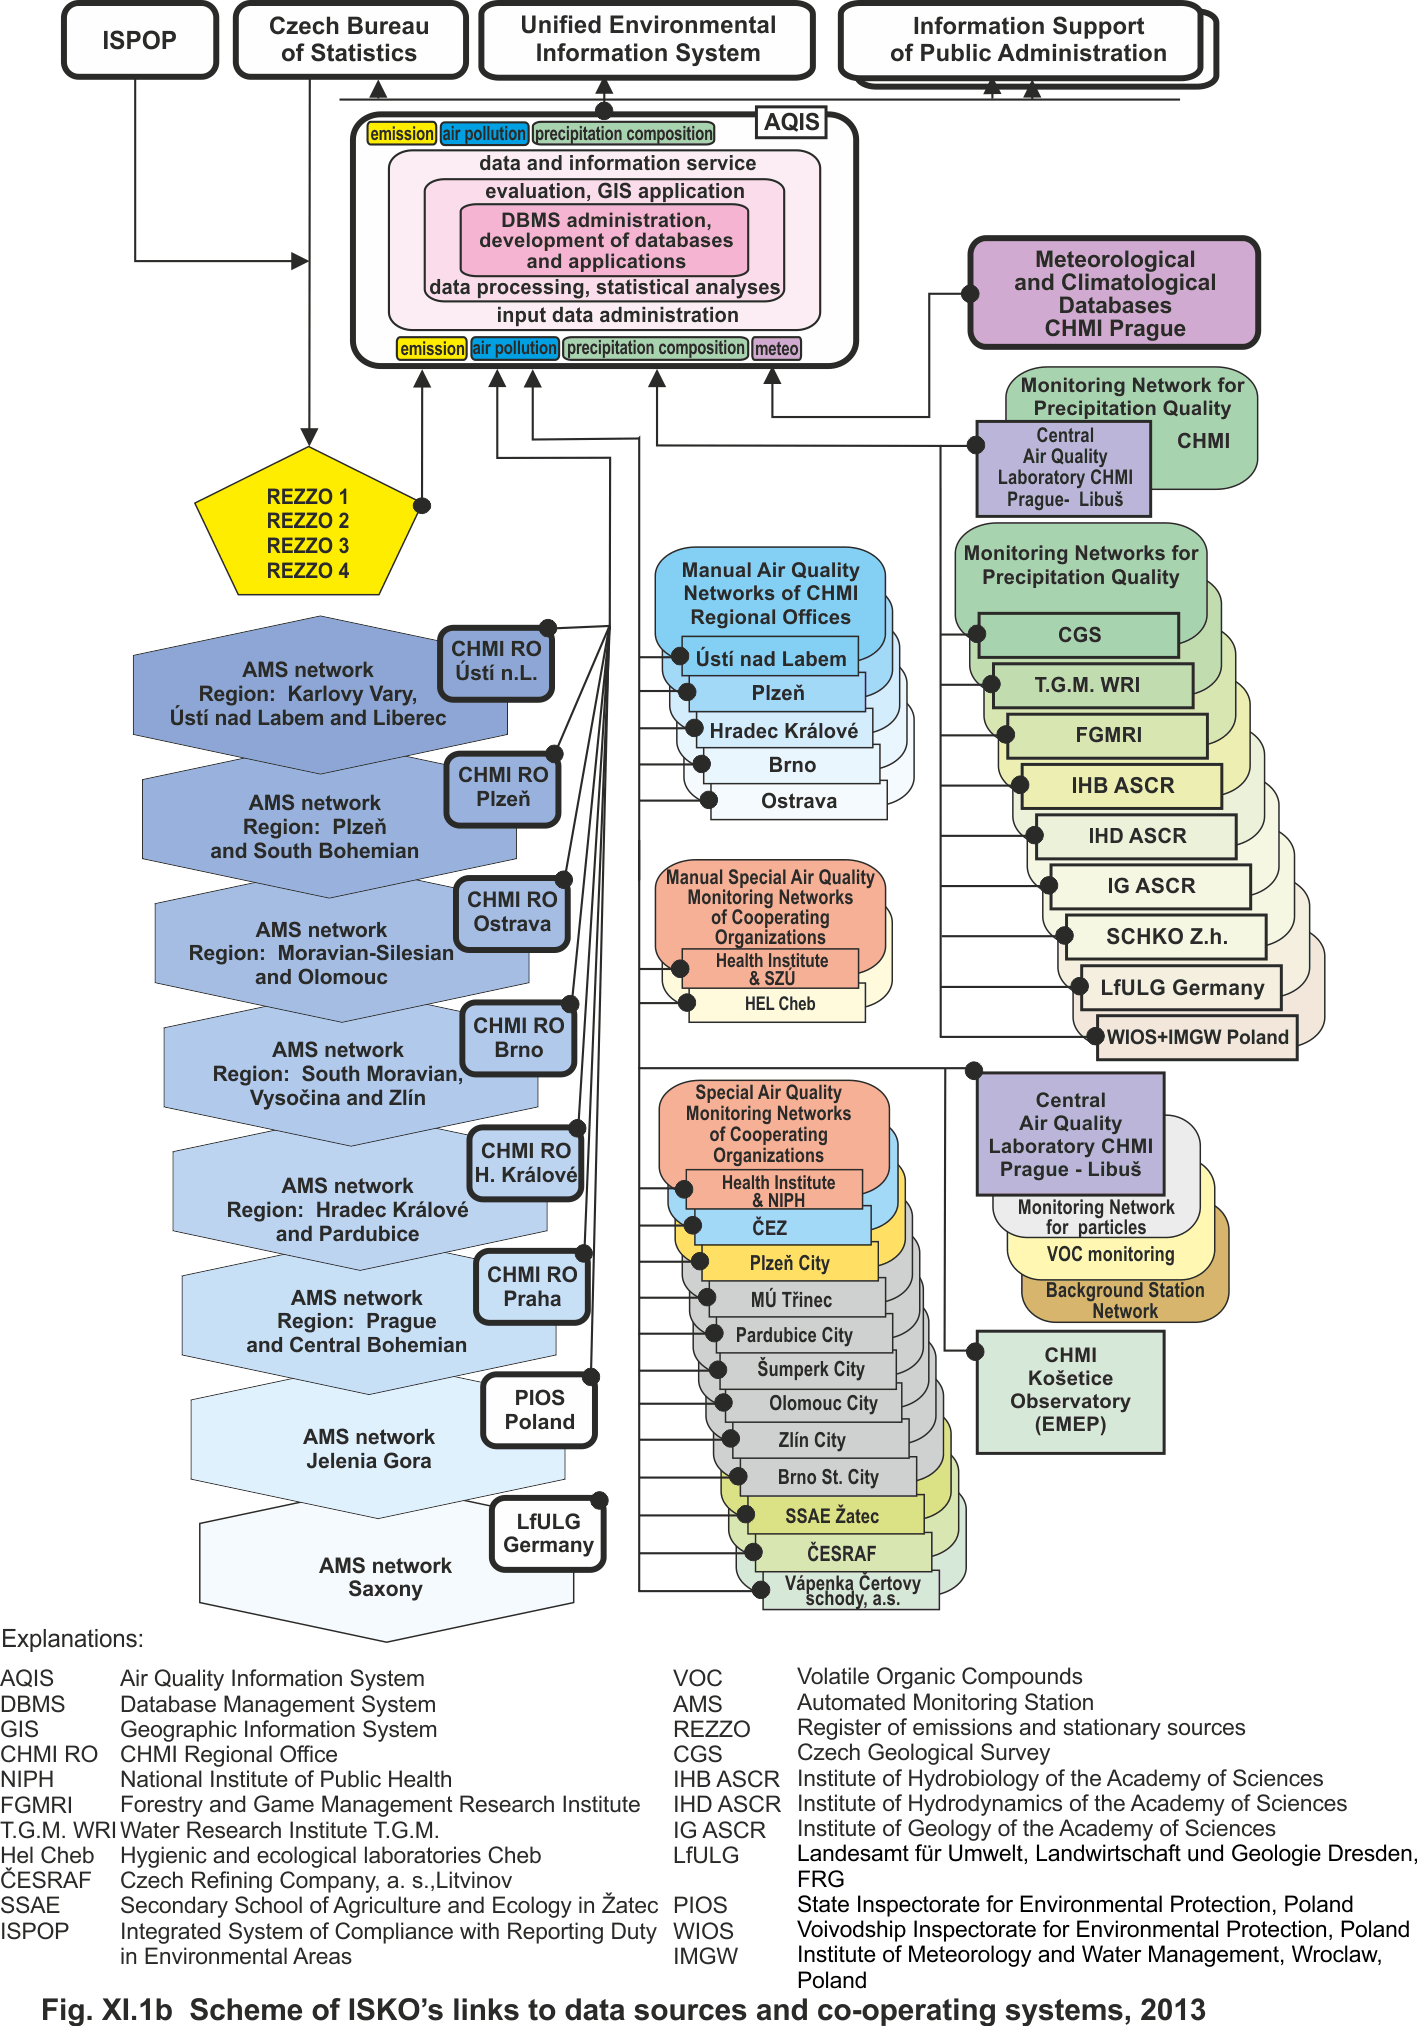
Fig. XI.1 |
Scheme of ISKO’s links to data sources and co-operating
systems 2013 |
|
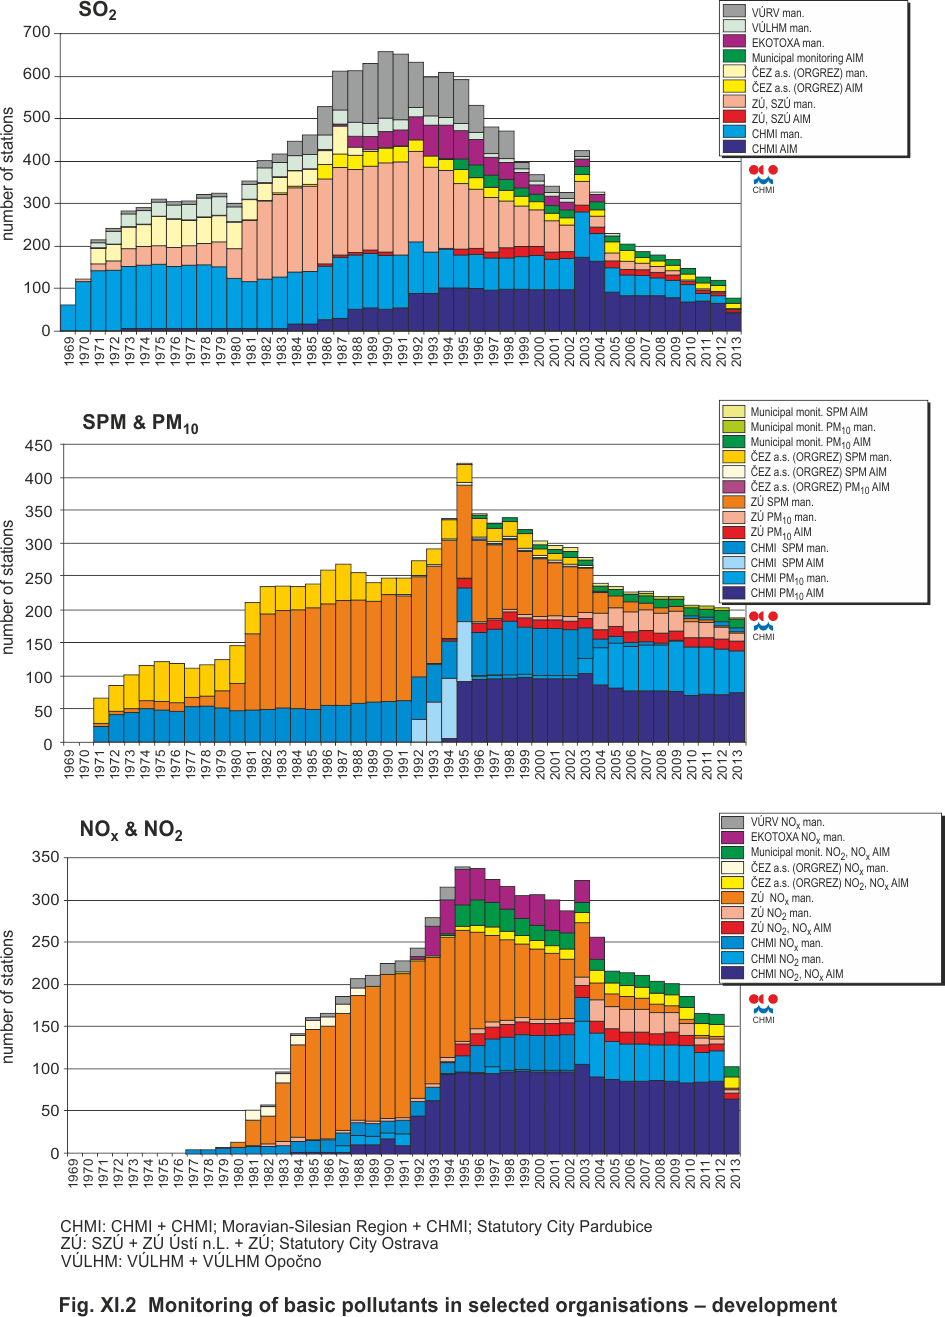
Fig. XI.2 |
Monitoring of basic pollutants in selected
organisations – development |
|
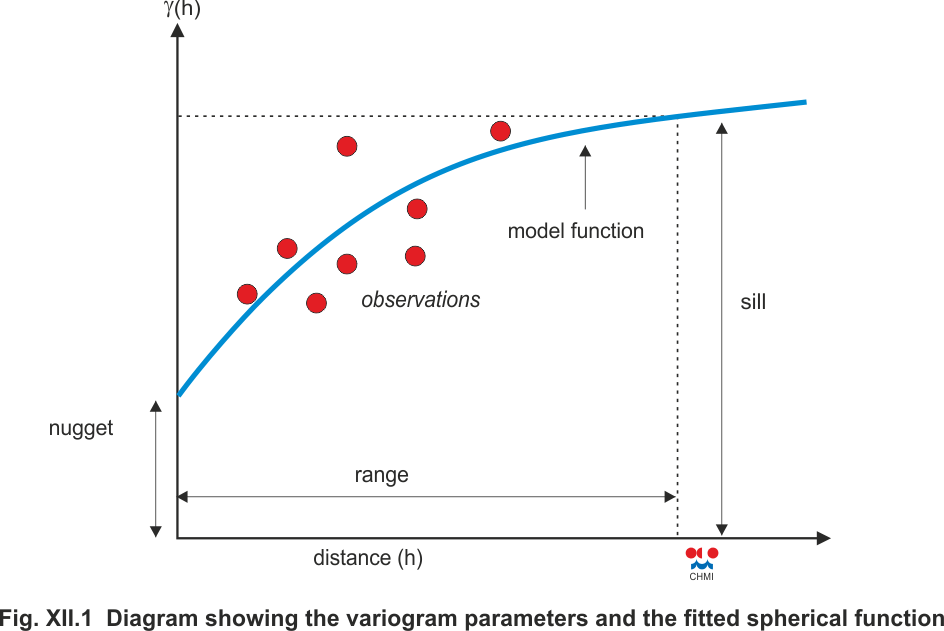
Fig. XII.1 |
Diagram showing the variogram parameters and the
fitted spherical functions in 2013 |