III. METEOROLOGICAL AND DISPERSION CONDITIONS
Ambient air quality is influenced, in addition to air pollution sources, by meteorological conditions. They affect the amount of emissions from anthropogenic and natural sources, they determine the dispersion conditions, affect the formation of secondary pollutants in the ambient air and the removal of pollutants from the air.
The influence of meteorological conditions on emissions
As concerns anthropogenic emissions, meteorological
conditions have the greatest influence on emissions from heating.
Emissions from heating are estimated according to the number of
heating days and the temperatures measured during them. The
thermal energy supply system is regulated by the Decree No.
194/2007 Coll.1 The behaviour of
households with their own combustion systems is of course
different from that of the central suppliers of thermal energy.
Therefore, this yearbook, unlike the above Decree, understands
the heating days as the days, in which the average daily
temperature in the given site decreased below 13 °C. The
temperature conditions in the heating season (January–May,
September– December) or in its part are characterized by the so
called degree days – i.e. the sum of the differences of the
reference indoor temperature and the average daily outdoor
temperature in the heating days:
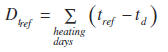
where Dtref are degree days, tref is
the reference indoor air temperature (21 °C) and td
is the average daily temperature in individual heating days. The
degree days for the territory of the Czech Republic presented
below (Figs. III.1 and
III.4) correspond to the average values
from more than 200 climatological stations operated by CHMI.
Based on the evaluation carried out in the previous years (CHMI
2013a) it can be stated that higher consumption of solid fuels
and natural gas in 2010 and their lower consumption in 2000
correspond to highly above the-normal and below-the-normal
values of degree
days in the these years, respectively (Fig. III.1).
Low temperature may increase combustion emissions from motor
vehicles, especially during cold starts (Vojtíšek 2013, Chan et
al. 2013, ATEM 2012). Also emissions of volatile organic
compounds from solvents and storing and distribution of petrol
are dependent on temperature. Temperature and the
photosynthetically active component of solar radiation influence
biogenic emissions of non-methanic volatile organic compounds (e.g.
isoprene and terpenes), which serve as the precursor of
secondary organic aerosols and ground-level ozone. Mainly
emissions from forest vegetation are significant (e.g. Zemánková
et al. 2010, Bednář et al. 2013). Wind (with velocity approx.
above 4 m.s-1) can cause the swirling of the already
settled dust and result in the increasing resuspension of
already settled particles. Meteorological conditions influence
also volatilization of persistent organic pollutants from soil,
where they got mainly due to agricultural activities.
The influence of meteorological conditions on dispersion
conditions
Dispersion conditions are determined primarily by the
stability of the mixing layer of the atmosphere and the flow
velocity. The mixing layer is the part of the atmosphere
adjacent to the earth’s surface where, due to the interaction
with earth’s surface, mechanical and thermic turbulence is
developed and intensive vertical transfer of momentum, heat,
water vapour and pollutants occur.
The greater the stability of the mixing layer, the greater the
ability of the atmosphere to supress the initial vertical
deviation of the volume of air and thus prevent vertical mixing.
The stability depends on the course of the temperature with the
height. In most stable situations the air temperature increases
with the height (inversion stratification) and the conditions
for vertical mixing are least favourable. In unstable
stratification the temperature decreases with the height more
quickly than would correspond to the normal conditions in the
atmosphere. This is manifested as regular thermic convection and
thermic turbulence caused by Archimedean forces involved in the
field of turbulent air fluctuations (Bednář 2008). The
horizontal dispersion of emissions is influenced by wind
velocity and wind direction. Moreover, strong wind results in
the development of mechanical turbulence and thus contributes to
vertical mixing of layers.
One of the ways to quantify dispersion conditions is the so
called ventilation index (VI), which corresponds to the
product of the height of the mixing layer of the atmosphere and
the average wind velocity in it.
The average wind velocity in this layer is related to the
horizontal dispersion of emissions. The ventilation index
expressed in this way reaches in the conditions of the CR the
usual values from hundreds to 30,000 m2.s-1;
the values above 3,000 m2.s-1 indicate
good dispersion conditions, the values between 1,100 and 3,000 m2.s-1
indicate moderately poor dispersion conditions and the values
below 1,100 m2.s-1 indicate poor
dispersion conditions. The situation with poor dispersion
conditions does not necessarily mean the occurrence of high
concentrations of pollutants. On the contrary, however, we can
state that a significant and extensive exceedance of limit
values occur almost exclusively during moderately poor and poor
dispersion conditions. The occurrence frequency of the types of
dispersion conditions has a characteristic daily course (Fig.
III.2). This course is most marked in the warm half of the year,
and, on the contrary, almost imperceptible in the winter months.
The annual course of the occurrence frequencies of dispersion
conditions at the station Prague-Libuš is depicted in
Fig.
III.3.
The influence of meteorological conditions on the formation of
secondary pollutants and chemism
Meteorological conditions, in particular temperature, relative air humidity and solar radiation, directly influence the chemical and physical processes occurring between the pollutants in the atmosphere (e.g. Baek et al. 2004). The influence of meteorological conditions can be also indirect, e.g. due to the intensive mixing the emitted substances are diluted and consequently, the rate of reactions is decreased. There is a decisive factor for the course of photochemical reactions, and namely solar radiation. In summer periods, high temperatures and mainly intensive solar radiation result in high concentrations of ozone (Blažek et al. 2013).
Removal of pollutants
The pollutants are removed from the atmosphere through dry and wet deposition. During wet deposition the pollutants are washed out of the atmosphere to the earth’s surface by precipitation. Wet deposition is divided into in-cloud deposition taking place within a cloud and involving the dilution of gaseous substances, capture of aerosol particles or their use as condensation nuclei, and below-cloud deposition during which the particles are captured and gaseous substances are diluted in already falling drops. The effectiveness of the wash-out depends on the duration, type and intensity of precipitation. Dry deposition includes all other processes, and although its intensity is lower than that of wet deposition, in a longer time period it can decisively contribute to the removal of pollutants from the atmosphere.
Meteorological conditions in the year 2013
As concerns the temperatures the year 2013 was
slightly above the normal in the territory of the CR with the
average annual temperature 7.9 °C, which is 0.4 °C above the
long-term normal of the period 1961–1990. In comparison with the
normal, particularly the month of March was colder, with the
average temperature –0.7 °C (3.2 °C below the normal). March
deviations from the normal in individual regions ranged from
–4.7 °C in the Karlovy Vary region up to –2.6 °C in the South
Moravia region. On the contrary, July was extremely supernormal
with the countrywide average 19.4 °C (2.5 °C above the normal)
and further also December and November (2.2 and 1.4 °C above the
normal, respectively). The deviations from the normal in
individual regions ranged from +2 to +3.2 °C in July and from
+1.6 to +3.1 °C in December.
The comparison of the degree days in individual months of the
heating season shows that in 2013, as against the long-term
average of the period 1983–2012 the production of emissions from
heating was higher in March, May and September, and, on the
contrary, it was slightly lower from October to December (Fig.
III.4). As a whole, the year 2013 was slightly above the normal
(Fig. III.1).
As concerns precipitation the year 2013 with the average
total precipitation of 727 mm (108 % of the long-term average of
the period 1961–1990) was normal, nevertheless individual months
were different from the normal. December, June, April and
November were below the normal (December totals ranged from 29 %
in the Central Bohemia region and in Prague up to 60 % of the
normal in the Liberec region), the above-the-normal values were
recorded mainly in June and May and also January, February and
September. In June the precipitation totals ranged from 117 % of
the normal in the Zlín region up to 219 % in the Central Bohemia
region and in Prague (ČHMÚ 2013c).
The representation of the types of dispersion conditions
in individual months of the year 2013 at the stations Prague-Libuš
and Prostějov is presented in
Fig. III.5. These two stations
were chosen because they carry out aerological sounding and thus
the respective ventilation index can be calculated. Moreover,
the station Prague-Libuš can be to a certain extent regarded as
a representative station for Bohemia and the station Prostějov
for Moravia. At the station Prague-Libuš the share of good
dispersion conditions decreased in February 2013 as compared
with the period 2004–20122 by 18 %.
Further, their occurrence was lower not only in January and
March, but also in July and August (the periods with high ozone
concentrations). On the contrary, good dispersion conditions
occurred more frequently than usual, in the months September–November.
At the station Prostějov good dispersion conditions below the
normal occurred mainly in April (by 11 %; in the same month,
however, the occurrence of moderately poor dispersion conditions
increased) and in January. In March the occurrence of poor
dispersion conditions increased at the expense of moderately
poor conditions. Better dispersion conditions occurred mainly in
July and October (Table III.1).
High ozone concentrations in July/August 2013
In 2013 four periods of high ozone concentrations occurred:
in April (mainly from 24 to 27 April), June (mainly from 17 to
21 June) and in July and August (mainly from 16 July to 6
August). The detailed analysis of the period from 1 July to 31
August 2013 is presented below; at the station Prague-Libuš
there occurred 21 of the total number of 23 days with daily
maxima of the running 8-hour averages of ozone concentrations
exceeding 120 µg.m-3 and all days with the maximum 1-hour
concentrations above 180 µg.m-3.
High concentrations at the station Prague-Libuš occurred during
the days with the above-the-normal temperatures and sunshine
duration of 10–15 hours and the prevailing moderately poor to
poor dispersion conditions. The periods from 22 to 28 July and
from 2 to 6 August were characterized by high number of tropical
days, i.e. the days with the maximum temperature above 30 °C (Fig.
III.63). The figure also
shows that the intensive precipitation activity does not exclude
high ozone concentrations, if its origin is in convective
cloudiness, and sunshine duration is not markedly limited (see
also Blažek et al. 2013).
In the period from 6 to 23 July the weather in the territory of
the CR was influenced by northwestern and later by northeastern
anticyclonic situation, only on 11 and 12 July the territory was
under the influence of northern cyclonic situation. Anticyclonic
situations continued for the remaining part of the period,
however, they were interrupted by low pressure troughs of
different duration. From 26 to 29 July (smog situation for
Prague and Central Bohemia region – see Chapter VI Smog warning
and regulatory system) central Europe was influenced by a weak
field of higher air pressure in which tropical air flowed over
the territory of the CR from southwest. The inflow of tropical
air was stopped by the undulated cold front influencing the
territory of the CR on 28 July from northwest and on 29 July it
moved across the territory of the CR further towards southeast.
On 3 August (the announcement of the second smog situation for
Prague and Central Bohemia region) tropical air from the south
flowed in the rear of the anticyclone to the territory of the CR,
the low pressure trough proceeded from Germany to Bohemia. In
the evening the territory of the CR was influenced by undulated
cold front from northeast which on 4 August moved across the
territory of the CR towards the east. Starting from 6 August
cold front undulated above Germany and tropical air from the
south proceeded to the territory of the CR in its front side, on
8 and on 9 August this undulated cold front moved across the
territory of the CR eastwards.
High concentrations of PM10 in January and February
2013
At the beginning of the year 2013 there occurred three
extensive episodes with high concentrations of PM10, and namely
13–28 January, 12–18 February and 20–28 February (the last
situation was however limited predominantly to the Moravia-Silesia
region). The autumn episodes 6–14 October and 12–23 November
were also limited largely to the areas of northern Moravia.
The prevailing part of the January and February episodes the
territory of the CR was influenced by low-pressure areas (Fig.
III.74). High concentrations of PM10
in the winter period are thus not
necessarily connected exclusively with the field of high
pressure, although the absolute maximum concentrations are
mostly reached during anticyclonic situations of eastern and
southeastern types in the CR. During these three episodes poor
to moderately poor dispersion conditions prevailed, and the
temperatures, particularly in the second half of January, were
far below the long-term average. High concentrations on 15 and
16 February were connected with very poor dispersion conditions.
Markedly below-the-average temperatures in March did not result
in markedly increased concentrations because from 14 March there
were significantly good dispersion conditions – see
Fig. III.85
which shows the complete overview of the annual course of
temperatures, dispersion conditions and concentrations of ozone
and PM10in the agglomeration of
Ostrava/Karviná/Frýdek-Místek.
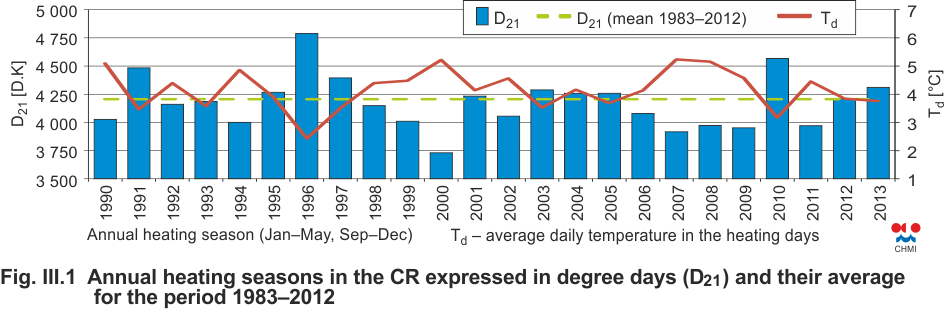
Fig. III.1 Annual heating seasons in the CR expressed in
degree days (D21) and their average for the period 1983–2012
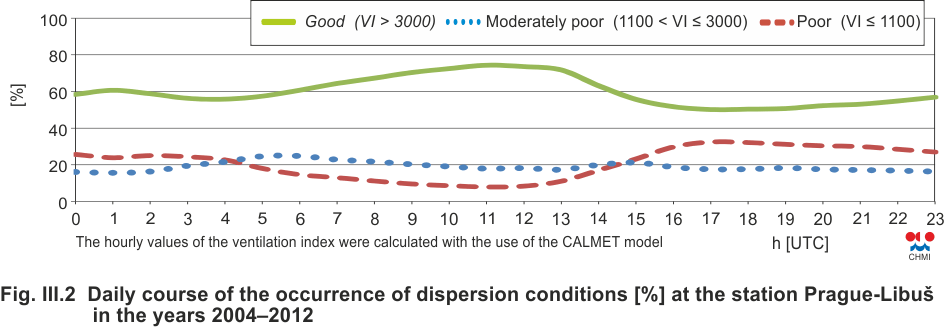
Fig. III.2 Daily course of the occurrence of dispersion
conditions [%] at the station Prague-Libuš in the years
2004–2012
Fig. III.3 Annual course of the occurrence of dispersion
conditions (%) at the station Prague-Libuš in the years
2004–2012
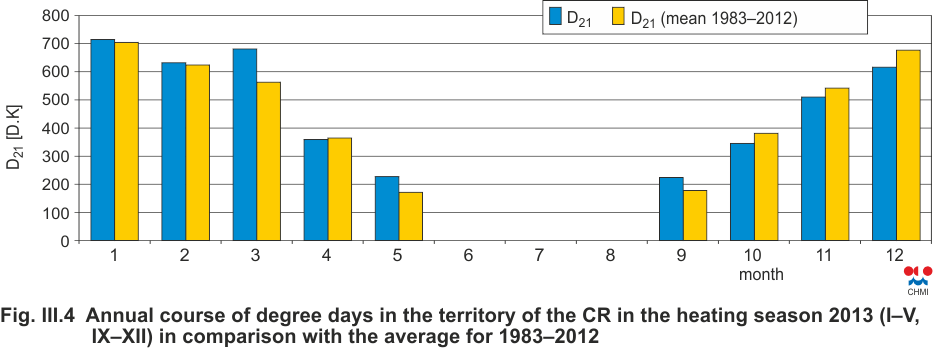
Fig. III.4 Annual course of degree days in the territory of
the CR in the heating season 2013 (I–V, IX–XII) in comparison
with the average for 1983–2012

Fig. III.5 Annual course of the occurrence of dispersion
conditions at the stations Prague-Libuš and Prostějov in the
year 2013
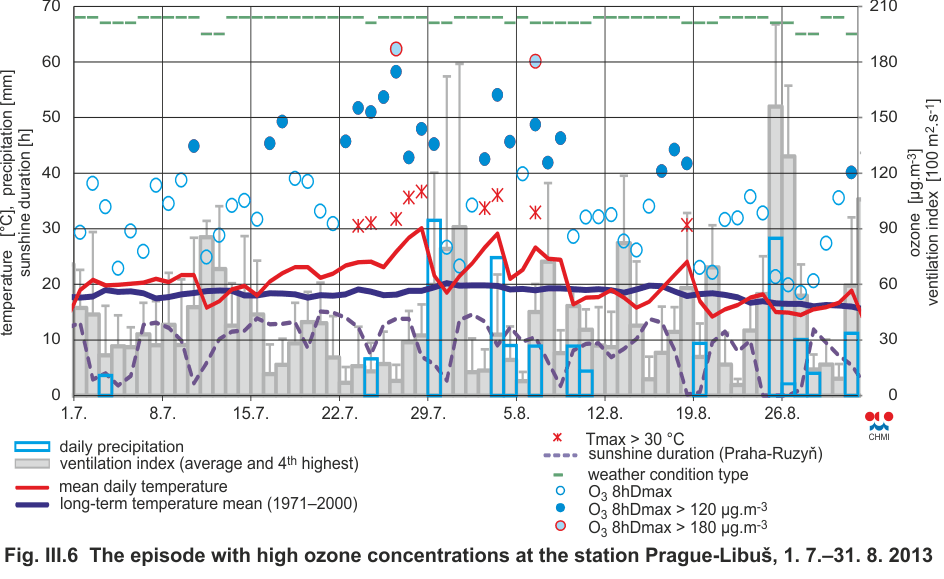
Fig. III.6 The episode with high ozone concentrations at the
station Prague-Libuš, 1. 7.–31. 8. 2013
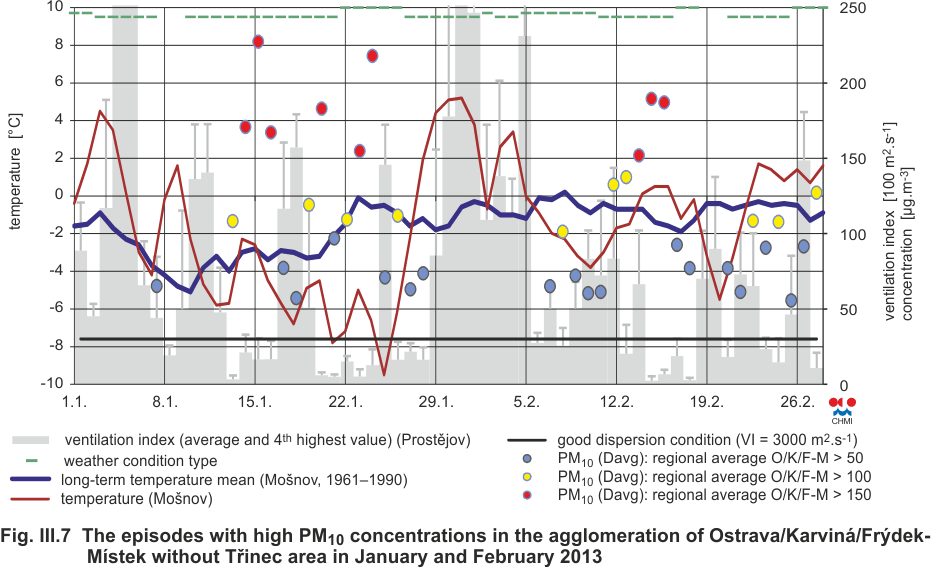
Fig. III.7 The episodes with high PM10
concentrations in the agglomeration of Ostrava/Karviná/Frýdek-
Místek without Třinec area in January and February 2013

Fig. III.8 Temperature, dispersion conditions, types of weather situations and concentrations of PM10 and O3 in the agglomeration of Ostrava/Karviná/Frýdek-Místek without Třinec area
1According to Decree No. 194/2007
Coll. the heat supply will start in the heating season (i.e. the
period from 1 September to 31 May) if the average daily outdoor
air temperature at the site decreases below +13 °C in two
consecutive days and according to the weather development the
increase of temperature above +13 °C is not expected for the
next day. Heating in the heating season will be reduced or
interrupted if the average daily outdoor air temperature at the
relevant site or locality rises above +13 °C in two consecutive
days and the decrease of temperature is not expected according
to the weather development for the next day. At a subsequent
decrease of the average daily outdoor air temperature below +13
°C, the heating is started again.
2This period was chosen due to the
available aerological sounding at the station Prostějov.
3For maximum daily temperatures
only the values exceeding 30 °C (tropical days) are presented.
Green bars indicate the type of weather situation (the highest
ones represent the anticyclonic type, the lower ones the low
pressure troughs and the lowest ones the cyclonic situations).
As for the ventilation index, the average for each day and the 4th
highest 1-hour value are presented. Sunshine duration at the
station Prague-Libuš is not measured, therefore data from the
station Prague-Ruzyně were used. The temperature at the station
Prague-Libuš has been measured only since the year 1971.
4For PM10 only daily
averages of the SVRS stations (see Chapter VI Smog warning and
regulatory system) in the agglomeration of O/K/F-M without
Třinec area exceeding 50 µg.m-3 are shown. Green bars
indicate the type of weather situation (the highest ones
represent the anticyclonic type, the lower ones the low pressure
troughs and the lowest ones the cyclonic situations). As for the
ventilation index, the median for each day and 83.3th
percentile corresponding to the 4th highest 1-hour
value are presented.
5Regional averages of daily
concentrations of PM10 and daily maximum running 8-hour averages
of O3 are calculated from the SVRS stations (agglomeration of
O/K/F-M without Třinec area for PM10 and agglomeration of
O/K/F-M for ozone). Green bars indicate the type of weather
situation (the highest ones represent the anticyclonic type, the
lower ones the low pressure troughs and the lowest ones the
cyclonic situations). As for the ventilation index the 4th highest hourly value is presented for each day.