Updated: 2025-12-15 00:27 CET
Locality
| Locality: |
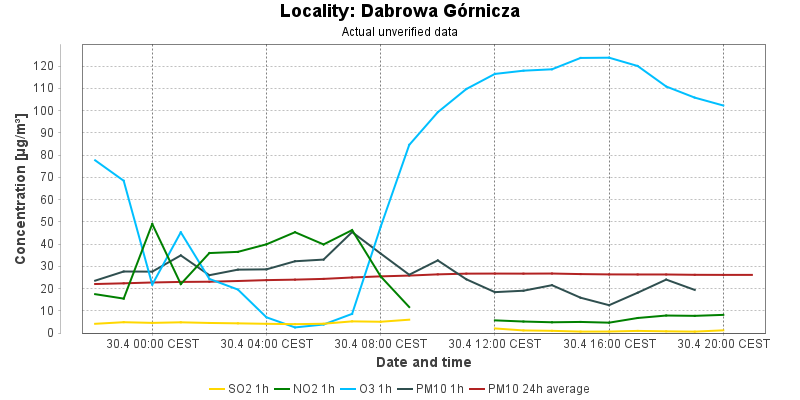
Dabrowa Górnicza
|
| Code: |
WDAGA |
| Type of measuring programme: |
Automated measuring program |
| Locality owner: |
Glówny Inspektorat Ochrony Šrodowisk |
| Abbreviation: |
B/U/RCI |
| Coordinates: |
50° 19´ 44.807" North latitude 19° 13´ 52.393" East longitude |
| Altitude: |
291 m |
Actual measured level of air pollution
Actual unverified data
| 2025-12-14 00:00 - 01:00 CET |
5.5 |
5.8 |
23.4 |
380.2 |
8.9 |
8.4 |
16.4 |
35.1 |
|
| 2025-12-14 01:00 - 02:00 CET |
5.3 |
5.7 |
20.5 |
376.2 |
11.8 |
9.1 |
16.0 |
34.4 |
|
| 2025-12-14 02:00 - 03:00 CET |
5.5 |
5.6 |
21.8 |
370.8 |
10.2 |
9.9 |
18.8 |
33.9 |
|
| 2025-12-14 03:00 - 04:00 CET |
4.9 |
5.6 |
18.1 |
373.9 |
13.4 |
9.8 |
14.8 |
33.2 |
|
| 2025-12-14 04:00 - 05:00 CET |
4.3 |
5.5 |
17.1 |
372.4 |
14.9 |
10.5 |
15.6 |
32.5 |
|
| 2025-12-14 05:00 - 06:00 CET |
4.2 |
5.5 |
18.7 |
366.8 |
13.7 |
11.3 |
19.7 |
31.9 |
|
| 2025-12-14 06:00 - 07:00 CET |
4.1 |
5.4 |
17.8 |
363.8 |
14.5 |
12.1 |
15.5 |
31.2 |
|
| 2025-12-14 07:00 - 08:00 CET |
4.4 |
5.4 |
19.0 |
366.0 |
13.4 |
12.6 |
24.1 |
31.2 |
|
| 2025-12-14 08:00 - 09:00 CET |
4.3 |
5.3 |
19.6 |
367.2 |
11.2 |
12.9 |
29.1 |
31.2 |
|
| 2025-12-14 09:00 - 10:00 CET |
4.7 |
5.3 |
18.7 |
374.9 |
10.9 |
12.8 |
26.3 |
31.1 |
|
| 2025-12-14 10:00 - 11:00 CET |
5.6 |
5.3 |
19.3 |
380.6 |
11.3 |
12.9 |
22.6 |
30.9 |
|
| 2025-12-14 11:00 - 12:00 CET |
5.2 |
5.2 |
18.7 |
384.4 |
14.1 |
13.0 |
38.0 |
31.2 |
|
| 2025-12-14 12:00 - 13:00 CET |
5.7 |
5.0 |
18.4 |
389.8 |
19.7 |
13.6 |
32.4 |
31.0 |
|
| 2025-12-14 13:00 - 14:00 CET |
6.0 |
4.9 |
20.3 |
394.2 |
23.2 |
14.8 |
26.6 |
30.7 |
|
| 2025-12-14 14:00 - 15:00 CET |
6.1 |
4.9 |
18.1 |
396.6 |
28.7 |
16.6 |
30.0 |
30.5 |
|
| 2025-12-14 15:00 - 16:00 CET |
5.2 |
4.8 |
21.0 |
399.5 |
23.8 |
17.9 |
21.9 |
29.4 |
|
| 2025-12-14 16:00 - 17:00 CET |
5.0 |
4.8 |
33.3 |
411.8 |
6.9 |
17.3 |
25.2 |
29.0 |
|
| 2025-12-14 17:00 - 18:00 CET |
4.9 |
4.9 |
34.8 |
427.0 |
1.9 |
16.2 |
36.6 |
28.1 |
|
| 2025-12-14 18:00 - 19:00 CET |
6.2 |
5.0 |
35.8 |
449.6 |
1.5 |
15.0 |
28.3 |
26.3 |
|
| 2025-12-14 19:00 - 20:00 CET |
5.9 |
5.1 |
33.7 |
461.8 |
3.3 |
13.6 |
36.1 |
25.9 |
|
| 2025-12-14 20:00 - 21:00 CET |
6.1 |
5.2 |
25.2 |
472.5 |
9.2 |
12.3 |
30.0 |
25.2 |
|
| 2025-12-14 21:00 - 22:00 CET |
5.8 |
5.2 |
19.4 |
479.6 |
13.6 |
11.1 |
35.0 |
25.2 |
|
| 2025-12-14 22:00 - 23:00 CET |
5.3 |
5.2 |
17.5 |
483.9 |
19.0 |
9.9 |
|
25.2 |
|
| 2025-12-14 23:00 - 00:00 CET |
|
5.2 |
|
497.9 |
|
7.9 |
|
25.4 |
|
|
|
Component is not measured |
|
|
Incomplete data |
|
|
Limit exceeded |
Map of station position
Map is on page with detailed information about locality