VII. AREAS WITH EXCEEDANCES OF LIMIT VALUES
VII.1 AREAS WITH EXCEEDED LIMIT VALUES WITH REGARD TO HUMAN
HEALTH PROTECTION
The Air Protection Act stipulates pollution limit values for selected pollutants without differentiation between pollution limit values and target pollution limit values. For 2016, areas are defined where the pollution limit values are exceeded collectively for all the pollutants that are monitored from the aspect of human health. The map of areas where at least one pollution limit value1, not including ozone, is exceeded provides comprehensive information on ambient air quality in the Czech Republic. In 2016, 25.9% of the territory of the Czech Republic, inhabited by approx. 56% of the population, was designated as an area where the pollution limit values were exceeded (Fig. VII.1).
Assignment of zones and agglomerations to these areas is, in the vast majority of cases, a result of exceeding the annual pollution limit values for benzo[a]pyrene (Tab. VII.1). To a lesser degree, assignment of a territory to these areas in 2016 was a result of exceeding the daily pollution limit values for suspended particulates PM10 and the annual pollution limit values for PM2.5 and NO2.
Compared to the previous year, the fraction of areas where at least one pollution limit value was exceeded increased, which is a result especially of extension of the area of the territory where the pollution limit value was exceeded for benzo[a]pyrene.
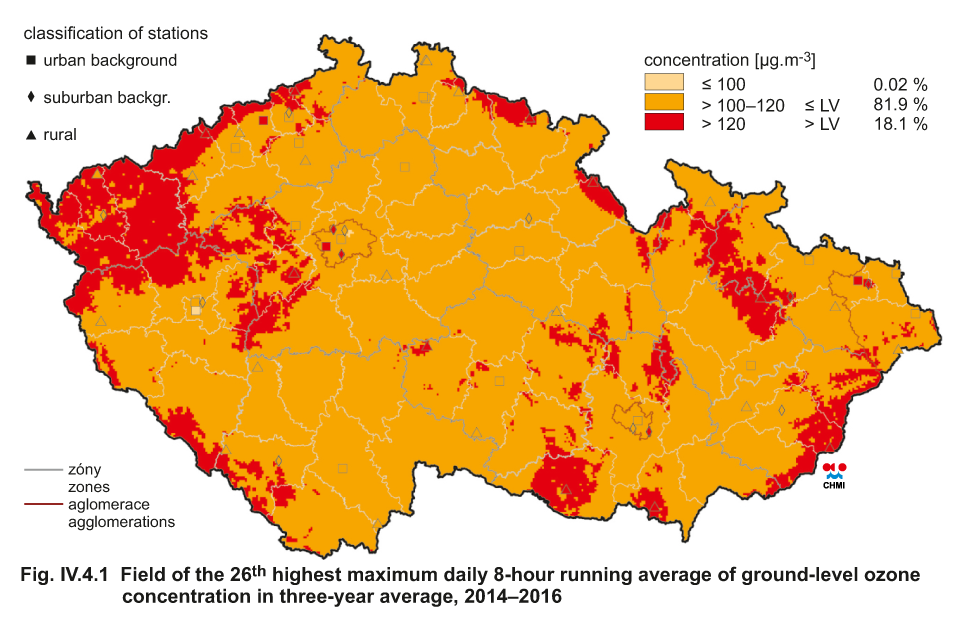
After including tropospheric ozone (O3), the areas where at least one pollution limit value was exceeded in 2016 corresponded to 42.9% of the territory of the Czech Republic (Fig. VII.2), inhabited by approx. 58.9% of the population of the Czech Republic. After inclusion of tropospheric ozone (O3), the increase in fraction of the population assigned to these areas is not substantial. This is because of the occurrence of elevated above-limit concentrations of O3 predominantly in relatively clean natural areas, i.e. in areas with lower population densities (Fig. IV.4.1). Nonetheless, compared to 2015, the fraction of the territory or population exposed to above-limit concentrations of O3 decreased in 2016 (Chap. IV.4).
To retain continuity with evaluations made in previous years (Fig. VII.3, Tab. VII.1), territories where the pollution limit values stipulated in subpar. 1 of Annex No. 1 of the Air Protection Act (formerly areas with deteriorated air quality, abbreviated as OZKO) and areas where the pollution limit values stipulated in subpar. 3 of Annex No. 1 of the Air Protection Act (formerly areas where the target pollution limit values without ozone are exceeded) were delimited separately. Trends in delimitation of areas formerly designated as OZKO are determined especially by above-limit air pollution by PM10 particulates and, to a certain degree, copy the trends in their concentration (Chap. IV.1.2), i.e. the largest OZKO areas were delimited in 2006, 2010 and 2011. The trend in areas formerly defined as areas where the target pollution limit values without ozone are exceeded is determined by the above-limit air pollution by benzo[a]pyrene. However, in evaluating the estimate of the field of annual average benzo[ a]pyrene concentrations, it is necessary to take into consideration the greater uncertainty in the estimate (Chapter IV.2; Annex I). It is apparent from comparison of the areas where the pollution limit values, which have been defined since 2006, are exceeded that a non-negligible part of the territory of the Czech Republic is permanently exposed to above-limit pollutant concentrations and that these are densely populated areas (Figs. VII.1 and VII.2).
VII.2 AREAS WHERE THE POLLUTION
LIMIT VALUES FOR PROTECTION
OF ECOSYSTEMS AND VEGETATION
ARE EXCEEDED
From the viewpoint of protection of the most valuable natural locations of the Czech Republic, exceeding of the pollution limit values for the protection of ecosystems and vegetation2 in the territory of NPs and PLAs is also evaluated (Table VII.2). In 2016, at least one of these limit values was exceeded over 7.5% of the territory of NPs and PLAs (Fig. VII.5).
Above-limit NOx concentrations occur particularly around transport roads; the pollution limit value for NOx for the most valuable natural parts of the Czech Republic was exceeded over only a very small area of several PLAs (Table VII.2, Fig. VII.4).
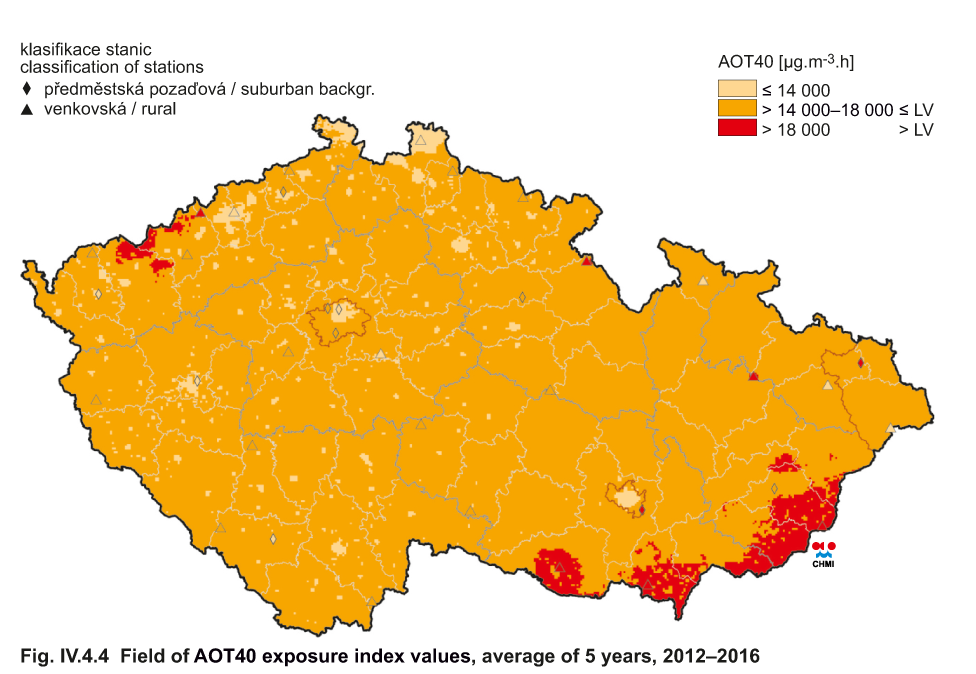
The territory over which the pollution limit value was exceeded for tropospheric O3, i.e. the exposure index AOT40, was larger in 2016 than in 2015 (Fig. IV.4.4). Above-limit concentrations of O3 were recorded in 2016 especially in the Bílé Karpaty PLA, Pálava PLA and Podyjí NP (a href="png/fVII5.png" style="text-decoration: none">Fig. VII.5).
The pollution limit value for the annual average concentration of SO2 was not exceeded in 2016 in the territory of any PLA or NP, similar to the previous five years.
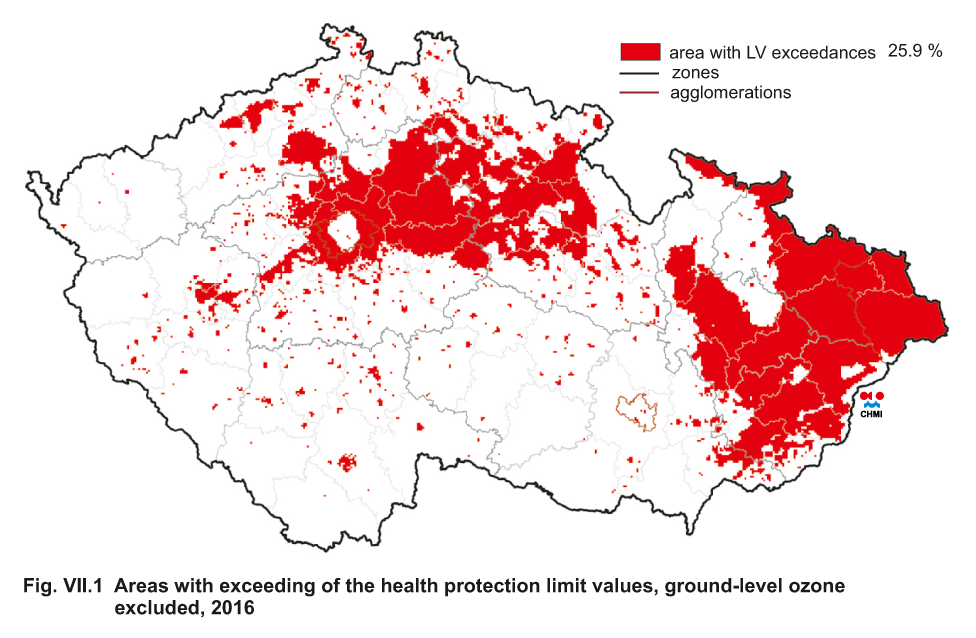
Fig. VII.1 Areas with exceeding of the health protection
limit values, ground-level ozone excluded, 2016
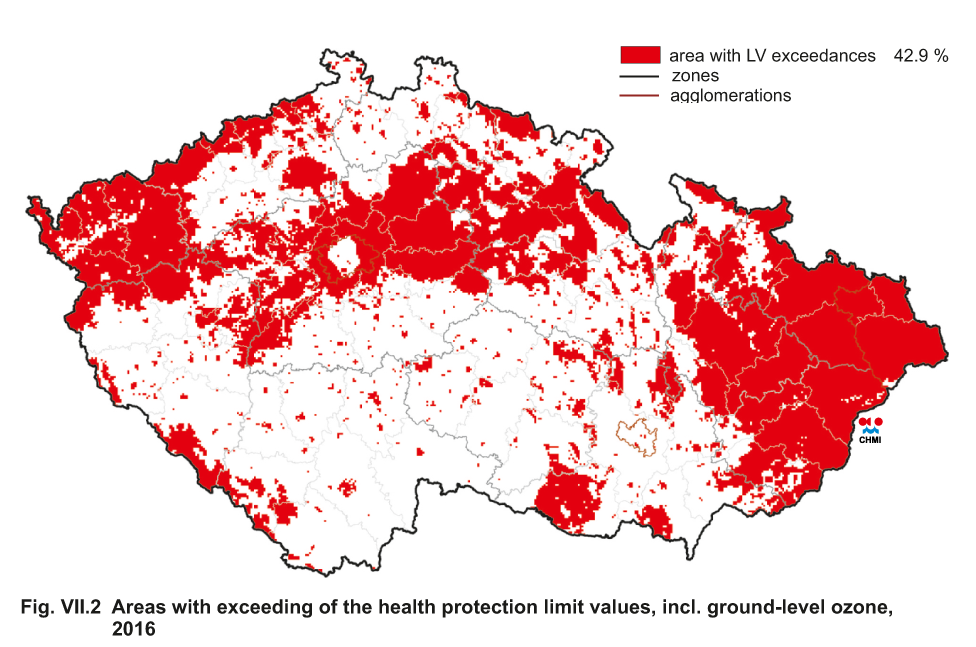
Fig. VII.2 Areas with exceeding of the health protection limit
values, incl. ground-level ozone, 2016
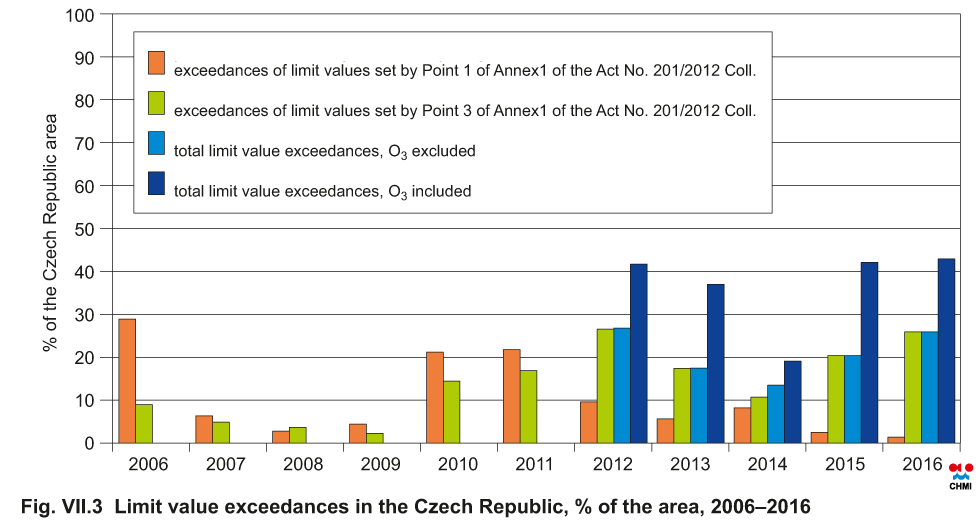
Fig. VII.3 Limit value exceedances in the Czech Republic, % of
the area, 2006–2016
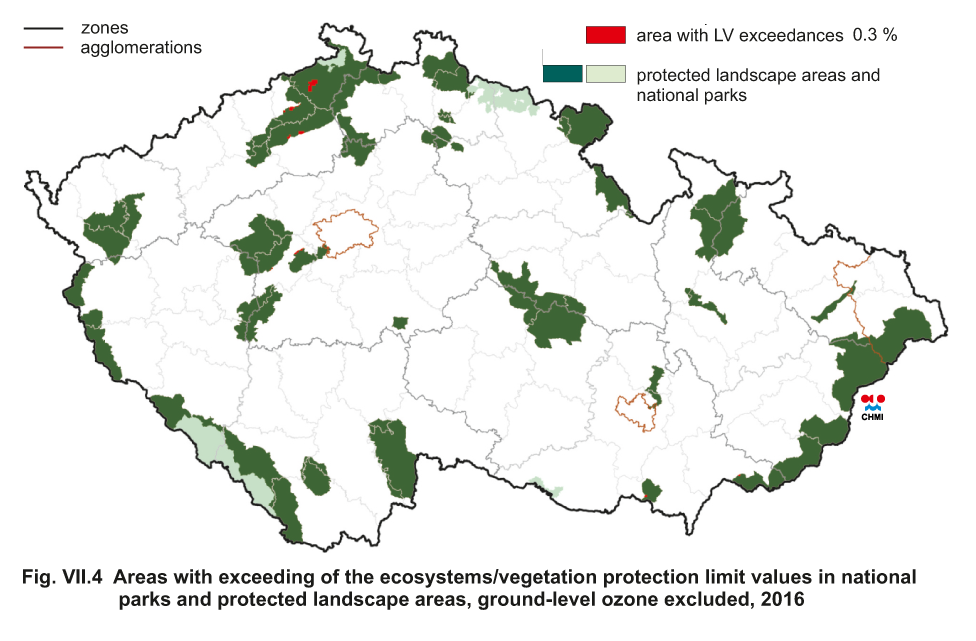
Fig. VII.4 Areas with exceeding of the ecosystems/vegetation
protection limit values in national parks and protected
landscape areas, ground-level ozone excluded, 2016
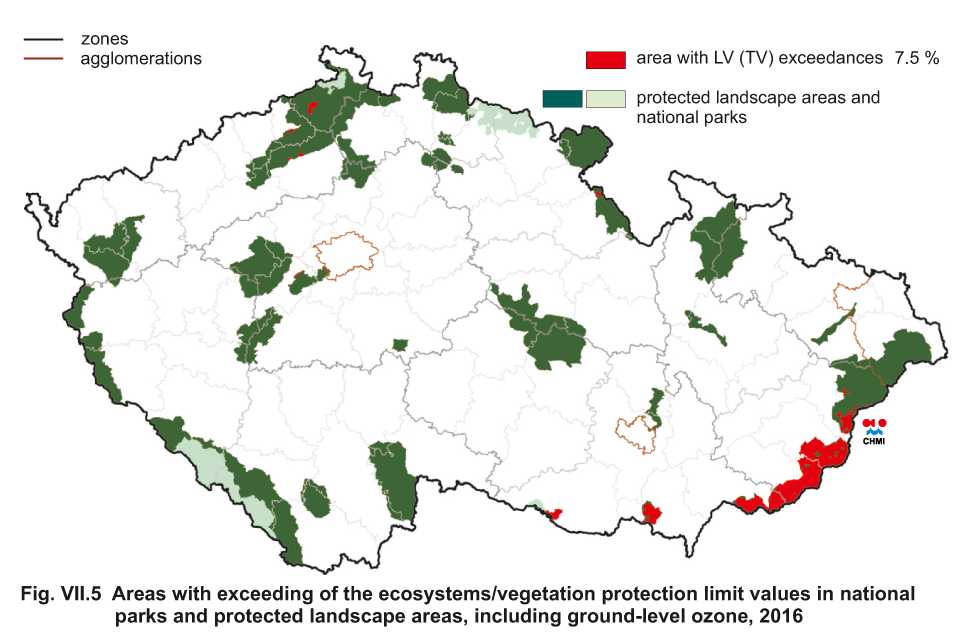
Fig. VII.5 Areas with exceeding of the ecosystems/vegetation
protection limit values in national parks and protected
landscape areas, including ground-level ozone, 2016
1Annual limit values for PM10, PM2.5, benzo[a]pyrene, NO2, lead, cadmium, arsenic, nickel and benzene, limit value for CO (max. daily 8-hour running average), daily limit value for PM10 and SO2, 1-hour limit value for SO2 and NO2.
2Limit value for the annual and winter average concentration of SO2, limit value for the annual average concentration of NOx and limit value for O3 expressed as the AOT40 exposure index.