IX. ATMOSPHERIC DEPOSITION IN THE CZECH REPUBLIC
Atmospheric deposition refers to the flux of substances from the atmosphere to the surface of the Earth (Braniš, Hůnová 2009). This is an important process contributing to self-purification of the air; on the other hand, however, it is responsible for input of pollutants into other components of the environment. Atmospheric deposition has both wet and dry components. The wet component is connected with the occurrence of atmospheric precipitation (vertical deposition: rain and snow, and horizontal deposition: fog and rime) and is thus episodic in character. The dry component corresponds to the deposition of gases and particles by various mechanisms and occurs continuously.
The quantification of total atmospheric deposition is very important for studying its impact on the natural environment. Quantification of the individual components differs substantially in relation to the difficulty of the method and reliability of the obtained results. Wet vertical deposition is relatively the easiest to measure (Krupa 2002), while no method is available for measuring direct dry deposition and thus this quantity must be estimated by using various, usually quite complicated approaches (Wesely, Hicks 2000; Kumar et al. 2008). However, horizontal deposition is by far the most difficult component of atmospheric deposition to measure (e.g. Krupa 2002; Klemm, Wrzesinsky 2007), and this component is measured only exceptionally, where real deposition of this component is mostly substantially underestimated (Bridges et al. 2002; Hůnová et al. 2011).
The atmospheric deposition of most monitored substances in Europe has decreased substantially over the past twenty years, but still remains a problem in a number of regions (EEA 2011). In the territory of the Czech Republic, the chemical composition of atmospheric precipitation and of atmospheric deposition has been monitored for a long time at a large number of locations. Long-term temporal trends and changes in the spatial distribution of the majority components of deposition, i.e. sulphur and nitrogen, have already been published (Hůnová et al. 2004; 2014).
Information on the chemical composition of atmospheric precipitation was supplied to the Air Quality Information System (AQIS) in 2016 from 45 locations in the Czech Republic (18 locations where CGS performs measurements, 14 CHMI, 7 VÚLHM and 6 HBÚ AV ČR. Further, data were supplied from 4 German locations (the LfULG organisations) and 6 Polish locations (the GIOS organisation) in border areas. The locations together with the measuring program are depicted in the map in Fig. IX.1 (with the exception of two locations in Poland outside the presented area). In most cases, CHMI and LfULG stations measure wet-only precipitation at weekly intervals (changed from monthly intervals to weekly in 1996 in accordance with international EMEP methodology). Further, weekly precipitation of the “bulk” type was collected from 1997 to 2010 (with an undefined dust fallout content) for heavy metal analyses. Since 2011, heavy metals have been analysed at CHMI in wet-only precipitation and “bulk” type sampling was discontinued (with the exception of the Košetice station). At the locations of other organisations, concentrations are measured at monthly intervals for "bulk" type precipitation in open areas or under the crowns of trees (throughfall) (Tab. IX.4).
Depiction of deposition fields was based on selected ions in dependence on the severity of their impact on components of the environment, specifically SO42--S, NO3--N, NH4+-N, H+ (pH), Cl-, Pb2+, Cd2+ and Ni2+. Maps of wet deposition of idividual ions were created from the fields of ion concentrations in precipitation (on the basis of the average annual concentrations of weighted total precipitation calculated from the measured data) and from the fields of total annual precipitation on the basis of data from 750 precipitation gauging stations, taking into account the effect of altitude on the amount of precipitation. In creating fields of wet deposition at the individual stations, the results of analysis of wet-only precipitation are preferred over “bulk" samples of precipitation with dust fall-out and weekly sampling is preferred over monthly sampling. Data from the network of stations where measurements are performed by CGS, VÚLHM and GIOS, based on monthly collection of “bulk” samples of precipitation with dust fallout (Tab. IX.4), for creation of wet deposition maps are modified by empirical coefficients expressing the ratios of the individual ions in samples of the “wet-only” and “bulk” precipitation types (values for the individual ions in the range from 0.74 for NH4+ to 1.06 for H+). The fact that the ratio is greater than 1 for the H+ ion can be explained by the fact that solid particulates contained in “bulk” type samples react with hydrogen cations, reducing their concentrations (Ranalli et al. 1997).
In addition to wet deposition, also dry deposition charts are presented for sulphur, nitrogen, hydrogen ions, lead and cadmium. Maps of total annual deposition are presented for sulphur, nitrogen and hydrogen ions.
Dry sulphur and nitrogen deposition was calculated using fields of annual mean SO2 and NOx concentrations for the Czech Republic, and the deposition rates for SO2 of 0.7 cm.s-1/0.35 cm.s-1 and NOx of 0.4 cm.s-1/0.1 cm.s-1 were calculated for forested/unforested areas (Dvořáková et al. 1995).
A map of total deposition was created by adding the maps of wet and dry deposition of sulphur and nitrogen. The wet deposition map was created on the basis of the measured pH values of the precipitation. The map of wet deposition of hydrogen ions corresponds to the deposition of SO2 and NOx on the basis of the stoichiometry, assuming acidic reactions in the environment. The total hydrogen deposition map was created by summation of the maps of wet and dry deposition.
Tab. IX.1 lists the average values of the deposition fluxes of A, N and H.
Map depiction of the throughfall of sulphur was created for forested areas on the basis of the sulphur concentration fields for throughfall precipitation and from the verified precipitation field, modified by the percentage amount of precipitation measured under the forests at the individual stations (for the range of 61–109 % of the total precipitation in open areas in 2016). Throughfall deposition generally includes wet vertical and horizontal deposition (from fogs, low clouds and rime) and dry deposition of particles and gases in forests. This should provide a good estimate of total deposition for sulphur for which internal deposition in forests is negligible.
The fields of dry deposition of Pb and Cd contained in SPM (dry Pb and Cd deposition) were derived from the fields of these metals’ concentrations in the ambient air (or on the basis of the air pollution field of annual average of PM10 concentrations and values of IDW interpolation of the shares of the respective metal in dust). The deposition rate of Cd contained in SPM was taken as 0.27 cm.s-1 for forested and 0.1 cm.s-1 for unforested terrain; the figures for Pb are 0.25 cm.s-1 for forested and 0.08 cm.s-1 for unforested terrain (Dvořáková et al. 1995).
The scale in the legend of the map of fields of wet and dry annual deposition of cadmium was modified in 2015 because of the very low values, for which the original scale was unsatisfactory.
Ion balance calculation is routinely used to check the precipitation data quality. The difference between the sum of the cations and sum of the anions in the sample should comply with the permitted criteria, which differ slightly for the individual organisations. Further, the results are checked by comparison of the calculated and measured conductivities, which must also comply with the permitted criteria. A check is also performed by analysis of laboratory blank samples and blank site samples are regularly monitored and evaluated; this enables checking of work during sampling and checks of changes caused by transport, handling, storage and treatment of samples before the actual chemical analysis.
Results
Precipitation in 2016 was slightly below the longterm average. On an average, 635 mm of precipitation fell on the territory of the Czech Republic, which corresponds to 94% of the long-term normal amount (for 1961–1990). The total precipitation was higher than in 2015 (531 mm).
Wet deposition of sulphur decreased below a value of 50,000 t after 1998 and continued to decrease until 1999. In 1999–2005 the values remained more or less at the 1999 level, with the exception of lower deposits in 2003, when substantially subnormal precipitation was recorded (516 mm, i.e. 77% of the long-term normal amount). The increasing trend continued from 2004 to the present time. In 2016, the amount of wet annual sulphur deposition in the territory of the Czech Republic increased slightly to 16,934 t (compared to 16,595 t in 2015). In 2016, the greatest amount of wet sulphur was deposited in mountain areas, in the Moravian-Silesian Beskydy and Krkonoše (Fig. IX.2).
There was also a substantial decrease in dry deposition of sulphur between 1997 and 2000. In the following years, the fields of dry deposition remained more or less at a constant level (Fig. IX.20), in accordance with the concentration level of sulphur dioxide in the troposphere. In 2016, dry deposition of sulphur in the territory of the Czech Republic equalled 20,728 t, with the highest values being attained in the territory of the Krušné Mts. and the Moravian-Silesian Beskydy (Fig. IX.3). Similarly, dry sulphur deposition exhibited its most significant decrease between the years 1997 and 2000. In the following years, the field of dry deposition remained more or less at the same level (Fig. IX.20), which is coherent with SO2 concentrations in the ground-level ambient air. In 2015 dry sulphur deposition in the territory of the Czech Republic reached 23,063 t, and the highest values were recorded in the Krušné hory Mts. and the Moravsko- slezské Beskydy Mts. (Fig. IX.3).
Fields of total sulphur deposition correspond to the sum of wet and dry sulphur deposition and exhibit an overall level of sulphur deposition corresponding to 37,662 t of sulphur on the surface of the Czech Republic in 2016 (Table IX.2). After a previous decrease from values substantially higher than 100,000 t of sulphur deposition in 2000–2006, the amount deposited remained in the range of approx. 65,000–75,000 t sulphur, with the exception of 2003, when precipitation was substantially subnormal. Since 2007, the overall amount of sulphur deposited has varied around 50,000 t of sulphur on the surface of the Czech Republic (Fig. IX.20). Total sulphur deposition exhibits maxima in the Krušné Mts. and Ostrava areas (Fig. IX.4).
In 2016, throughfall deposition attained maximum values in the mountain areas (Fig. IX.5). In some mountain areas in this country, the long-term throughfall deposition values are higher than the values of total sulphur deposition determined as the sum of wet (only vertical) and dry deposition from SO2. This increase can be attributed to the contribution from deposition from fog, low clouds and rime (horizontal deposition), which is not included in total deposition because of its uncertainty. Rime and fogs are usually very concentrated and in mountain areas and areas with frequent occurrence of fogs (valley fogs, fogs close to water courses and lakes) can contribute substantially to the deposition of sulphur and other elements. The locally substantially variable character of this deposition is also a problem, where extrapolation over a larger area can lead to imprecisions. For mountain areas, sulphate deposition from fogs and rime is considered to correspond to 50–90% of the "bulk" type deposition on an average over a longer period lasting several years (Tesař et al. 2000; Tesař et al. 2005). In some independently evaluated years, the ratio of deposition of sulphates from fog and rime and deposition of the "bulk" type even exceeded 100%.
Further, throughfall deposition also includes a con- tribution from dry deposition of S from SO2- 4 contained in dust SPM. Based on the data on sulphate concentrations in SPM for 2014 for two stations (Churáňov and Košetice) and a deposition rate of 0.25 cm.m-1 (Dvořáková et al. 1995), the dry deposition of S from SO42-reached the average value of 0.04 g.m-2.year-1 for forested areas (Churáňov = 0.026 g.m-2.year-1, Košetice = 0.058 g.m-2.year-1). Because of the limited number of locations where the sulphate concentration in SPM is monitored, this is only a very rough estimate.
The map depicting throughfall deposition can be considered as an illustration of the values that total sulphur deposition (including horizontal deposition and dry deposition of S from SO42- in dust SPM) can attain because, unlike other pollutants, internal circulation of sulphur in vegetation is negligible (Draaijers et al. 1997).
Since 2008, throughfall deposition has been calculated using the ZABAGED database of the State Administration of Land Surveying and Cadastre (SALSC) with a finer grid (500x500 m), where the total forest area is 26,428 km2. Consequently, the total values of throughfall deposition were also recalculated for the new forest layer back to 2001, to facilitate comparison with the data for 2007 (Tab. IX.3). In 2016, throughfall deposition of sulphur in forested areas of this country attained a value of 19,724 t.
Wet deposition of oxidised forms of nitrogen (N/NO3-) in 2016 decreased compared to 2015, while wet deposition of reduced forms of nitrogen (N/NH4+) increased (Hůnová et al. 2017). Wet deposition of oxidised and reduced forms exhibited maximum values in mountainous areas (Fig. IX.6 and Fig. IX.7). The highest values of total wet deposition of nitrogen (sum of the wet deposition of N/NO3- and N/NH4+) were recorded in the Jizerské Mts., Krkonoše and Orlické Mts. areas (Fig. IX.8).
Dry deposition of oxidised forms of nitrogen exhibited a decreasing trend up to 2002 (when the value attained 48% of the average value for 1995–1997). No clear trend is discernible in the following years. Fluctuations in the annual values are related to pollution concentration levels of NOx in the troposphere. In 2016, dry annual deposition on the territory of the Czech Republic decreased slightly compared to 2015. The highest values were attained in the territories of larger cities and along important roadways (Fig. IX.9).
In 2016, the total deposition of nitrogen equalled 62,351 t N p.a. over the area of the Czech Republic (Tab. IX.2). This was thus a decrease compared to 2015 (63,292 t p.a.). Total nitrogen deposition attained the highest values in the territory of the Krušné Mts. and also in larger cities (Prague, Brno, Ostrava) and along busy roadways, especially the D1 motorway (Fig. IX.10).
Wet deposition of hydrogen ions has decreased substantially since the start of the monitored period in 1996. The lowest value was attained in 2015. The decrease in wet deposition in 2015 was probably caused by lower total annual precipitation. In 2016, the value of annual wet deposition of hydrogen ions equalled 411 t p.a. (compared to 354 t p.a. in 2015). The highest value was attained in the territory of the Jizerské Mts., Krkonoše, Orlické Mts., Hrubý Jeseník and the Moravian-Silesian Beskydy (Fig. IX.11). In 2016, dry deposition of hydrogen ions decreased over most of the territory of the Czech Republic. Maximum values were attained in the area of the Krušné Mts. and in the Moravian-Sile-sian region (Fig. IX.12). Overall, there was a de-crease in dry deposition from 2,856 t p.a. in 2015 to 2,576 t p.a. in 2016. In the second half of the 1990's, wet and dry deposition of hydrogen ions decreased by 50% over the entire area of the Czech Republic; the reduction in dry deposition of hydrogen ions corresponded to the reduction in dry deposition of SO2 - S and NOx - N (Fig. IX.20).
After 2000, when the sale of leaded petrol was terminated, the deposition of lead ions decreased substantially. Wet deposition of lead in 2016 (56 t p.a.) increased almost two-fold compared to 2015 (31 t p.a.); in the preceding years of 2013 (63 t p.a.) and 2014 (62 t p.a.) the wet deposition of lead attained values similar to that for 2016. The highest values were attained in the territory of the Krušné Mts. and Moravian-Silesian Beskydy (Fig. IX.15). Dry deposition of lead ions in 2016 (25 t p.a.) increased compared to 2015 (24 t p.a.). The highest values were attained in the Ostrava, Moravian- Silesian Beskydy and Brdy areas (Fig. IX.16).
Both wet and dry deposition of cadmium ions decreased compared to 2015 (Figs. IX.17 and IX.18). The cadmium deposition values have long been highest in the Jablonec nad Nisou district. Only 2013 was an exception, when there was a so-far unexplained increase at the U dvou louček location in the Orlické Mts. area.
The annual wet deposition of nickel ions decreased in 2016 compared to 2015. The highest values were attained in the Lysina and Liz locations. At the Lysina location, this is probably caused by the very specific type of bedrock (serpentine) with high nickel and magnesium contents (Krám et al. 2009). Greater wet deposition of nickel ions was also measured in the Krušné Mts, Slavkovský les, Český les, Šumava and Moravian-Silesian Beskydy (Fig. IX.19).
Compared to 2015, the wet deposition of chloride ions decreased. Similar to other monitored pollutants, the wet deposition of chloride ions in the Czech Republic attained higher values in mountain areas, with maxima in the Orlické Mts., Hrubý Jeseník and Moravian-Silesian Beskydy (Fig. IX.14).
Following a decrease in wet deposition of some components (predominantly sulphates, hydrogen ions and lead ions) in the second half of the 1990's, trends in the wet deposition of the main components at selected stations in the Czech Republic (Fig. IX.22) tend to be unremarkable. A decrease in deposition of sulphates was apparent both at relatively exposed suburban stations and also at background stations, such as Košetice and Svratouch.
Together with the progression of deposition of sulphur and nitrogen, a progression can be observed in the mutual ratio of these two elements in atmospheric precipitation, related to trends in emissions of the individual compounds (Fig. IX.21). A slight increase in the ratio of nitrates to sulphates can be observed at some stations since the second half of the 1990's (Hůnová et al. 2014).
Tab. IX.1 Average deposition fluxes S, N and H in the Czech
Republic, 2016
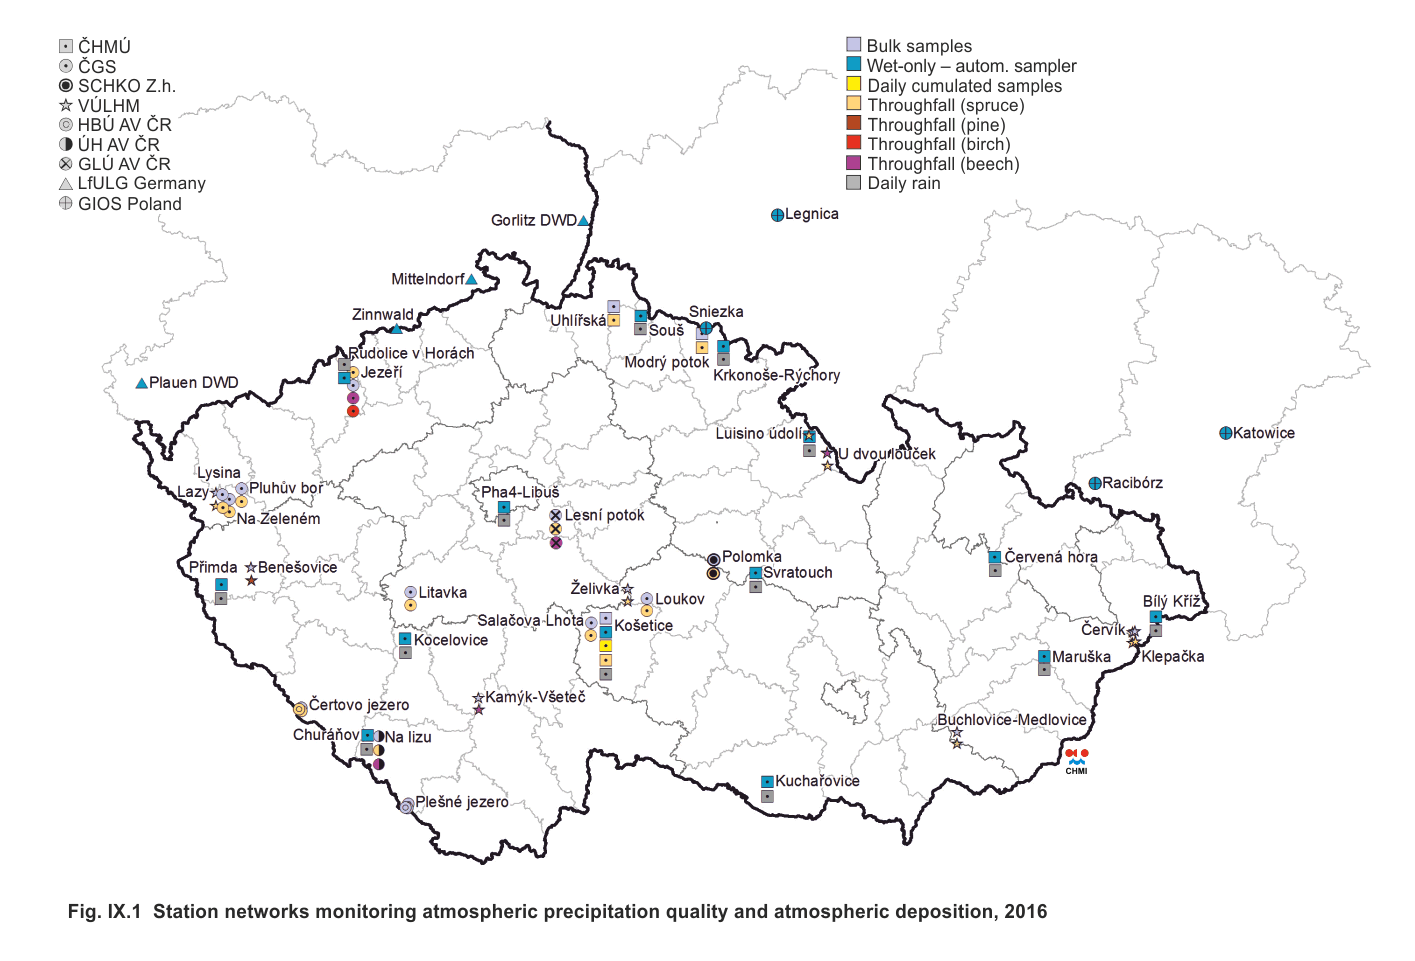
Fig. IX.1 Station networks monitoring atmospheric
precipitation quality and atmospheric deposition, 2016
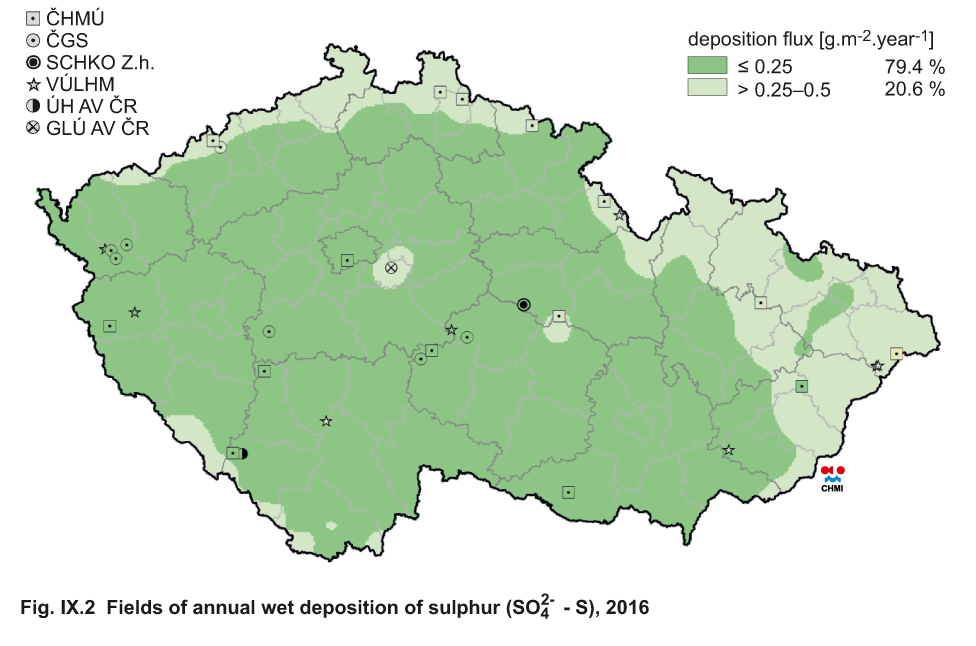
Fig. IX.2 Fields of annual wet deposition of sulphur (SO42- -
S), 2016
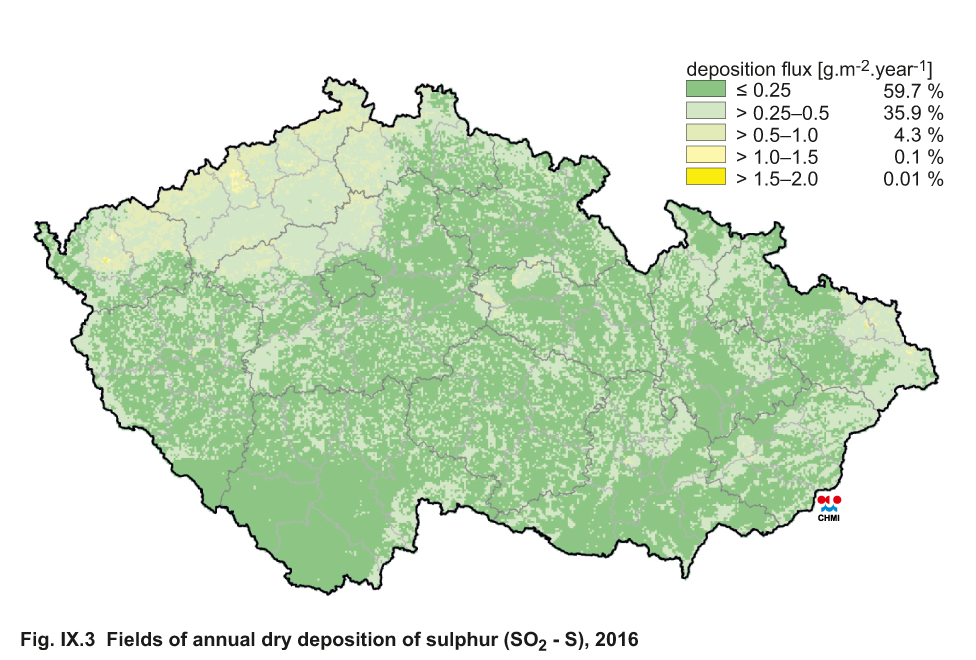
Fig. IX.3 Fields of annual dry deposition of sulphur (SO2 - S),
2016
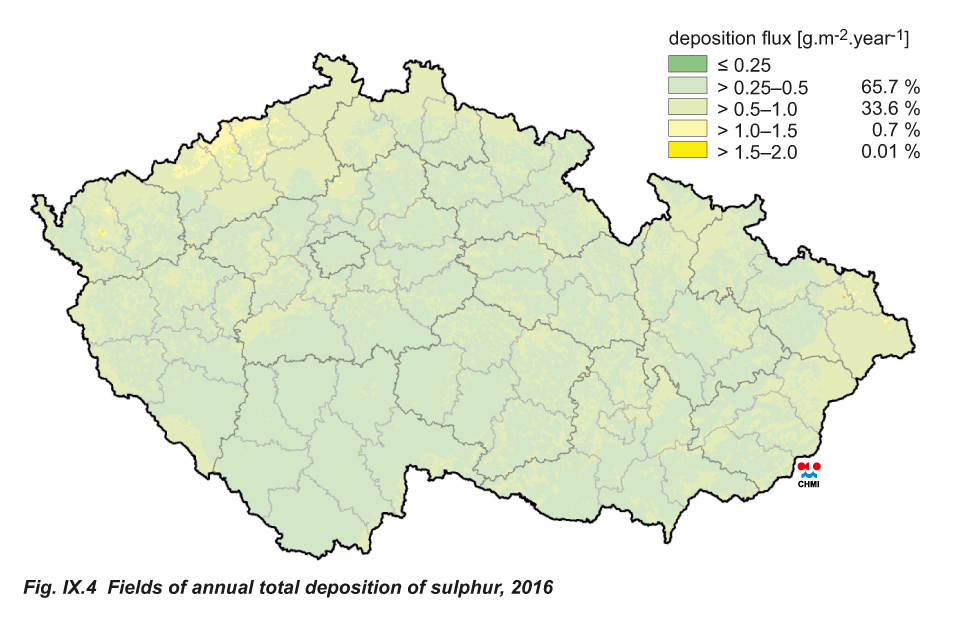
Fig. IX.4 Fields of annual total deposition of sulphur, 2016
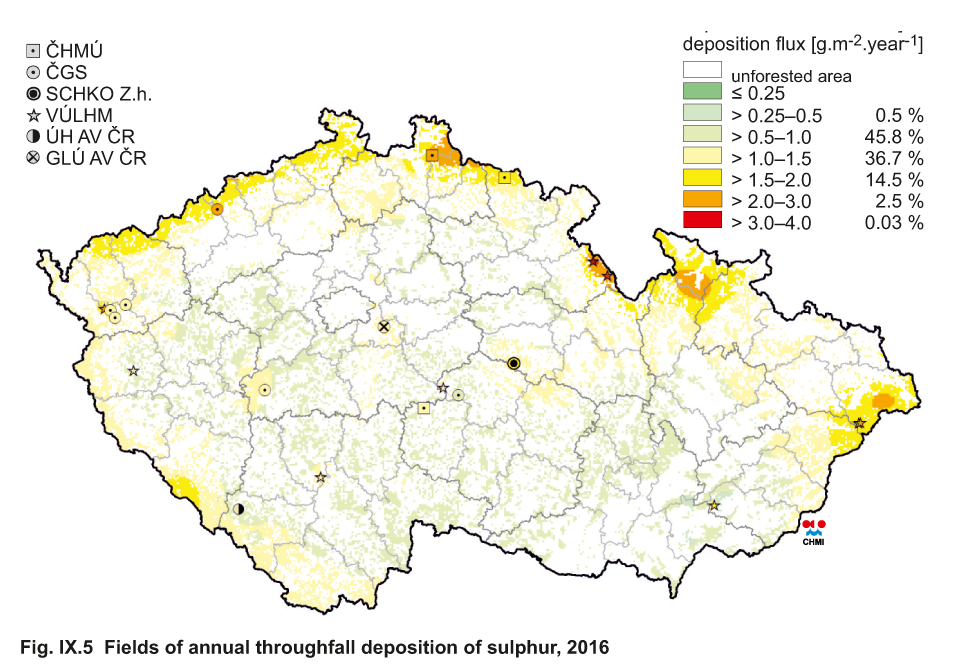
Fig. IX.5 Fields of annual throughfall deposition of sulphur,
2016
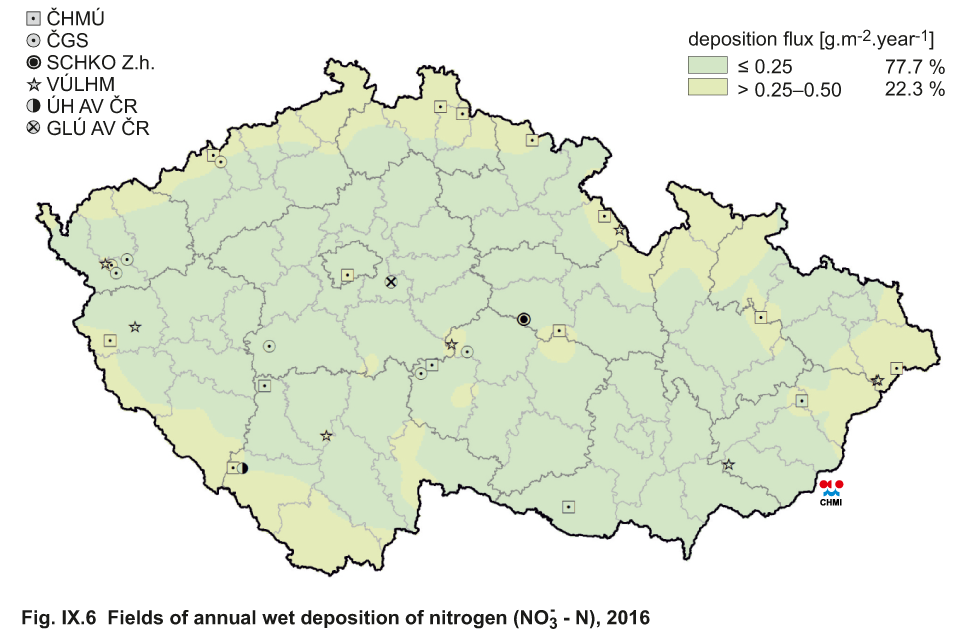
Fig. IX.6 Fields of annual wet deposition of nitrogen (NO3- -
N), 2016
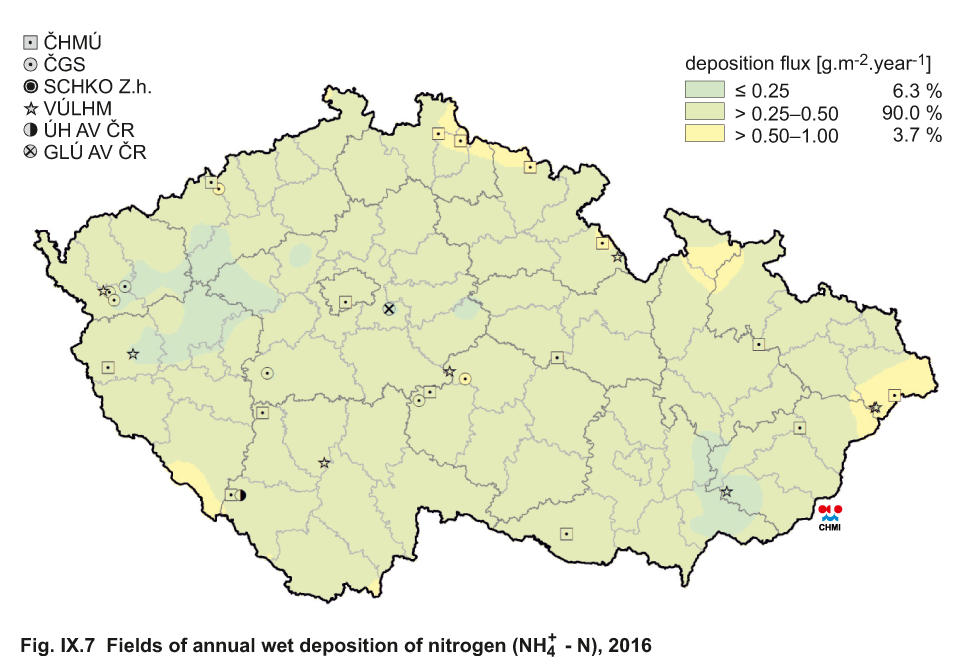
Fig. IX.7 Fields of annual wet deposition of nitrogen (NH4+ -
N), 2016
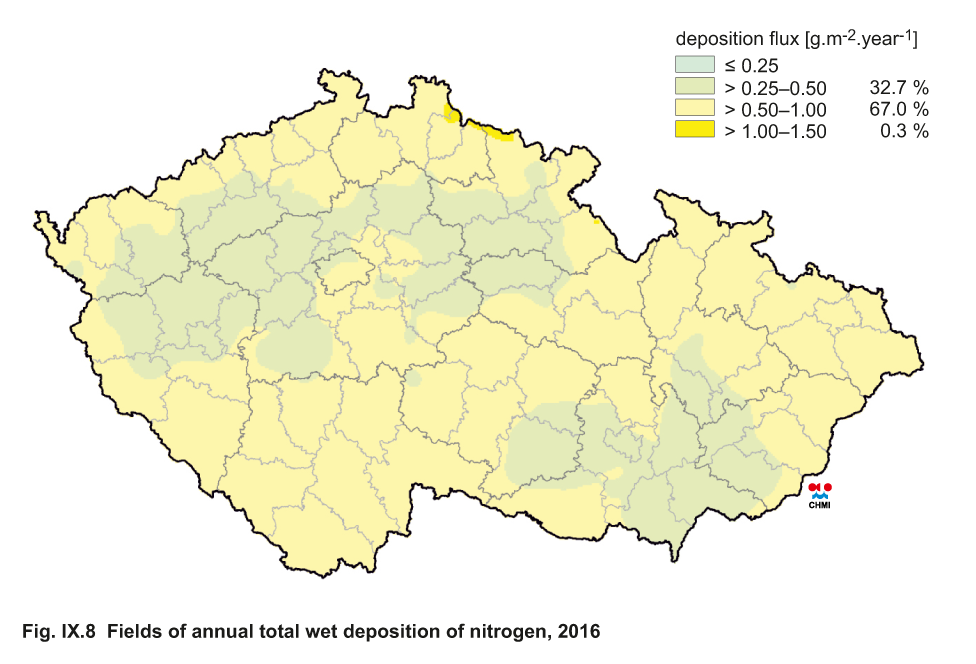
Fig. IX.8 Fields of annual total wet deposition of nitrogen,
2016
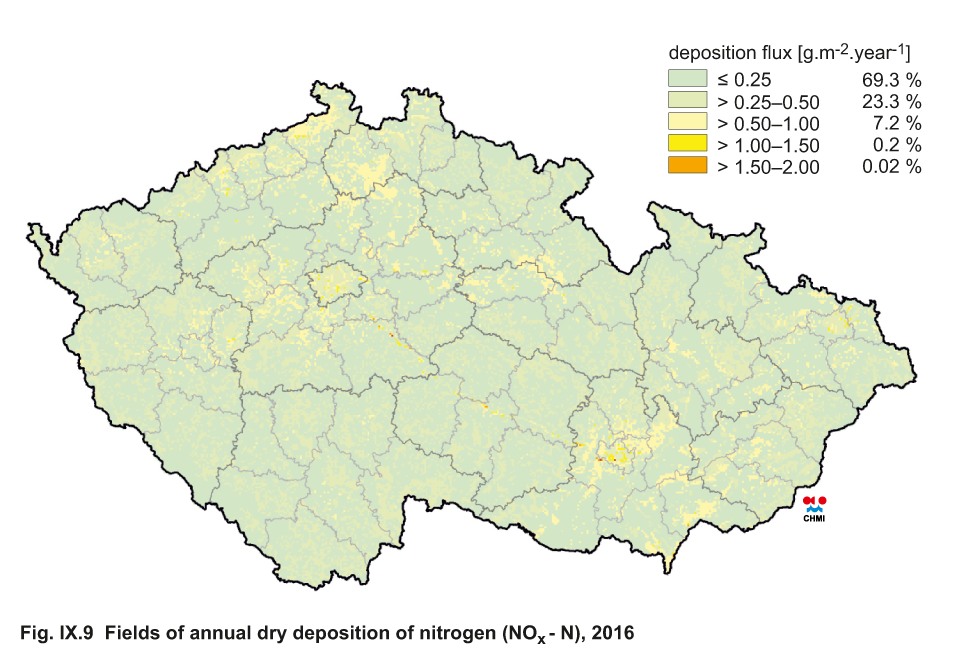
Fig. IX.9 Fields of annual dry deposition of nitrogen (NOx - N),
2016
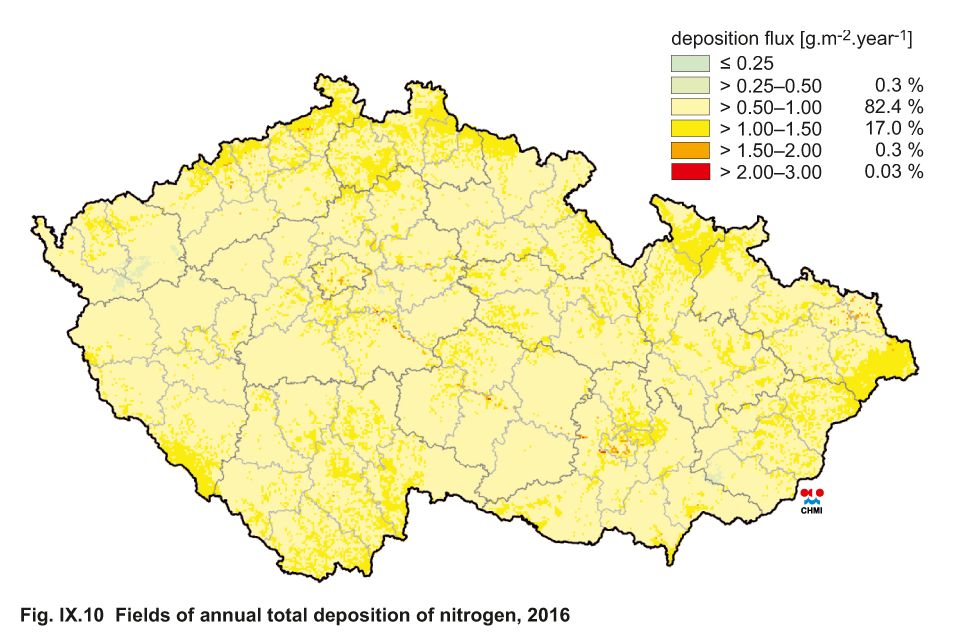
Fig. IX.10 Fields of annual total deposition of nitrogen, 2016
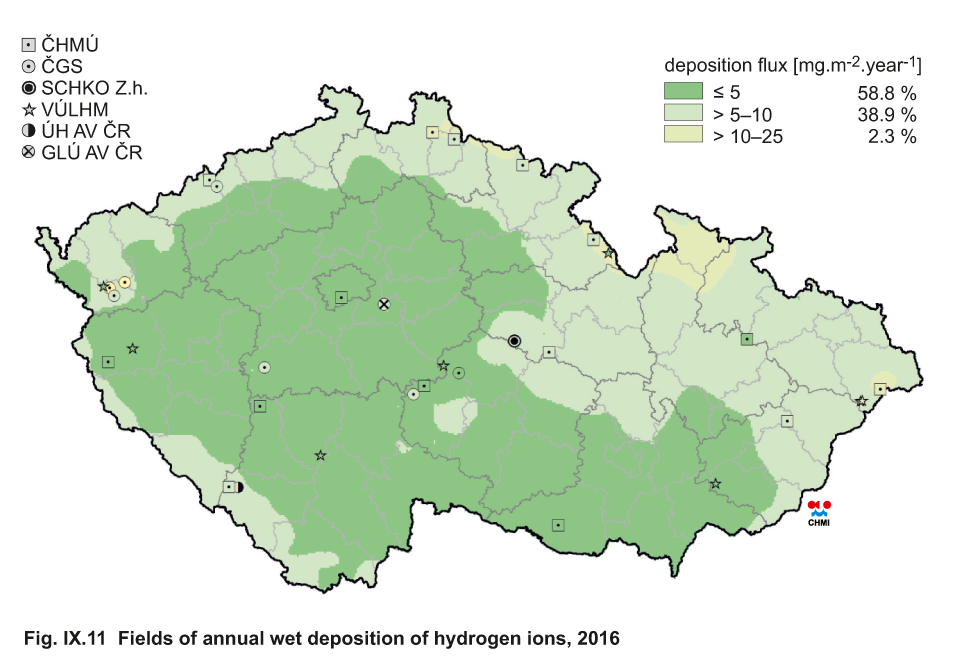
Fig. IX.11 Fields of annual wet deposition of hydrogen ions,
2016
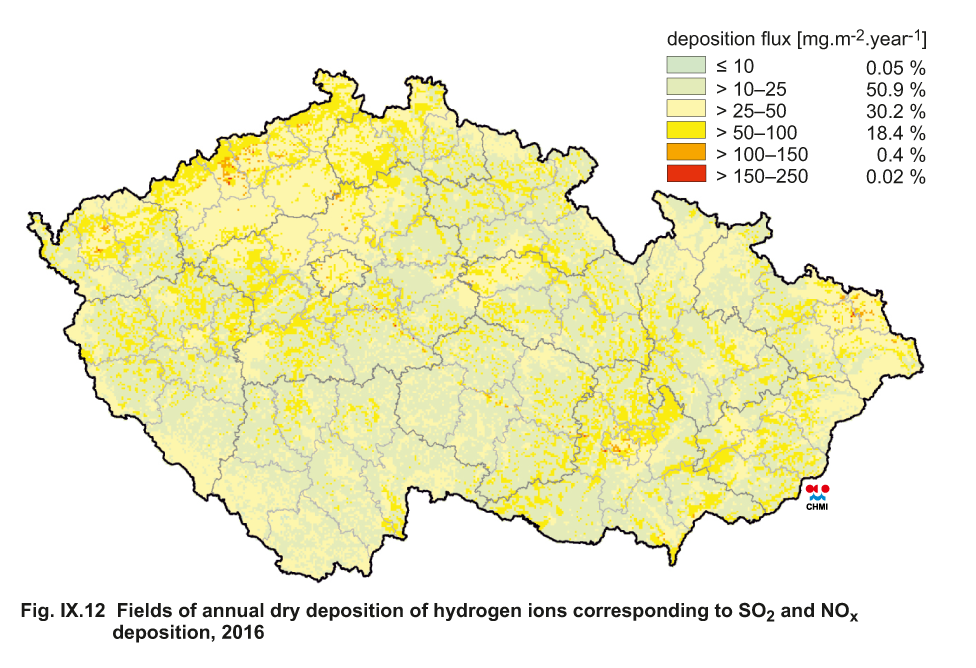
Fig. IX.12 Fields of annual dry deposition of hydrogen ions
corresponding to SO2 and NOx deposition, 2016
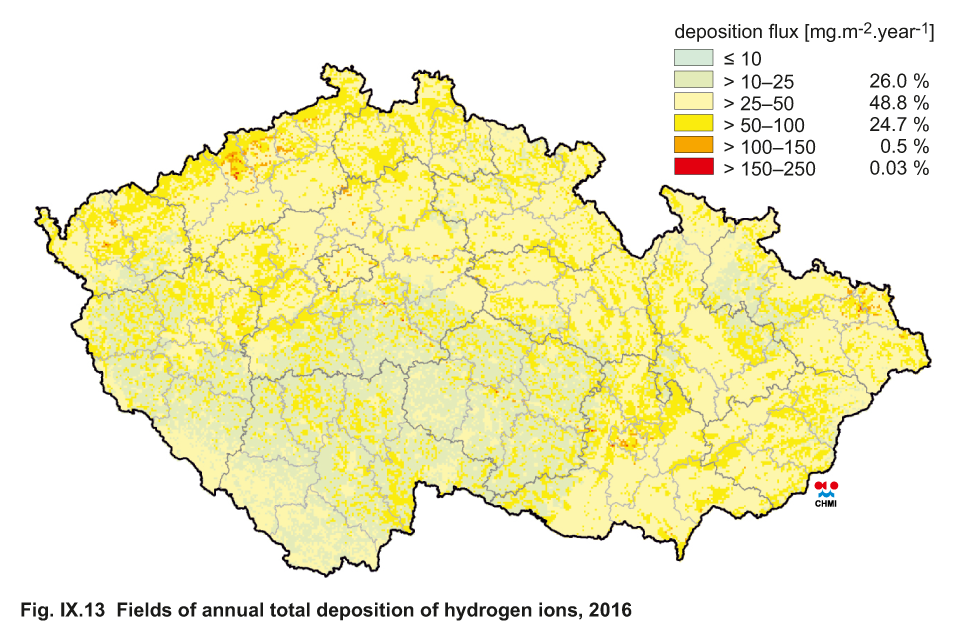
Fig. IX.13 Fields of annual total deposition of hydrogen ions,
2016
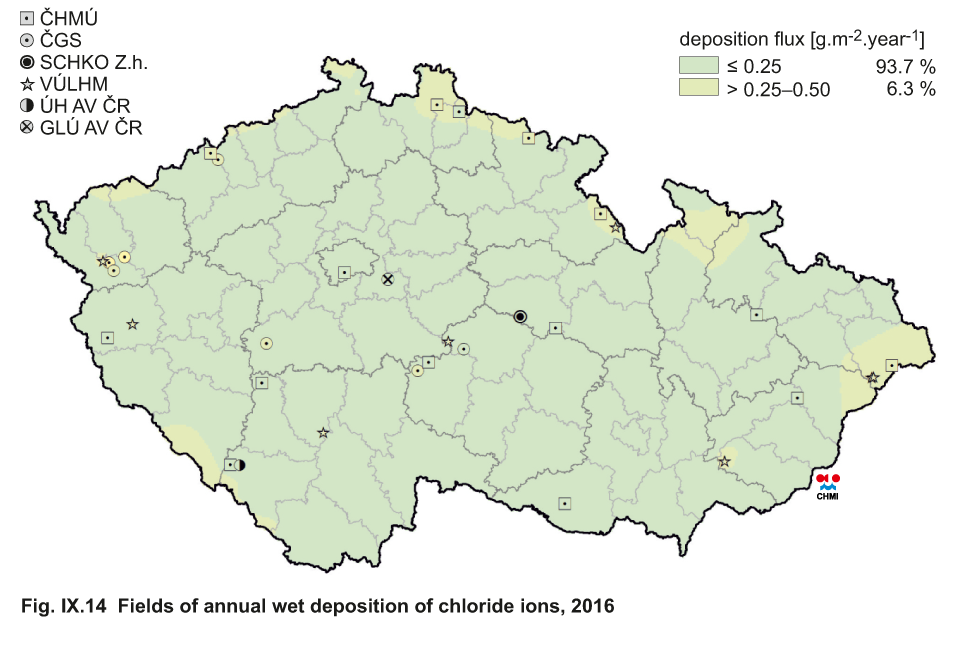
Fig. IX.14 Fields of annual wet deposition of chloride ions,
2016
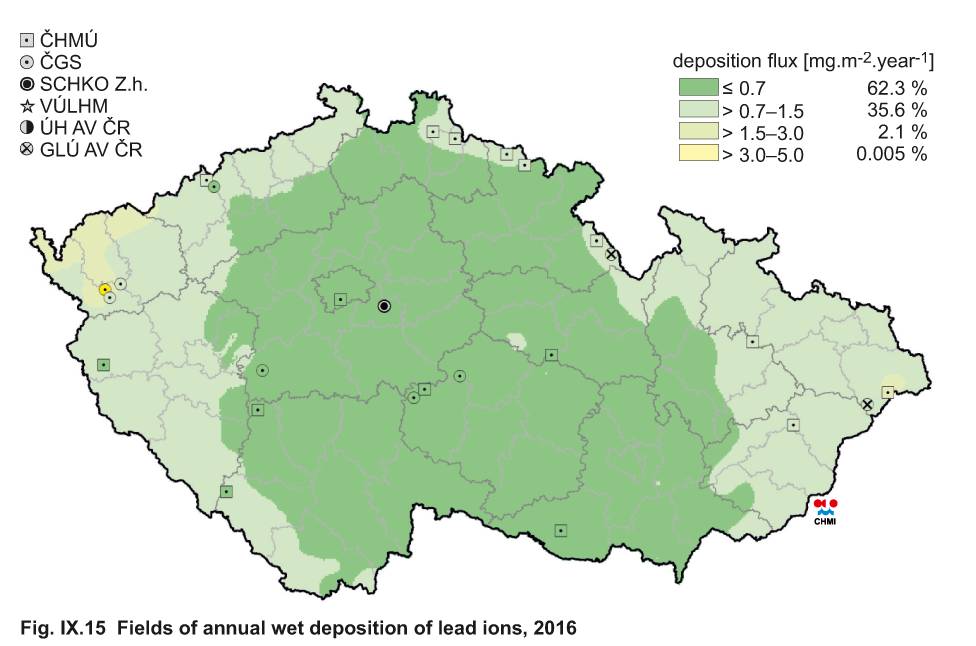
Fig. IX.15 Fields of annual wet deposition of lead ions, 2016
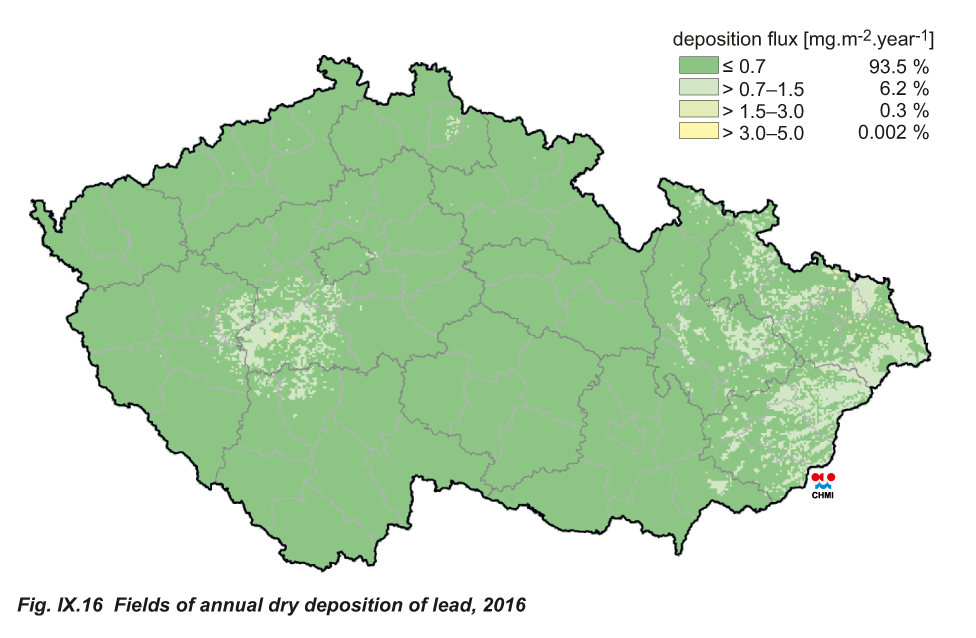
Fig. IX.16 Fields of annual dry deposition of lead, 2016
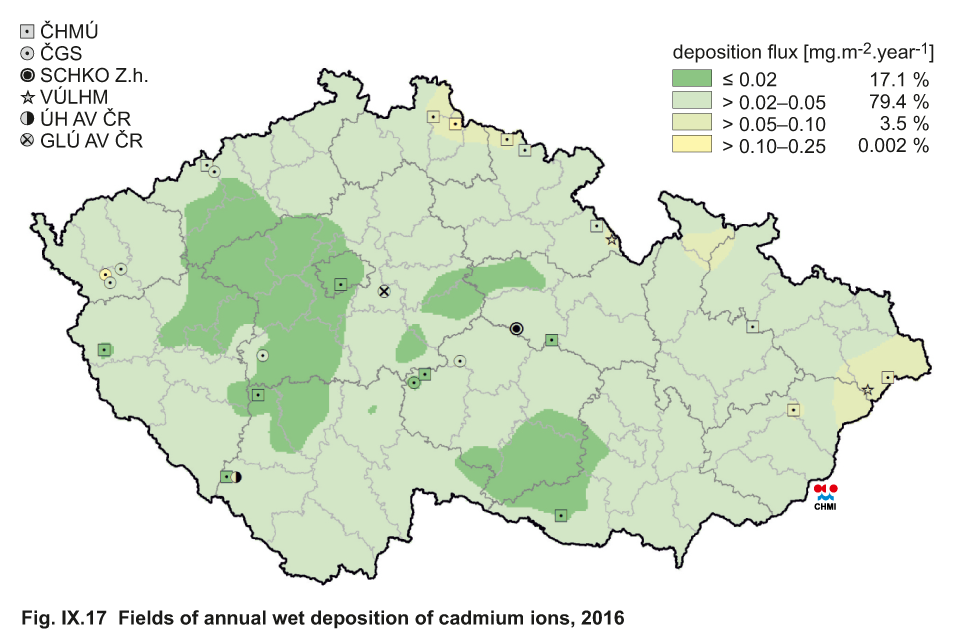
Fig. IX.17 Fields of annual wet deposition of cadmium ions, 2016
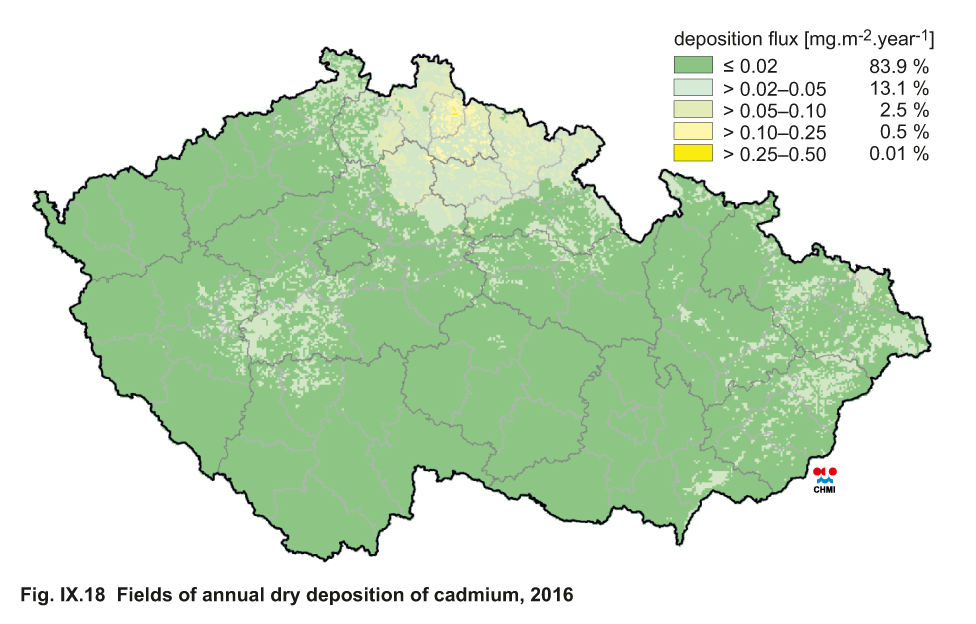
Fig. IX.18 Fields of annual dry deposition of cadmium, 2016
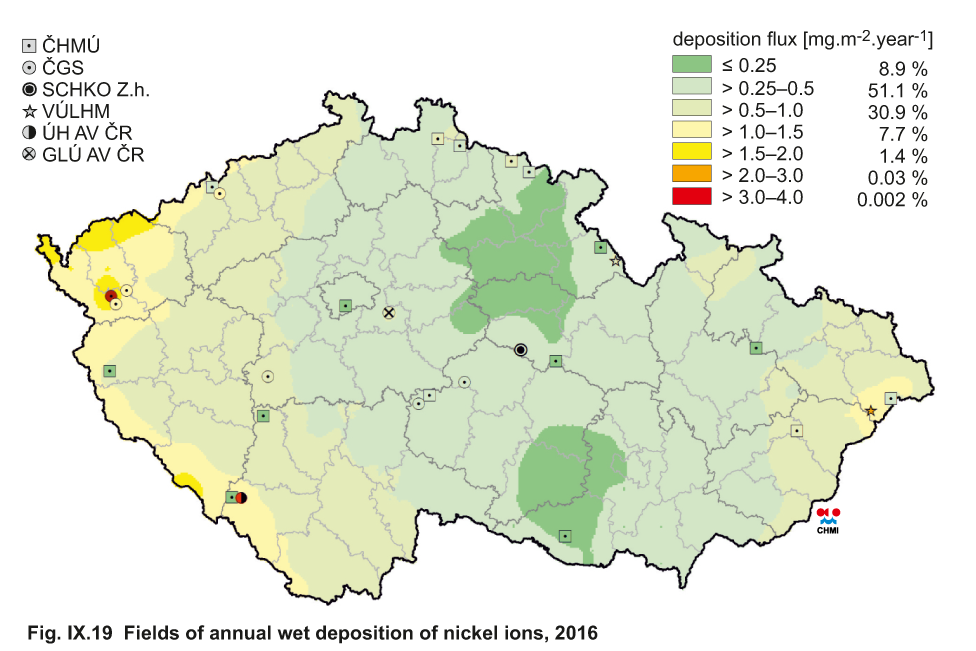
Fig. IX.19 Fields of annual wet deposition of nickel ions, 2016
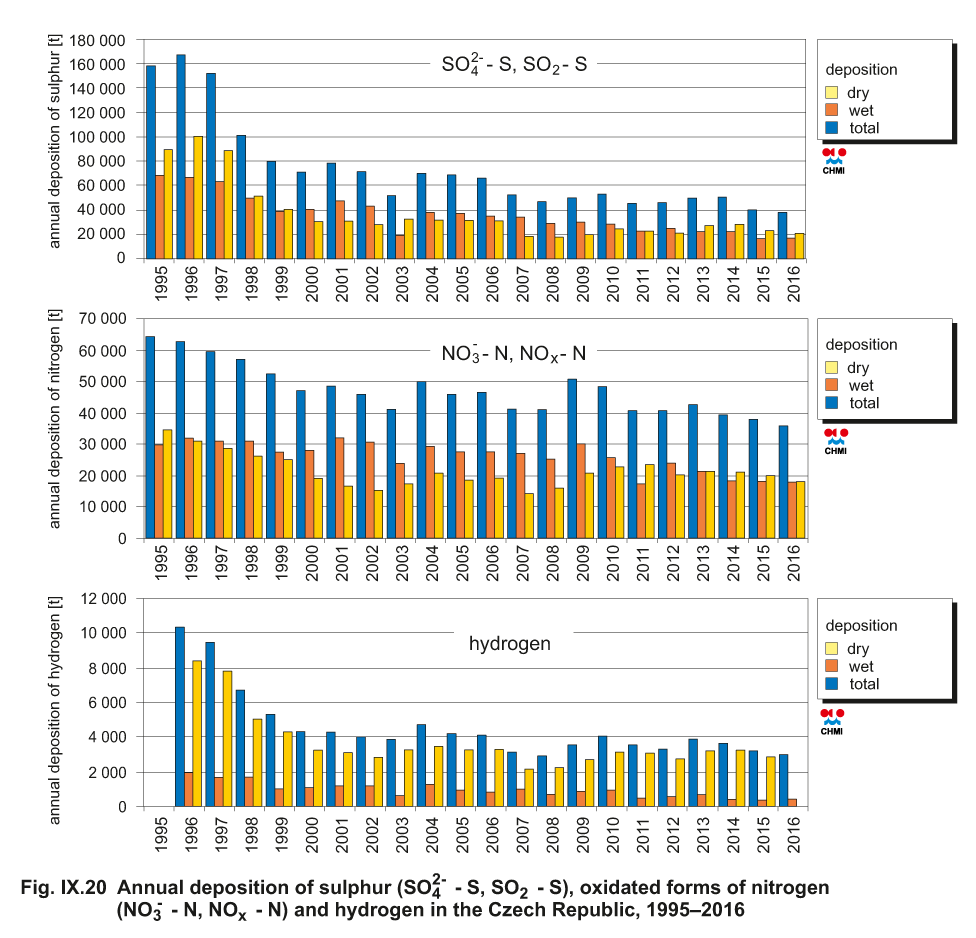
Fig. IX.20 The development of annual deposition of sulphur
(SO42- - S, SO2 - S), oxidated forms of nitrogen (NO3- - N, NOx
- N) and hydrogen in the Czech republic, 1995–2016
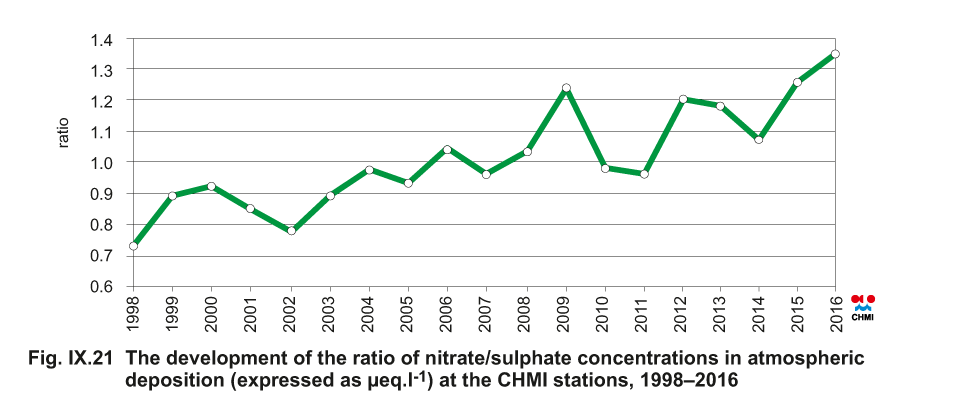
Fig. IX.21 The development of the ratio of nitrate/sulphate
concentrations in atmospheric deposition (expressed as µeq. l-1) at the CHMI stations, 1998–2016
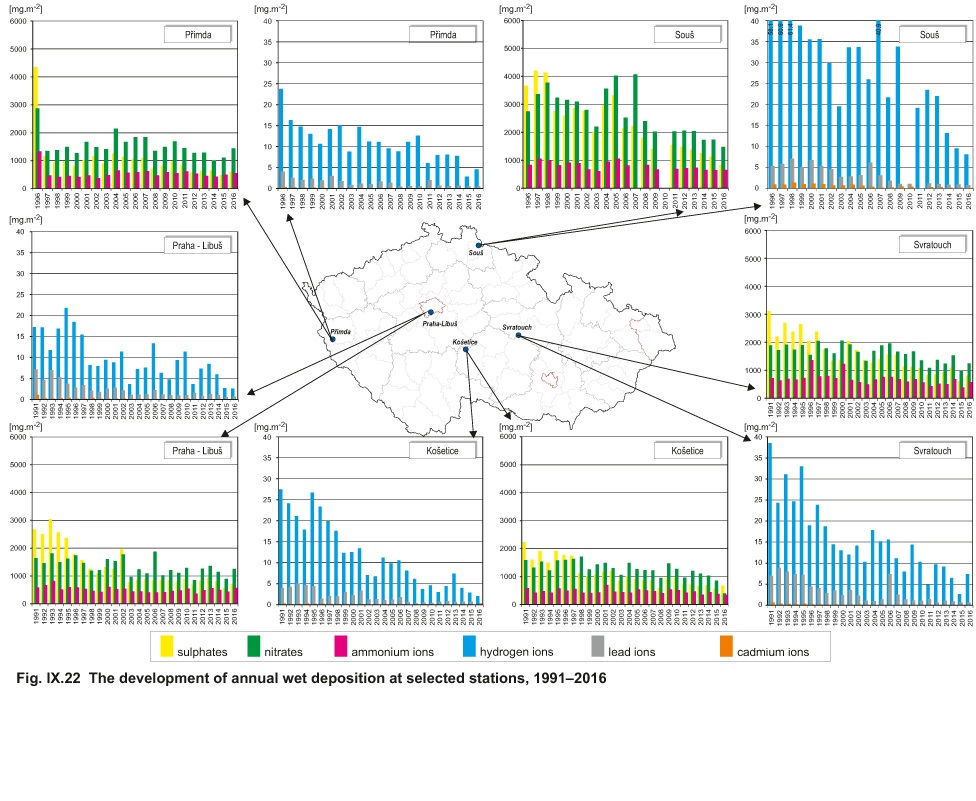
Fig. IX.22 The development of annual wet deposition at selected
stations, 1991–2016