IV.3 NITROGEN OXIDES
IV.3.1 Air pollution caused by nitrogen oxides in the year 2014
In monitoring and evaluating the quality of ambient air, the term nitrogen oxides (NOx) is understood to refer to a mixture of nitrogen oxide (NO) and nitrogen dioxide (NO2). The pollution limit level for protection of human health is set for NO2; the limit level for protection of ecosystems and vegetation is set for NOx.
Air pollution by nitrogen dioxide in 2016
in relation to the pollution limit level for
protection of human health
The annual pollution limit level for NO2 is exceeded only at a limited number of stations in locations with high traffic levels in agglomerations and large cities. Of the total number of 96 locations where nitrogen dioxide was monitored in 2016, the annual pollution limit level of 40 μg.m-3 was exceeded at 4.2% of stations (4 locations) (Tab. XIII.8). All four stations (Prague 2-Legerova (hot spot), Brno- Svatoplukova, Brno-Úvoz (hot spot) and Prague 5- Smíchov) are classified as urban traffic stations. The Prague 2-Legerova (hot spot) and Brno-Úvoz (hot spot) stations are also located in densely builtup areas, which substantially decrease ventilation. It can thus be assumed that the pollution limit values could also be exceeded at other places with high traffic levels, where measurements are not performed.
In 2016, the hourly concentrations of NO2 exceeded the pollution limit level of 200 μg.m-3 at a total of 3 stations (Tab. XIII.7). However, the maximum permitted number of 18 above-limit values per calendar year was not exceeded at any of them. Two cases of exceeding the pollution limit value were recorded at the Prague 5-Smíchov station, with one case at each of the Plzeň-Lochotín and Prague 2-Legerova stations (hot spot).
Greater pollution of cities by nitrogen oxides compared to rural locations is caused mainly by traffic. The greatest concentrations of NO2 are attained in Prague, Brno and Ostrava (Fig. IV.3.1). However, over most of the territory of the Czech Republic (99.9%), the average annual concentration was below 26 μg.m-3, i.e. the value of the detection limit. Higher concentrations of NO2 can occur close to urban roadways in municipalities with heavy traffic levels, more built-up areas and denser local traffic network. The limit level was exceeded at two Prague and two Brno traffic locations; however, as traffic stations have small representative diameters, these above-limit values are not reflected in the maps of annual above-limit values on the scale on which they are represented (Fig. IV.3.1). The concentration of NO2 exceeded the hourly value recommended by WHO for protection of human health (200 μg.m-3) at least once over 0.001% of the territory of the Czech Republic in 2016.
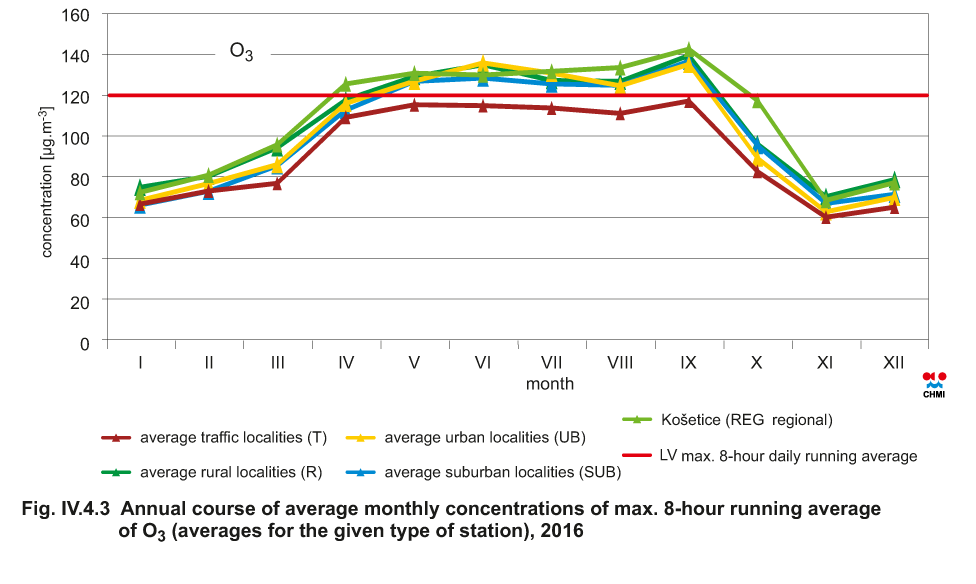
Higher concentrations of NO2 are measured at traffic locations than at other types of locations. In the April-September period, a decrease is generally apparent in the NO2 concentrations at all locations (Fig. IV.3.4). The decrease was caused by the greater intensity of solar radiation (especially with a wavelength of < 400 nm) in this season, resulting in photo-dissociation of NO2 to form NO and O (Warneck 2000). Tropospheric ozone is formed from the photo-dissociation products under suitable conditions and thus the tropospheric ozone concentrations are higher in the April-September period (Fig. IV.4.3).
Air pollution by nitrogen oxides in 2016 in
relation to the pollution limit level for protection
of eco-systems and vegetation
The pollution limit level for the average annual concentration of NOx (30 μg.m-3) was not exceeded in 2016 at any of the 19 rural stations with a sufficient amount of data for the evaluation (Tab. XIII.9, Fig. IV.3.8). The average annual concentration of NOx was lower than in 2015 at 87% of stations (13 of 15 locations) that carried out measurements in both 2015 and 2016.
Construction of the maps of the planar distribution of average annual NOx concentrations encompasses a combination of measuring and modelling. Values from all the stations measuring NOx were employed to construct the map of NOx fields, taking into consideration the above-mentioned information on emissions from mobile sources in the Czech Republic. Higher NOx concentrations can occur in the vicinity of local roadways in municipalities with heavy traffic levels and dense traffic networks where, however, concentrations are not measured. On the map, point markers designate only rural stations because only at these locations are the average annual NOx concentrations measured in relation to the pollution limit levels for protection of ecosystems and vegetation (Fig. IV.3.3).
IV.3.2 Trends in nitrogen oxide concentrations
During the 1990's there was a marked decrease in the average annual concentrations of both NO2 and NOx and also in the 19th highest hourly NO2 concentration. This was a result of the sharp decrease in emissions in this period as a result of the legal force of Act No. 309/1991 Coll., and the related introduction of new technological measures to reduce emissions. This was also affected by a change in the composition of industrial production and the vehicle fleet and also in the composition of automotive fuels. Meteorological and dispersion conditions have a great impact on inter-annual variations in NO2 and NOx concentrations and also on the concentrations of other pollutants. The relatively sharp decreasing trend in the 1990's lasted until 2000. Since then, there have been alternating increases and decreases in both the average annual concentrations and also in the 19th highest hourly concentration (Fig. IV.3.5). The most marked increases in the concentrations were recorded in 2003, 2006 and 2010, probably as a result of unfavourable meteorological and dispersion conditions in those years. Since 2011, it has been possible to observe a slowly decreasing trend in all the monitored characteristics (Fig. IV.3.6). In 2016, a further decrease occurred in the average annual concentration overall at all types of stations; however, at traffic stations alone there was a slight increase in average annual concentrations.
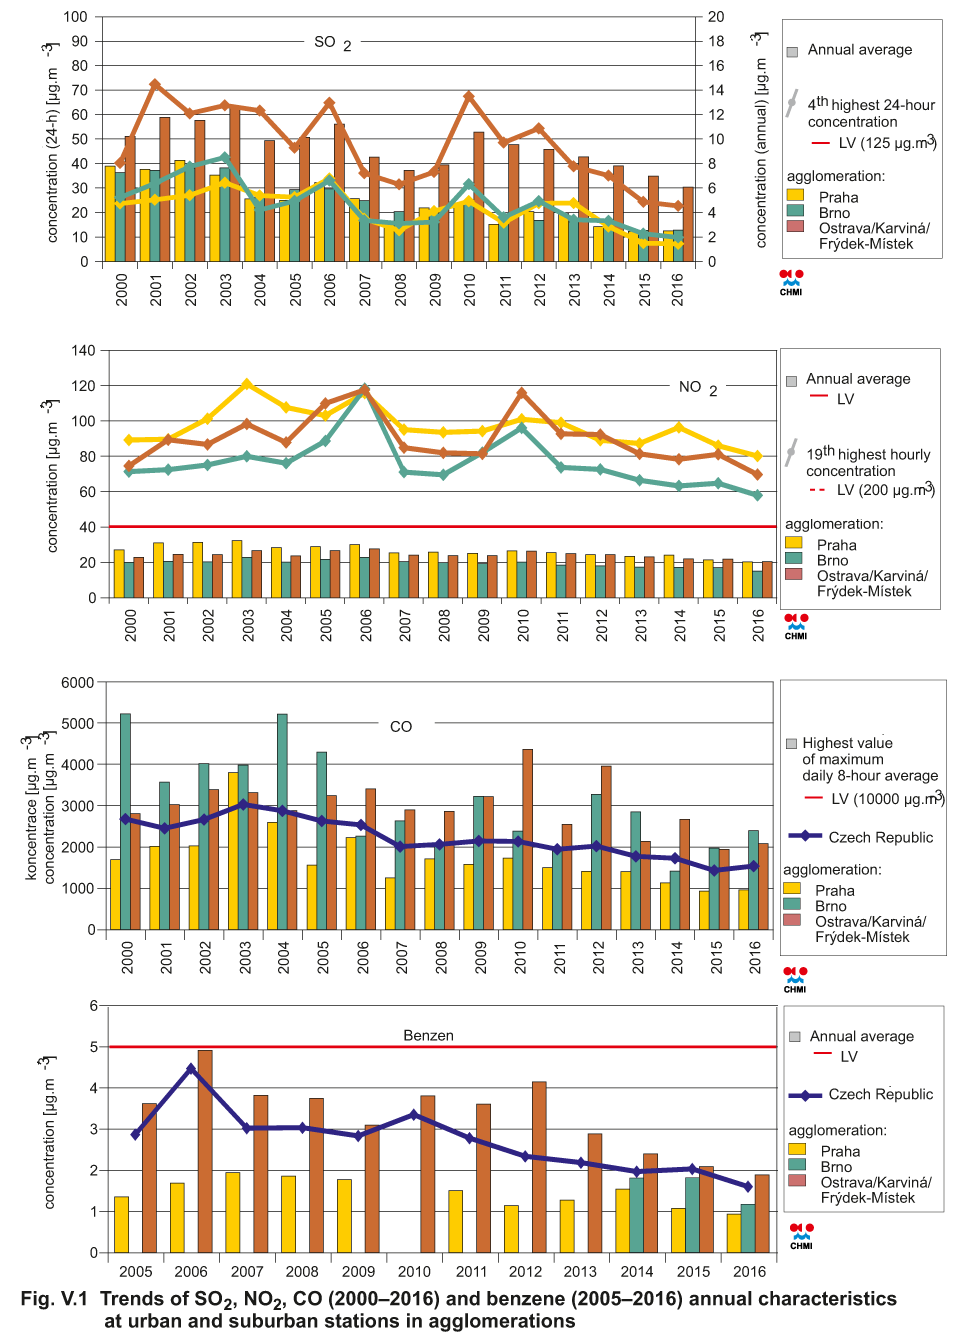
The highest values were attained in the monitored period (2000–2016) in the Prague and O/K/F-M agglomerations. This was because of the very high burdening of these areas by traffic and, at the O/K/F-M agglomeration, also industrial emissions. For example, in Prague, traffic is currently the most important source of nitrogen oxide emissions (ENVIS 2012). Of the monitored agglomerations, the lowest levels were measured in the Brno agglomeration (Fig. V.1).
IV.3.3 Emissions of nitrogen oxides
Nitrogen oxides (NOx) are formed in the combustion of fuels in dependence on the temperature of combustion, nitrogen content of the fuel and excess of combustion air and are also formed in some chemical-technological processes (production of nitric acid, ammonia, fertilisers, etc.). While in combustion of fuels, the fraction of NO2 in NOx emissions is about 5%, the fraction of NO2 in some chemical-technological processes can correspond to up to 100% of total NOx emissions (Neužil 2012).
The greatest amounts of NOx emissions are produced by transportation. Sectors 1A3biii – Road transport: Heavy duty vehicles and buses, 1A3bi – Road transport: Passenger cars and 1A4cii – Agriculture, forestry and fishing: Off-road vehicles and other machinery contributed 39.6% to national NOx emissions in 2015 (Fig. IV.3.9). 30.9% of all NOx emissions were emitted into the air in sector 1A1a – Public electricity and heat production. The decreasing trend in NOx emissions in the 2007–2015 period is related primarily to natural renewal of the vehicle fleet and the introduction of emission ceilings and stricter emission limit levels for NOx emissions from sources in sector 1A1a – Public electricity production and heat production (Fig. IV.3.10).
The contributions of the individual emission sources differ depending on the composition of sources in the given area. The production of NOx emissions is concentrated primarily along motorways, roadways with heavy traffic levels and in large cities and in the regions (Ústí, Central Bohemian and Moravian- Silesian) in which the most important energy production units are located (Fig. IV.3.11).
Tab. XIII.7 Stations with the highest values of the 19th and
maximum hourly concentrations of NO2
Tab. XIII.8 Stations with the highest values of annual average concentrations of NO2
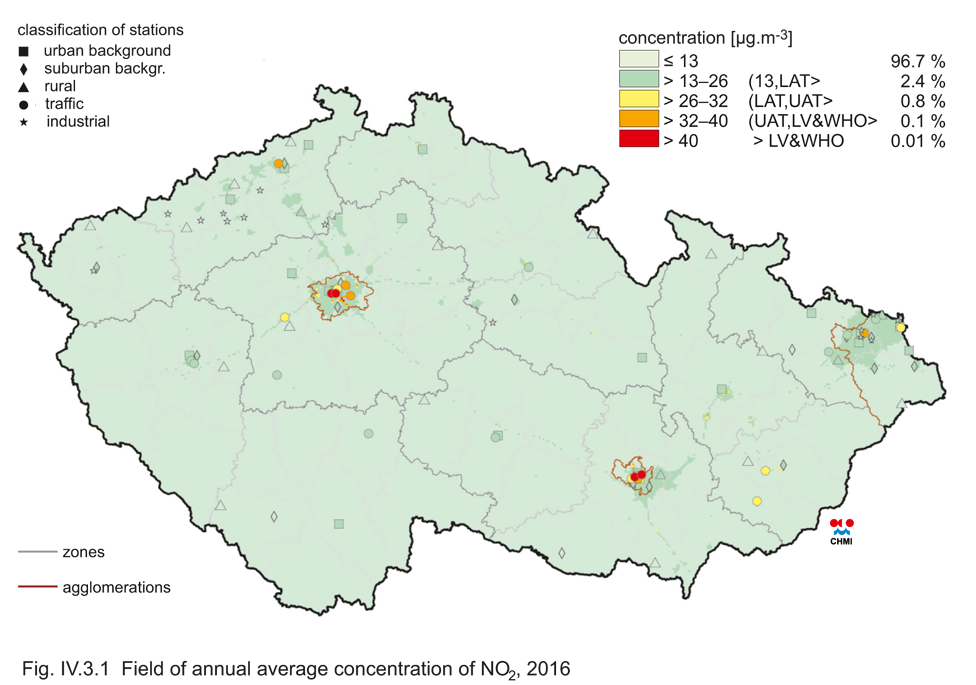
Fig. IV.3.1 Field of annual average concentration of NO2,
2016
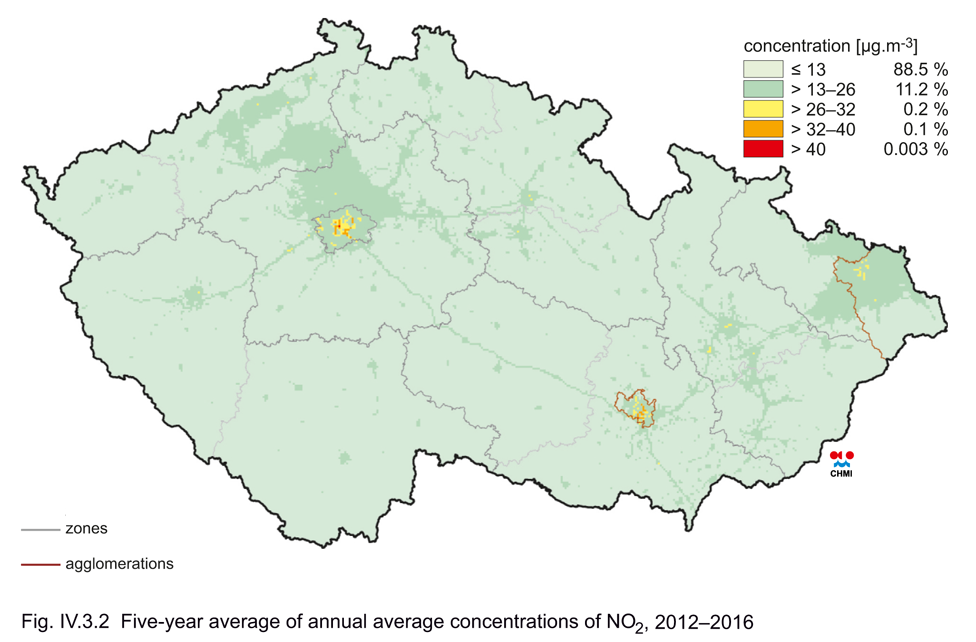
Fig. IV.3.2 Five-year average of annual average concentrations
of NO2, 2012–2016
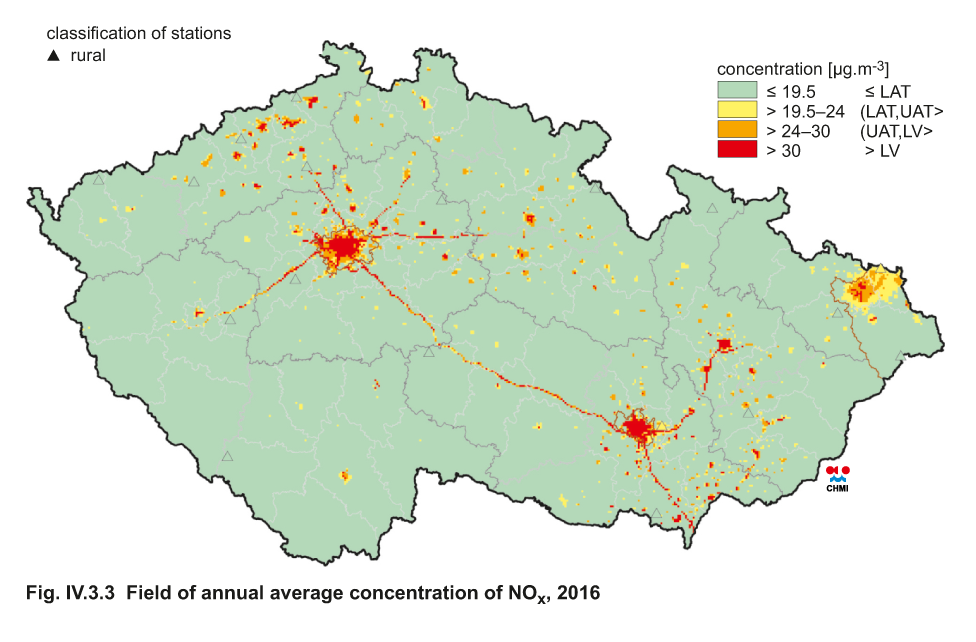
Fig. IV.3.3 Field of annual average concentration of NOx, 2016
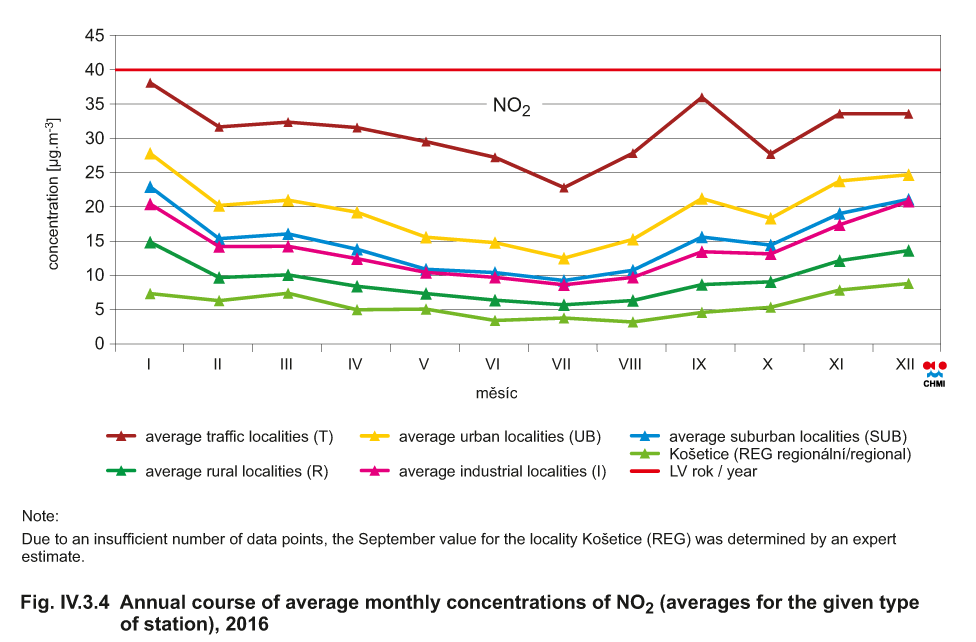
Fig. IV.3.4 Annual course of average monthly concentrations of
NO2 (averages for the given type of station), 2016
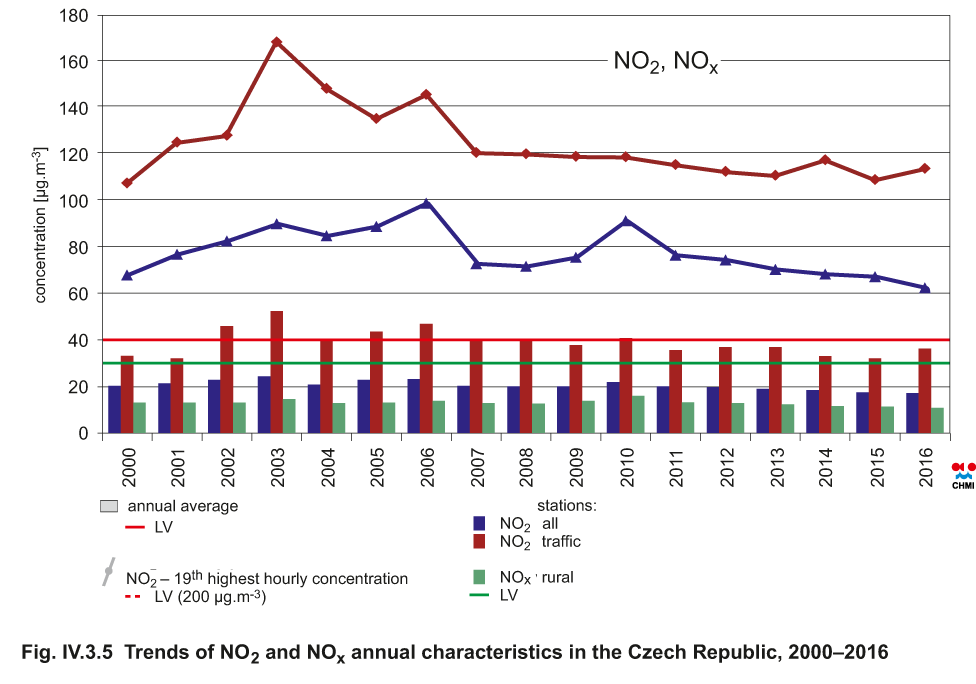
Fig. IV.3.5 Trends of NO2 and NOx annual characteristics in the
Czech Republic, 2000–2016
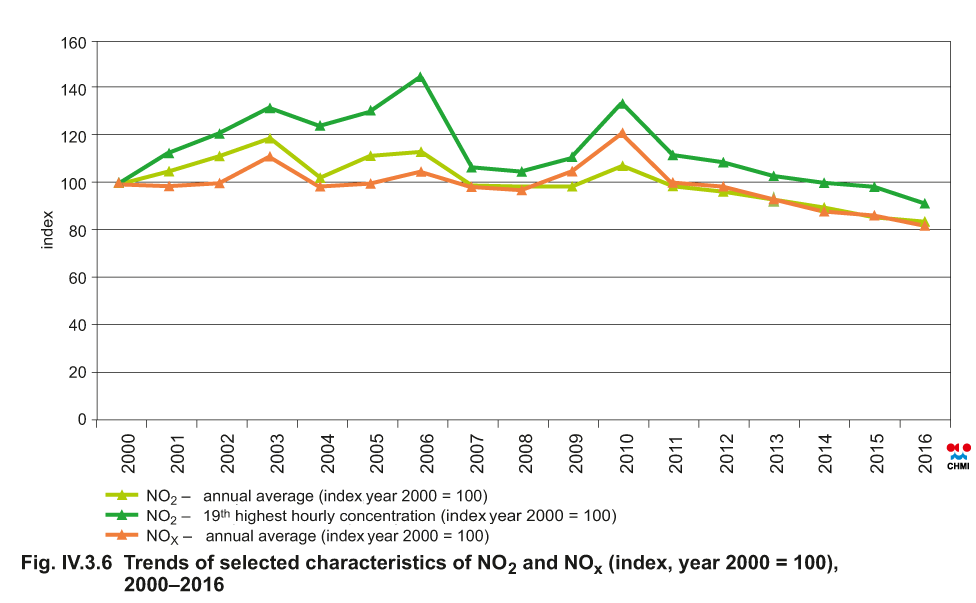
Fig. IV.3.6 Trends of selected characteristics of NO2 and NOx
(index, year 2000 = 100), 2000–2016
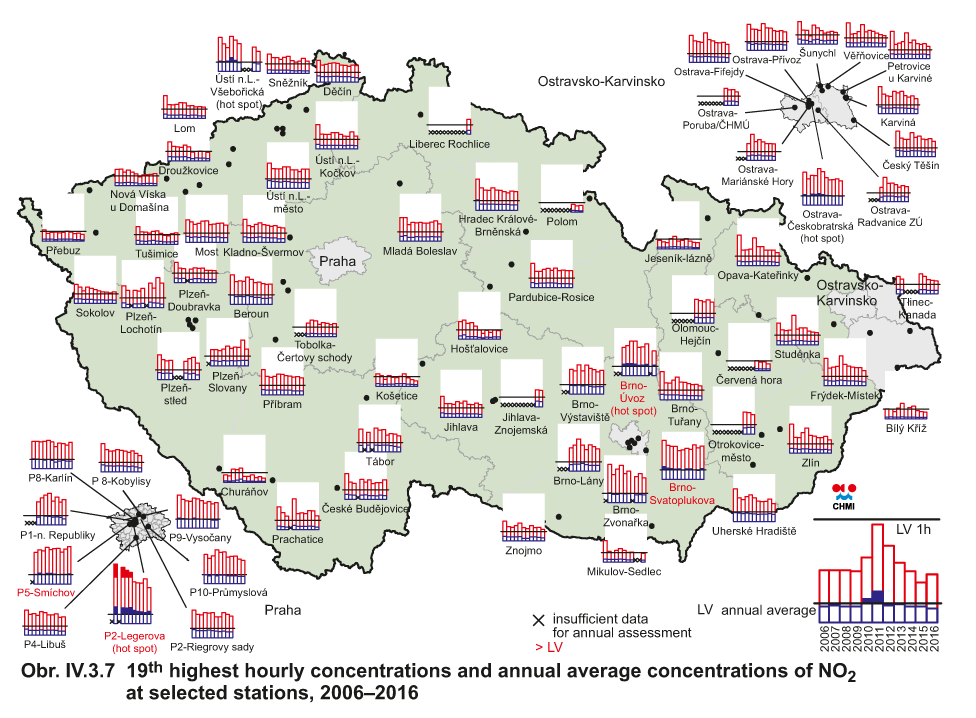
Fig. IV.3.7 19th highest hourly concentrations and annual
average concentrations of NO2 at selected stations, 2006–2016
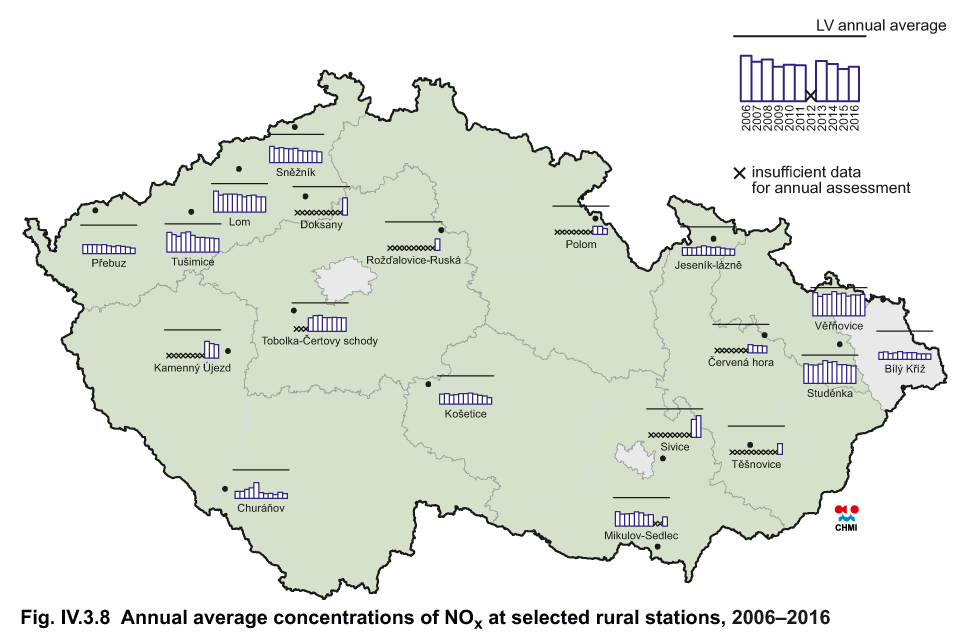
Fig. IV.3.8 Annual average concentrations of NOx at selected
rural stations, 2006–2016
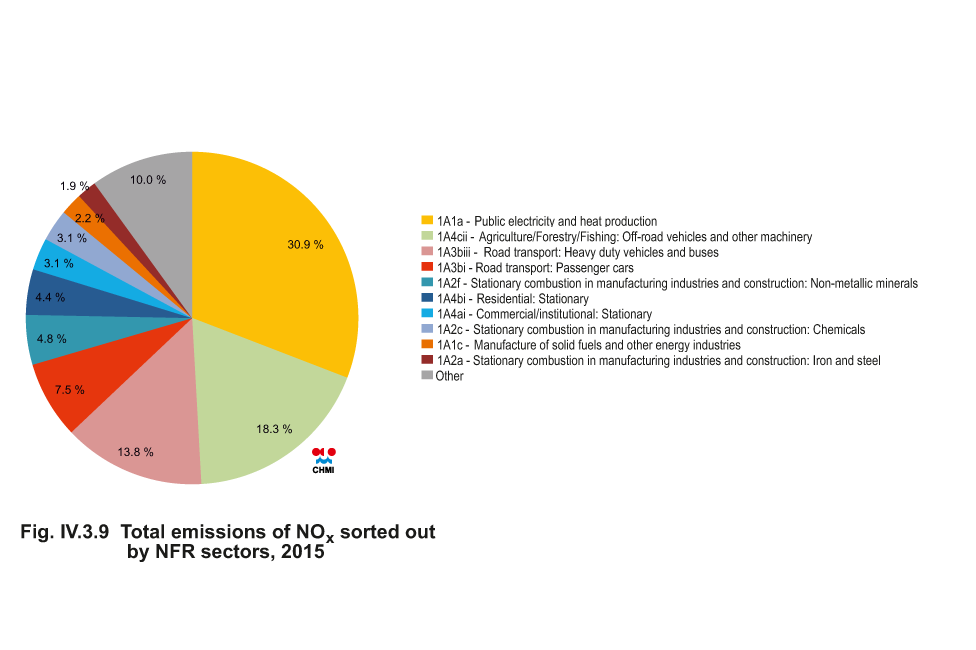
Fig. IV.3.9 Total emissions of NOx sorted out by NFR sectors,
2015
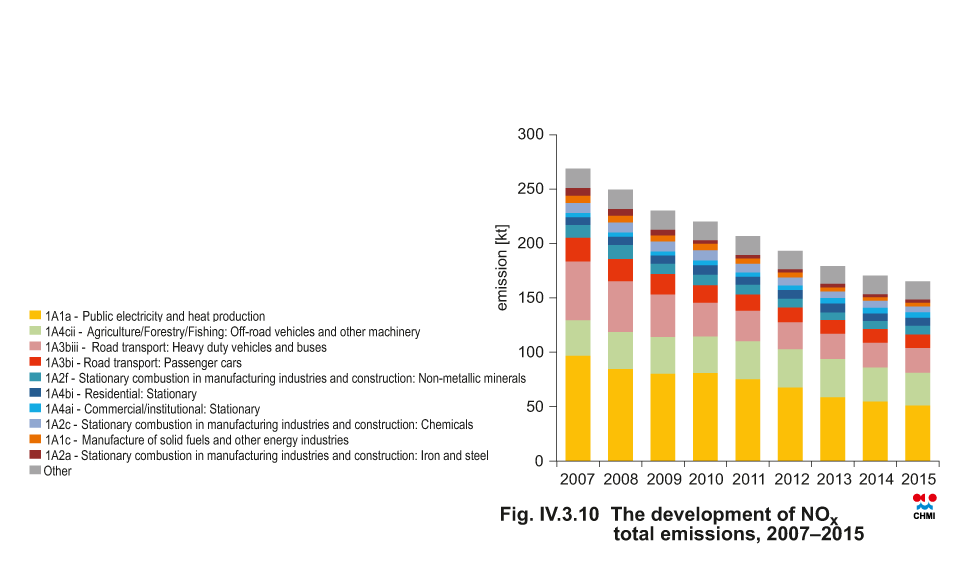
Fig. IV.3.10 The development of NOx total emissions, 2007–2015
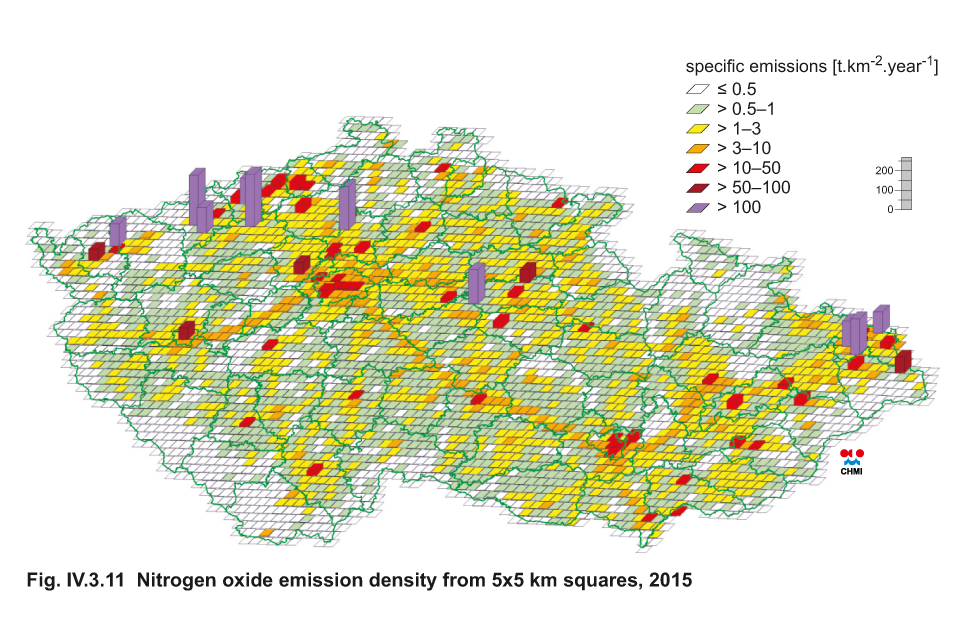
Fig. IV.3.11 Nitrogen oxide emission density from 5x5 km squares,
2015