VI. SMOG WARNING AND REGULATORY SYSTEM
The CHMI, on behalf of the Ministry of the Environment, operates the Smog Warning and Regulatory System (SWRS). Information provided through this system serves both for informing about extraordinary levels of ambient air pollution (smog situations) and for the regulation (reduction) of pollutants released from selected sources significantly influencing ambient air quality in the given area. The pollutants being monitored include the PM10 fraction suspended particles, sulphur dioxide (SO2), nitrogen dioxide (NO2) and ground-level (tropospheric) ozone (O3).
Since 1 September 2012, the operation of the SWRS is laid down by the Air Protection Act No. 201/2012 Coll. and by Decree No. 330/2012 Coll. The main changes in comparison to the previous legislation are described in the CHMI yearbook for the year 2012 (CHMI 2013a) and in an article by Juras and Vlček (2013). Smog situations and regulatory regimes (as well as warnings about ozone levels) are declared on the basis of exceedances of threshold values. Under the current system of rules governing the SWRS (Table VI.1) smog situations and regulatory regimes for PM10 are declared and withdrawn with a delay relative to the actual development of concentra- tions. The CHMI has therefore prepared a draft amendment of Annex No. 6 to the Air Protection Act that is aimed at the elimination of this drawback (Vlček et al. 2015).
The current list of regions and stations representative of PM10, SO2 and NO2 levels (Fig. VI.1, VI.3, VI.4) is stipulated by the Journal of the Ministry of the Environment1; in the case of O3 (Fig. VI.2), it is specified by the CHMI director’s directive on the implementation of the Smog Warning and Regulatory System (SWRS) in the Czech Republic. In 2015 the list published in the Journal of the Ministry of the Environment No. 6/2014 applied to PM10, SO2 and NO2. Applicable after November 2015 was the list published in the Bulletin of the Ministry of the Environment No. 10/2015. Throughout the year, the list provided by the CHMI director’s directive No. 2013/05 applied for O3.
PM10, SO2 and NO2
Smog situations in 2015 were declared due to excee- dances of threshold values for PM10 suspended particles and SO2. Similarly as in previous years, no smog situation was declared because of NO2. Nine smog situations were declared in 2015 due to high concentrations of suspended PM10 particles, lasting a total of 418 hours (ca 17 days; Table VI.2). Eight of them were declared in the first decade of November in the O/K/F-M agglomeration excluding the Třinec area, the Prague agglomeration and the Brno agglomeration, in the Ústí nad Labem region, the Hradec Králové region and the Pardubice region, and in the Central Bohemia zone and the Central Moravia zone (Table VI.3). The overall small number of declared smog situations was associated with more favourable dispersion conditions in the cold part of the year as a consequence of abnormally warm weather and a numerous frontal systems crossing the territory of the Czech Republic. In 2015 the regulatory threshold value for PM10 was exceeded at two representative SWRS stations; however, the legal conditions for imposing a regulatory regime were not met.
Besides smog situations, all SWRS stations also recorded exceedances of the daily limit value for PM10. The best situation was in the Liberec region (1.6 % of days) and the Karlovy Vary region (1.9 % of days). By contrast, the greatest number of days with exceedances of the daily limit value was recorded in the O/K/F-M agglomeration excluding the Třinec area (23.8 % of days; Table VI.4).
In 2015, for the first time since 1997, a smog situation was declared due to high concentrations of sulphur dioxide (SO2), with a total duration of 14 h (Table VI.5). In the Ústí nad Labem region, a strong high-altitude inversion was maintained for several days and gradually turned into a ground-level inversion. This caused slow air flow and highly unfavourable dispersion conditions that allowed the accumulation of pollutants from sources close to the ground. After the perturbation of the inversion during midday hours of 5 November, pollutants from tall sources that had accumulated in upper parts of the stable inversion layer reached the ground. This caused concentrations of SO2 at the station Lom to rise sharply, and in three consecutive hours, the informative threshold value for declaring a smog situation was exceeded. Concentrations of SO2 remained high for several hours. An analogous (albeit not as pronounced) progression could be observed at other AIM stations. The situation improved before the next day, so the smog situation could be withdrawn in morning hours of 6 November (Table VI.6). In 2015 the regulatory threshold value for SO2 was not exceeded at any of the representative stations (Fig. VI.6).
Besides the smog situation, the hourly ambient limitfor SO2, was exceeded at several SWRS sta- tions, namely in the Northwest zone (0.3 % of days; Table VI.7).
Even though threshold values for NO2 were exceeded at some SWRS stations during the course of the year, other conditions for declaring a smog situation or regulation were not met, so none was declared.
Ground-level ozone
In 2015, 24 smog situations were declared due to high concentrations of ground-level ozone. Their total duration was 2,386 hours (ca 102 days; Table VI.8). Smog alerts were most frequently (4x) issued in the Prague agglomeration (325 h) followed (3x) by the Central Bohemia zone (306 h) and the Ústí nad Labem region (283 h; Table VI.9). No smog warning was issued in any of the SWRS areas.
Besides exceedances of threshold values, the daily limit value for O3 (maximum daily 8-hour running average) was also exceeded (the first exceedance at the SWRS stations occurred on 21 March and the last one on 2 September).
The situation in individual SWRS regions was balanced; the percentage of days on which the limit values for ozone were exceeded at one of the representative stations varied from 10 to 17 % (Table VI.10).
Synoptic situation during selected smog situations
4–5 July 2015 (O3)
Throughout this period, the weather in the Czech
Republic was influenced by an area of high pressure,
whose centre was moving slightly to the southeast
from the Baltic states across the Ukraine. Along its
rear edge, an inflow of very warm air from the
southwest was gaining force. During the course of
5 July, a trough of low pressure associated with
a cold front moved into Central Europe. During
the night of 6 July, this front passed across the
Czech Republic further east, followed by colder
air from the northwest.
6–17 August 2015 (O3)
At the beginning of August, there was an exceptionally
long and intensive heat wave. The entire
period was characterized by hot sunny weather with
maximum temperatures of around 35 °C and slow
wind. On 6 and 7 August, the inflow of very warm air
into the Czech Republic from the south strengthened
along the rear edge of an anticyclone situated over
Eastern Europe. During the course of 8 and 9 August,
the weather in the Czech Republic came under the
influence of a waving cold front, which brought
a very slight drop in temperatures and local precipitation.
During the night of 10 August, this front
moved back over Western Europe. An area of lower
pressure then extended into Central Europe first
from the south and later from the southwest, and
very warm and relatively dry air stayed above
Central Europe. Due to this dry air, precipitation
occurred only in isolated cases. On 15 August
a weakening waving front moved east across the
Czech Republic. Another waving cold front passed
over the Czech Republic during the course of
16 August and remained there until 18 August.
During these days, this front brought heavy with
three-day precipitation sums of 30 to 100 mm in
most of the Czech Republic (except south and south-
west Bohemia and Silesia, they were mostly below
30 mm), accompanied by a significant temperature
drop (Fig. VI.7).
30 October – 8 November 2015 (PM10)
At the end of October, an extensive area of high
air pressure that also extended into Central Europe
formed above Scandinavia and Eastern Europe.
Along the rear edge of this area of high pressure,
warm air flowed into Central Europe from the south,
especially in upper layers of the atmosphere. The
centre of the high-pressure area moved across Eastern
Europe over the Carpathians, where it stayed from
1 to 3 November. Gradually, the high-pressure area
extended from Eastern Europe all the way to
Southern and Southwestern Europe. Along its
northwestern edge, the weather in the Czech
Republic was partly influenced by the southern
edges of occluded fronts on 5 and 6 November and
a frontal system on 7 November. This frontal system
also brought a more significant improvement of
dispersion conditions. During this distribution
of air pressure phenomena at the end of October,
a temperature inversion formed above the Czech
Republic at altitudes between 1,000 and 1,500 m.a.s.l.
On 1 November this inversion strengthened further,
and especially during the night and in the morning
it spanned from the ground up to altitudes of
1,000 to 1,500 m.a.s.l. In morning hours between
2 and 4 November, air temperatures at these
altitudes were up to 20 °C greater than those
measured 2 m above ground. Sunny weather pre-
vailed, locally with fogs and low clouds. During the
course of 6 and 7 November, the period of strongly
inverted weather with adverse dispersion conditions ended in connection with frontal movements,
especially in Bohemia (Fig.
VI.8).
Tab. VI.1 The rules for the announcement and cancelling of
smog situations and regulations (alerts)
Tab. VI.2 Smog situations and regulations for PM10 – number and duration, 2015
Tab. VI.3 Smog situations and regulations for PM10 – dates and times of announcement, 2015
Tab. VI.5 Smog situations and alerts for SO2 – number and duration, 2015
Tab. VI.6 Smog situations and alerts for SO2 – dates and times of announcement, 2014
Tab. VI.8 Smog situations and alerts for O3 – number and duration, 2015
Tab. VI.9 Smog situations and alerts for O3 – dates and times of announcement, 2015
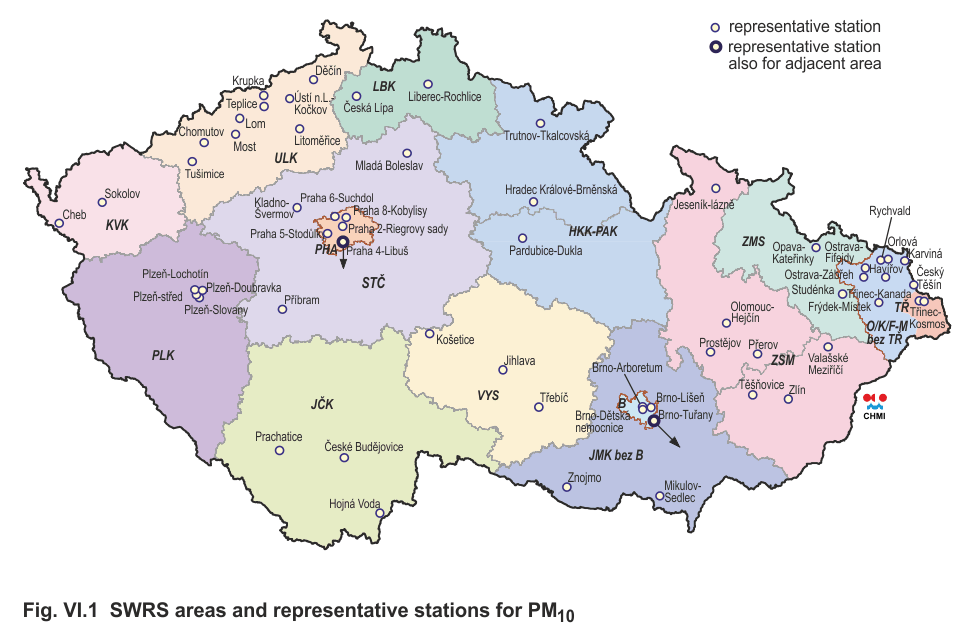
Fig. VI.1 SWRS areas and representative stations for PM10
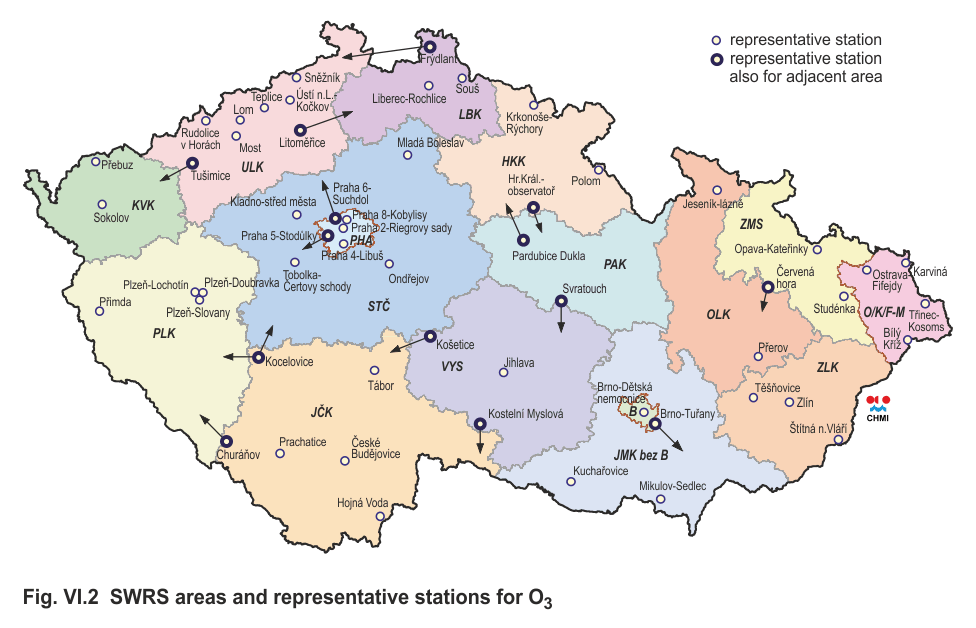
Fig. VI.2 SWRS areas and representative stations for O3
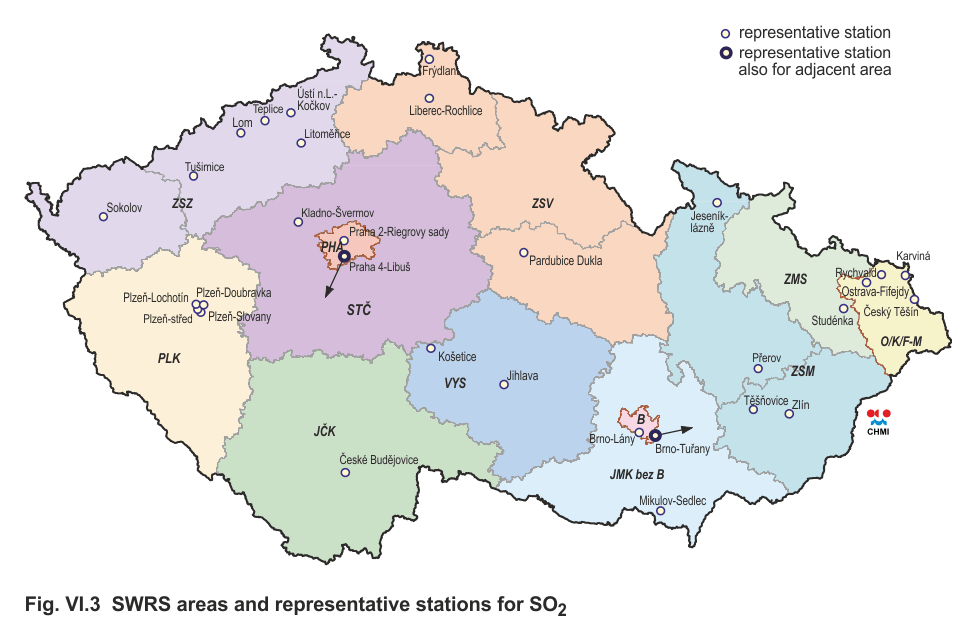
Fig. VI.3 SWRS areas and representative stations for SO2
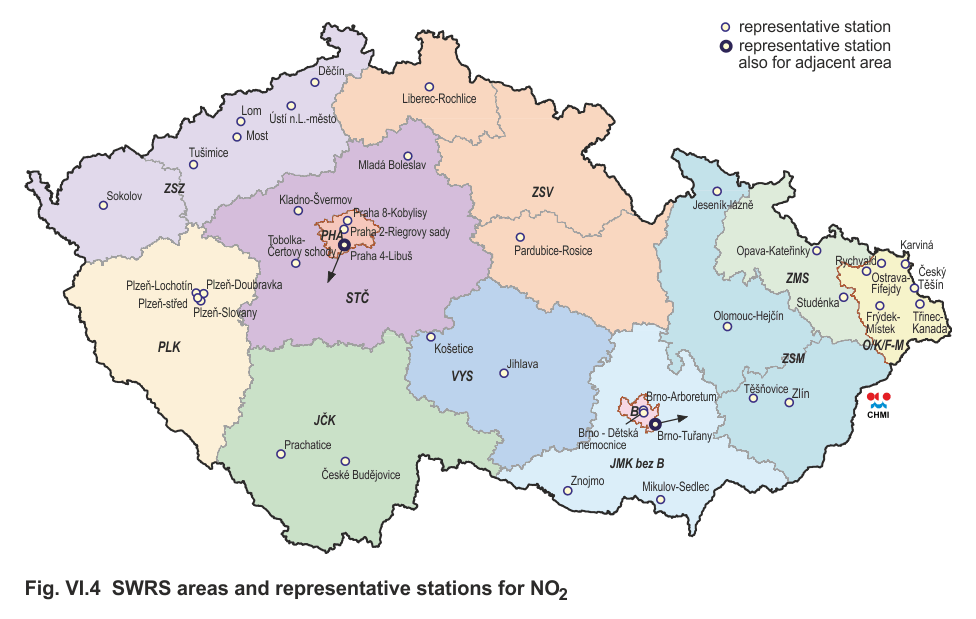
Fig. VI.4 SWRS areas and representative stations for NO2
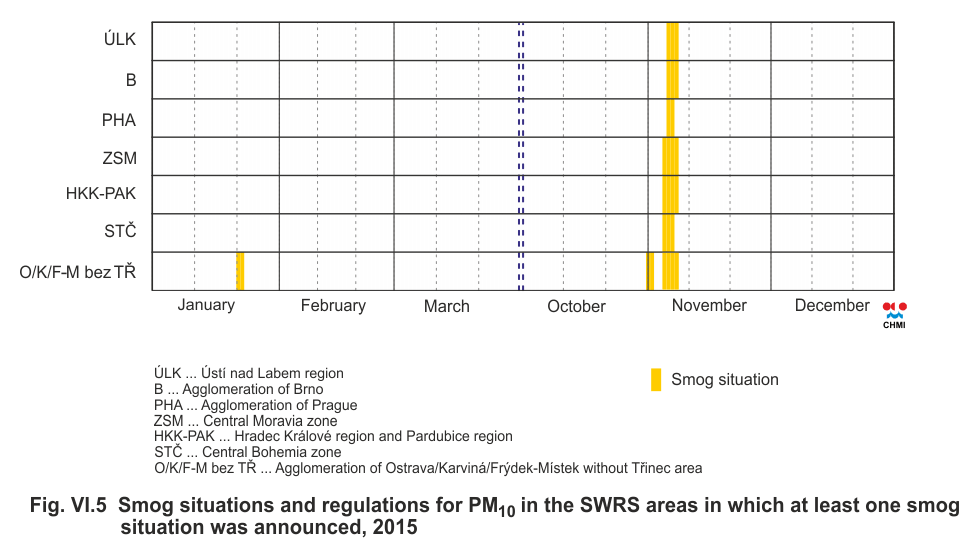
Fig. VI.5 Smog situations and regulations for PM10 in the SWRS
areas in which at least one smog situation was announced, 2015
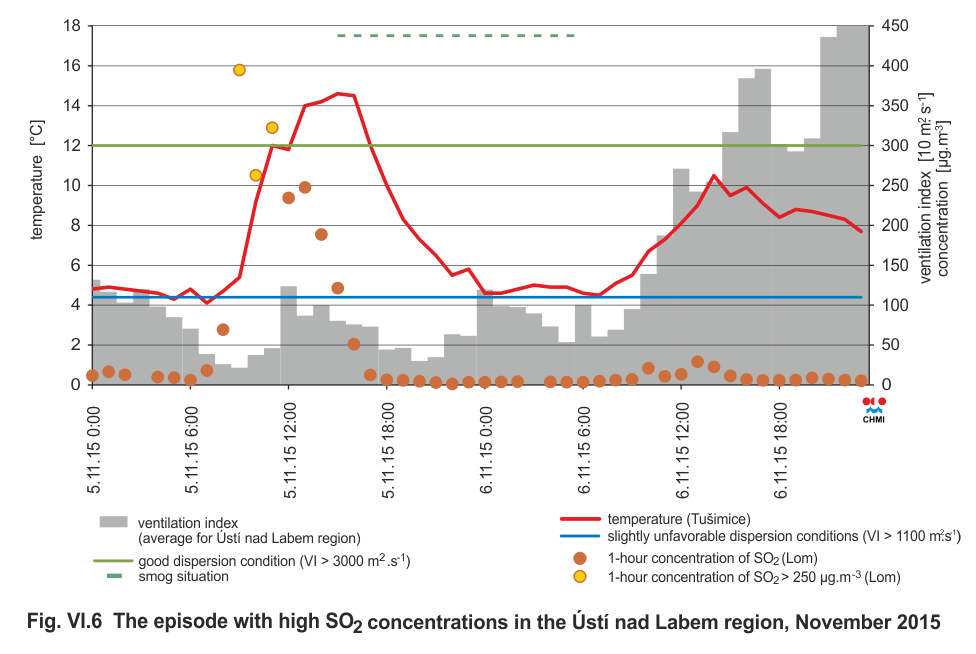
Fig. VI.6 The episode with high SO2 concentrations in the Ústí nad Labem region, November 2015
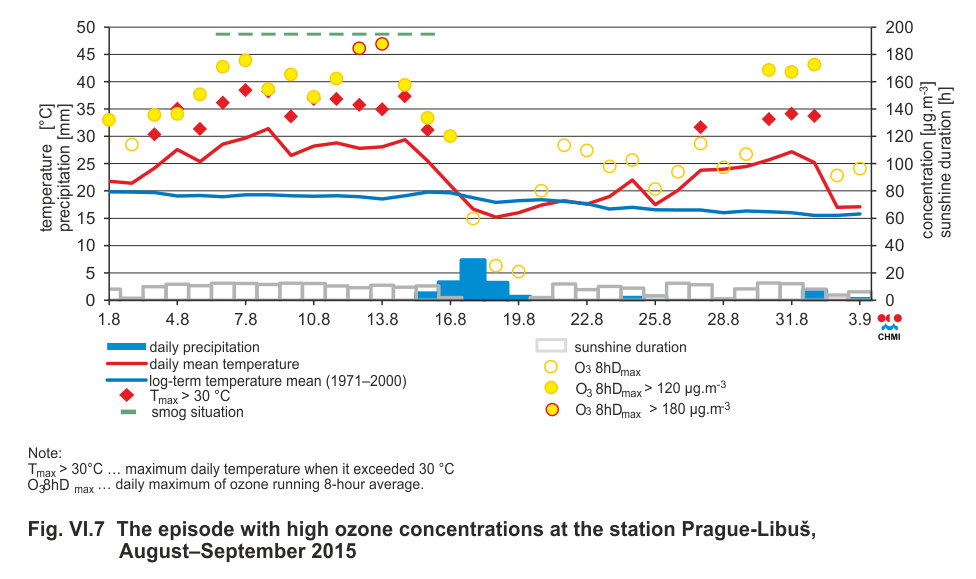
Fig. VI.7 The episode with high ozone concentrations at the
station Prague-Libuš, August-September 2015
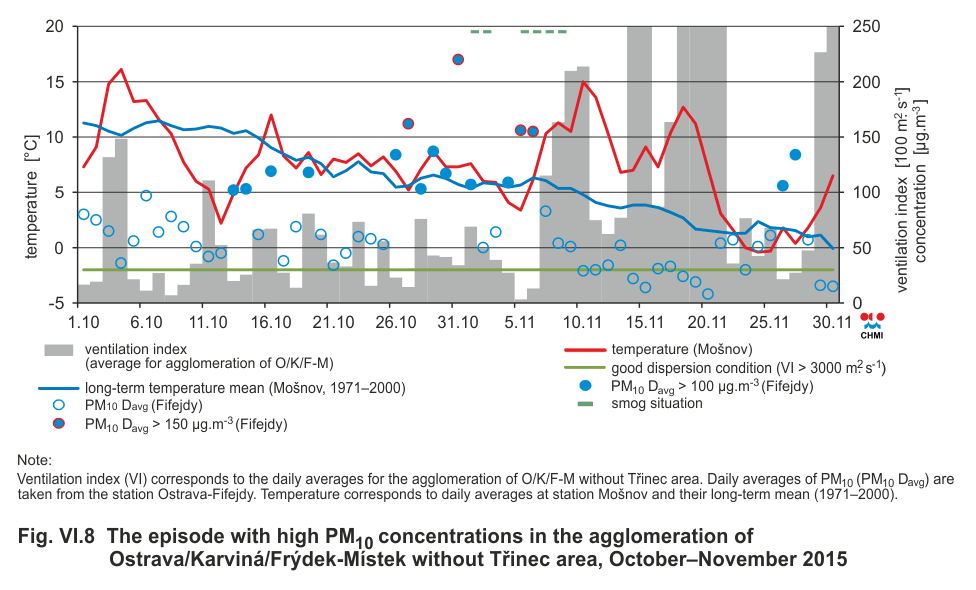
Fig. VI.8 The episodes with high PM10 concentrations in the
agglomeration of Ostrava/Karviná/Frýdek-Místek without Třinec
area, October-November 2015
1http://www.mzp.cz/osv/edice.nsf/a02fcb9439f4537fc1256fbe00491592/d3a2552eaf70c5c6c1256f54004c5d2a?OpenDocument