V.4 AIR QUALITY INDEX IN TOWNS AND CITIES
The Air Quality Index (hereafter AQI) is a measure presenting an overall picture of air quality at a given measuring station. AQI for the year 2014 has been calculated based on an assessment of hourly concentrations of nitrogen dioxide (NO2), ground-level ozone1 (O3) and suspended particles (PM10) carried out so as to characterize air quality as best as possible with regard to limit values for the protection of human health, which are set by the current legislature. The air quality index takes on six values. Thresholds between these levels are derived from limit values – in the case of ground-level ozone from information and warning limit values (Tab. V.4.1). For the calculation of the AQI, 28 urban and suburban automated air pollution monitoring stations, concurrently measuring all three pollutants, were selected.
The AQI was ascertained separately for each measured value at each location, and only the highest AQI is included in the presentation. For the calculation of the maximum, hourly values of concentrations of all three pollutants had to be in force in the given hour.
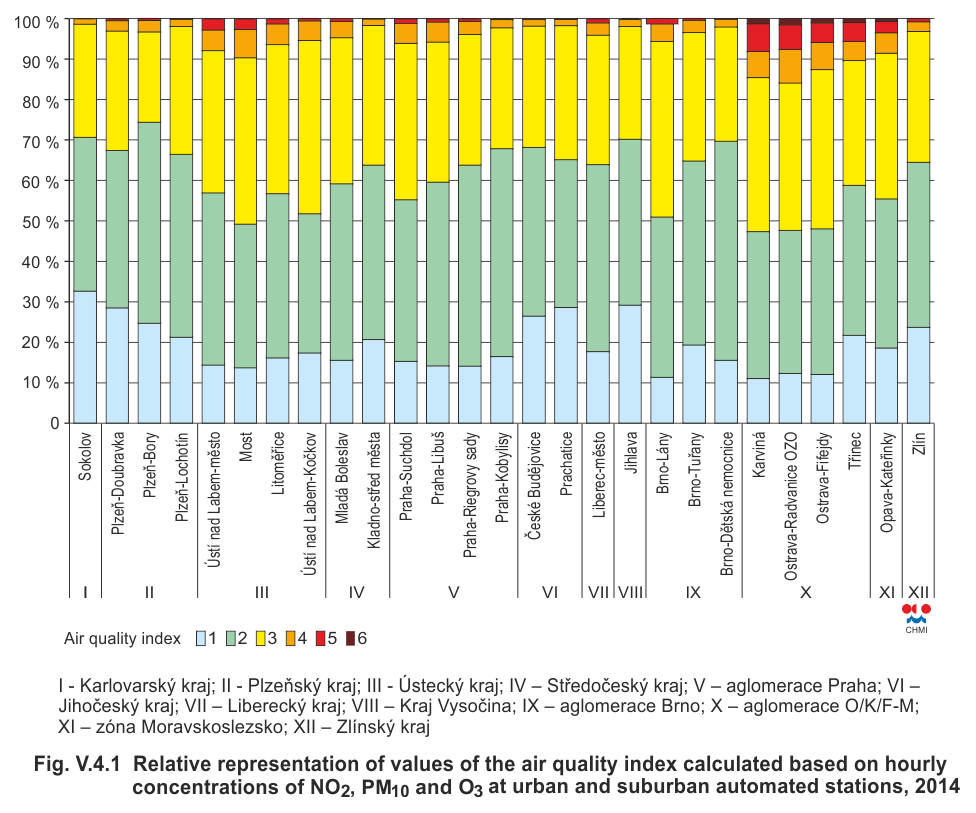
In 2014 very good and good air quality (index levels 1 and 2) exceeded the 50 % frequency threshold at almost all selected localities except those in the O/K/F-M agglomeration and in the Ústí nad Labem region. The lowest frequency of index levels 1 and 2 was recorded in the town of Karviná, at the localities Ostrava-Fifejdy and Ostrava-Radvanice OZO (O/K/F-M agglomeration), and at the locality Most (Ústí nad Labem region). Conversely, the highest frequency of index levels 1 and 2 (over 70 %) was recorded at the locality Plzeň-Bory (Pilsen region), Sokolov (Karlovy Vary region) and Jihlava (Vysočina region).
Satisfactory and compliant air quality (indices 3 and 4) reached frequencies between 30 and 48 %. Frequencies above 40 % were reached at eleven locations – Ústí nad Labem-město, Most, Litoměřice, Ústí nad Labem-Kočkov (Ústí nad Labem region), Praha-Suchdol (Prague agglomeration), Brno-Lány (Brno agglomeration), Ostrava-Fifejdy, Ostrava-Radvanice OZO, Karviná (O/K/F-M agglomeration) and Opava-Kateřinky (Moravian-Silesian zone without the O/K/F-M agglomeration).
Bad to very bad air quality (index levels 5 and 6) reached frequencies between 0 and 8 %. The highest frequency was reached at the localities Karviná, Ostrava-Radvanice OZO, Ostrava-Fifejdy, Třinec2 (O/K/F-M agglomeration) and Opava-Kateřinky (Moravian-Silesian zone without the O/K/F-M agglomeration). The sixth level of the index was not reached at all at the localities Sokolov (Karlovy Vary region), Plzeň-Lochotín (Pilsen region), Mladá Boleslav and Kladno-střed města (Central-Bohemian region), České Budějovice and Prachatice (South-Bohemia region) and Brno-Dětská nemocnice (Brno agglomeration). At the remaining localities, the frequency of this index level varied under 3 % (Fig. V.4.1).
Tab. V.4.1 Air quality index based on concentrations of
pollutants
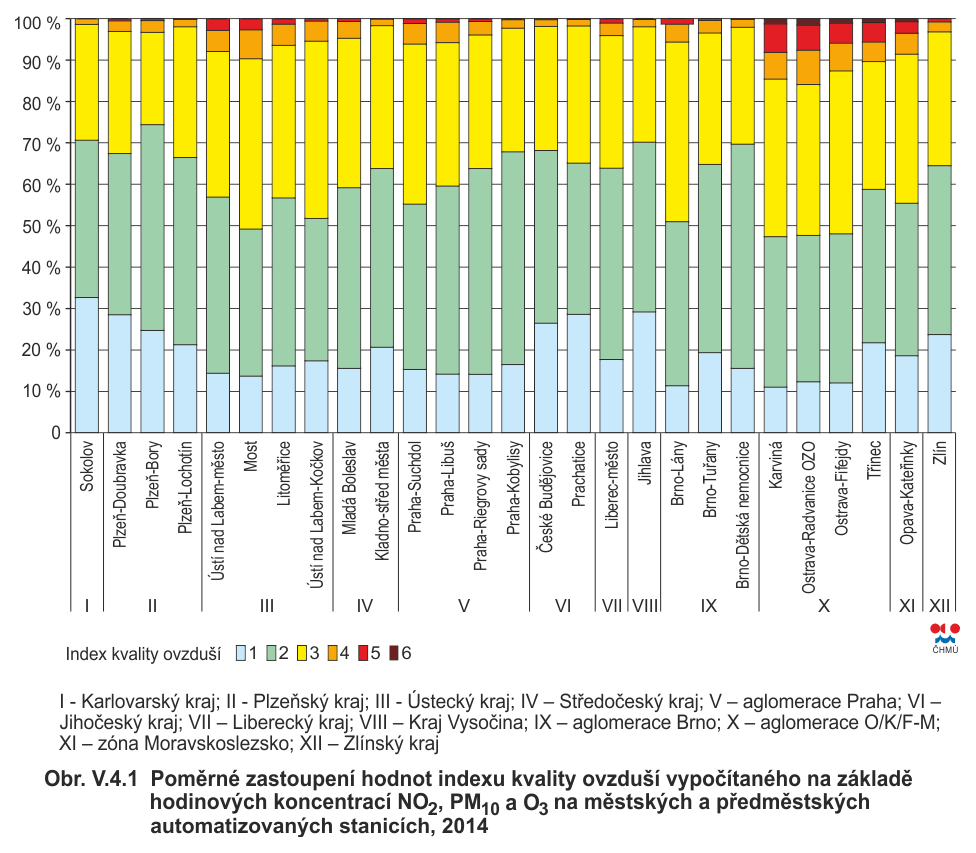
Fig. V.4.1 Relative representation of values of the air
quality index calculated based on hourly concentrations of NO2,
PM10 and O3 at urban and suburban automated stations, 2014
1For analyses outside the summer season (April – September), concentrations of O3 are considered at the level corresponding to the 1st degree of AQI, i.e. very good air quality. This method does not influence the overall AQI assessment, nor distort the structure of AQI for O3.
2Values of the AQI were computed by combining data from the stations Třinec-Kosmos (O3 and PM10) and Třinec-Kanada (NO2).