V.2 AGGLOMERATION OF BRNO
The agglomeration of Brno is located in the centre of the South Moravia region. It is identical with the administrative territory of the city of Brno. As concerns ambient air quality, Brno is one of the three agglomerations, and as such it is not included in the South-eastern zone. The area of the agglomeration is 230.22 km2, and the number of its inhabitants is 377,508 (400,059 including foreigners; source: MV ČR data as of 1/1/2014, data of the CSO as of 1.1.2014).
Limit values for the protection of human health are exceeded in the long term in Brno, namely in the cases of suspended particles PM10 and PM2.5, benzo[a]pyrene, and in parts of the agglomeration with the heaviest traffic loads also in the case of NO2. The part of the agglomeration where the limit value for daily PM10 concentrations is exceed may range from several per cent (2013) to almost the entire territory of the agglomeration (2010), which depends mainly on meteorological conditions in the cold part of the year (see below). Similar variability exists as concerns the fraction of the territory where the limit value for benzo[a]pyrene is exceeded; however, due to the very small number of stations, the highest degree of uncertainty in defining this fraction may occur. As concerns average annual concentrations of PM10, not a single area where this limit value is exceeded has been defined in the territory of the Brno agglomeration since the year 2008. The areas of the territory exceeding the limit value for the average annual concentration of NO2 are constant in the long term (on the order of several per cent) and are found near the busiest transport routes (Table V.2.1).
The greatest share in the increased concentrations of the above pollutants is contributed by traffic. Historically, Brno is a city located on the crossroad of communications. Multiple important traffic communications intersect the Brno territory even today (highways D1 and D2, expressways R52 to Vienna and R43 to Svitavy). Due to the as yet unfinished bypass from D1 the direction to Svitavy, the already high number of cars in Brno is increased daily by transit traffic going through the city centre. The fluency of transit traffic is not ensured because the outer ring road around Brno is not complete. All the above facts have their share in the increased emissions from traffic – particularly of total suspended particles, nitrogen oxides, carbon moNOxide and volatile organic compounds. All the above pollutants mostly come from traffic in the territory of the Brno agglomeration, and they significantly contribute to the increased air pollution loads affecting the health of population. It is no accident that the limit values are exceeded by pollutants whose predominant source is traffic, and the highest concentrations are measured at localities with heavy traffic loads.
Since 1/1/2014 an urban background station for the Brno agglomeration, situated on the premises of a child hospital, has been operated in line with legislative requirements. Suspended PM10 particles, nitrogen oxides, ground-level ozone and benzene were measured at this locality in 2014.
V.2.1 Ambient air quality in the agglomeration of Brno
Suspended particles PM10 and PM2.5
In 2014 the limit value for the average annual PM10 concentration was not exceeded at any locality in the territory of the Brno agglomeration. The highest concentrations were, as usual, measured at localities with the highest traffic loads, namely Brno-Svatoplukova, Brno-Zvonařka and also the locality Brno-Lány, which is influenced by the D1 motorway. In previous years the limit value was exceeded several times (Fig. V.2.1). In comparison with the year 2013, the average annual PM10 concentrations decreased at most localities. An increase in concentrations occurred at the localities Brno-Úvoz (hot spot), by less than 2 µg.m-3, and Brno-Líšeň, by more than 5 µg.m-3. At the same time, however, a decrease of the finer fraction PM2.5 occurred at Brno-Líšeň. The increase in concentrations of the coarser fraction PM10 therefore could have been caused by the nearby construction site of a large housing complex (Houbalova street) or by large-scale earth moving activities near the Líšeň gorge, where all hedges and trees were removed and the surface was levelled and turned into a grassland. This work, which lasted throughout the year, could have caused an increase of the coarser fraction PM10, be it directly or through wind erosion of the loose surface. The worst air pollution situation was confirmed at traffic stations where, on average for the years 2005–2014, the concentrations were by 6.4 µg.m-3 higher than at background localities (Fig. V.2.1). The situation at urban and suburban background stations is very similar to the situation at the regional rural background station Mikulov-Sedlec in years without long periods of unfavourable dispersion conditions (2007–2009, 2012). On the contrary, in years when there occurred, mainly in the winter, the long-lasting periods with an inversion character of the weather (January 2006, January 2010, February and November 2011), the effect of the large accumulation of sources (household heating, traffic, industry) and of stable atmosphere is apparent. It is manifested by higher concentrations at urban background stations compared to the regional background station. In the long term (2005–2014), the concentrations in urban and suburban background localities are higher by approximately 4.4 µg.m-3 than at the regional background locality Mikulov-Sedlec.
In addition to dispersion conditions and the heating season, wind erosion is another important factor because of the agricultural character of the whole South-Moravian landscape. In this region, wind erosion is a potential threat to over 50 % of agricultural land, while 13 % of this area belongs to the category with the most endangered soils. The worst situation is in the districts of Břeclav, Hodonín and Znojmo, but soils in the surroundings of Brno are also heavily endangered by wind erosion. Wind erosion occurs mainly in periods before and after the soil is covered by vegetation (April, May and September, October). The erodibility is is strengthened by longer episodes without precipitation and by wind velocity sufficient for transporting soil particles. The influence of wind erosion is most apparent at the rural locality Kuchařovice where, in the long term, measured PM10 concentrations in April were almost the same as those measured in March (still within the heating season); in October these concentrations were higher than in November and December; April concentrations at the locality approached the long-term monthly average in Brno-Tuřany. Also when compared with other background localities (Mikulov–Sedlec and Brno–Soběšice), it is obvious that from March till October, concentrations are higher in Kuchařovice and that, conversely, from November till February, higher concentrations are reached at the other localities (Skeřil et al. 2013; Fig. V.2.2). Long-term data from the background suburban station Brno-Tuřany show that during the periods without precipitation (at least 5 days without precipitation) the average concentrations of PM10 are by 6.1 µg.m-3 higher than the long-term average for this period (Knozová, Skeřil 2011). As concerns PM2.5 particles measured in the agglomeration of Brno territory, the limit value is exceeded in the long term only at localities with traffic loads (Fig. V.2.3); in background localities, the limit value is exceeded or the levels are close to the limit value only in years with longer episodes of unfavourable dispersion conditions (2006, 2010). In 2014 average annual concentrations of PM2.5 decreased compared to the year 2013 at all localities that amassed a sufficient amount of data for calculating the average annual concentration for the given years.
In 2014 the limit value for 24-hour PM10 concentration was exceeded only at traffic localities, but not at all of them. Only the localities Brno-Svatoplukova, Brno-Zvonařka and Brno-Lány exceeded the limit value. Although this is classified as a background locality, the degree to which it is affected by the D1 motorway is noticeable. The background locality Brno-Tuřany did not exceed the limit value in years without longer episodes of unfavourable dispersion conditions (2007–2009, 2012–2014). As far as the number of days with concentrations higher than 50 µg.m-3 is concerned, this number compared to the year 2013 decreased at six stations, increased at two stations, and remained the same at the locality Brno-Soběšice. This increase concerned the localities Brno-Výstaviště (from 26 to 34 days) and Brno-Lány (from 41 to 51 days). Conversely, the number of days with concentrations of PM10 > 50 µg.m-3 decreased at two other traffic-burdened localities: Brno-Svatoplukova (from 72 to 62 days) and Brno-Zvonařka (from 69 to 54 days), although the limit value was still being exceeded. Moreover, a slight decrease occurred at the localities Brno-Tuřany, Brno-Kroftova, Brno-Úvoz (hot spot) and Brno-Arboretum.
Generally, however, the concentration levels are highly dependent on meteorological/dispersion conditions during the winter season. The negative influence of unfavourable dispersion conditions in the winter period together with the heating season (residential heating) is reflected also in the distribution of days with PM10 concentrations higher than 50 µg.m-3; such days occur mainly in the cold part of the year. In this regard, in 2014 the month of January was absolutely dominant. Also outstanding was the month of March, especially at traffic-influenced stations in Brno (Brno-Svatoplukova and Brno-Lány). In July and August, (27. 6 – 25. 8., source: Brněnské komunikace), road repairs were carried out in the immediate vicinity of the Brno-Úvoz station (hot spot), which was manifested especially in July by a large number of exceedances, with the highest daily concentration reaching a value of 109 µg.m-3, which is highly unusual for July. The average monthly concentration in July value (46.2 µg.m-3) was also unusually high. If we compare average monthly concentrations of PM10 at the locality Brno-Úvoz (hot spot) for the year 2014 with the average over all previous years in which measurements were made (2008–2013) we can see that values of concentrations stayed below the long-term average throughout the period, but that in July (during grinding works), these concentrations very strongly exceeded the long-term average (225 %, Fig. V.2.6). The station in Brno-Soběšice counted the smallest number of days with concentrations of PM10 > 50 µg.m-3 in the Brno agglomeration, thus reaching the same number of exceedances as the regional background locality Mikulov-Sedlec. By contrast, the highest number of days on which the PM10 concentration of 50 µg.m-3 was exceeded in the Brno agglomeration was recorded by the station Brno-Svatoplukova (Fig. V.2.5), as in the year 2013.
The development of concentrations since 1996 shows that there is almost no difference between the agglomeration of Brno and the agglomeration of Prague or the North-western zone. As concerns average annual concentrations, the trends have almost identical course and very similar concentration levels, which is signified by supra-regional influence of meteorological conditions as well as a similar degree of influence. The Moravia-Silesia region is the only exception due to a different type of load. The trend of the 36th highest 24-hour PM10 concentration and the trend of the average annual PM2.5 concentration have similar courses. In both cases, concentrations in the agglomeration of Brno are higher than in the agglomeration of Prague, which can be caused firstly by generally higher background of concentrations of suspended particles in Moravia and also by a higher share of traffic stations in Brno.
Nitrogen dioxide (NO2)
In the territory of the Brno agglomeration, the limit value for the average annual NO2 concentration is being exceeded only at localities with the heaviest traffic loads. On the contrary, the limit value for 1-hour concentration of NO2 is not being exceeded. In 2014 the limit value was exceeded in the localities Brno-Úvoz (hot spot) and Brno-Svatoplukova similarly as in the previous year. However, whereas the locality Brno-Svatoplukova recorded a decrease compared to the year 2013 (from 44.5 to 40.8 µg.m-3), at the locality Brno-Úvoz (hot spot) concentrations increased from 44.9 to 48.2 µg.m-3 , which approaches values measured in the Legerova street in Prague. Part of this increase was due to roadworks in Úvoz street (27. 6 – 25. 8., source: Brněnské komunikace), which is already mentioned in connection with suspended particles – the highest average monthly concentrations were measured in August (60.2 µg.m-3) and July (56.8 µg.m-3), whereas at the station Praha 2-Legerova these were the months with the lowest concentrations. If we compare average monthly concentrations of NO2 at the locality Brno-Úvoz (hot spot) for the year 2014 with the average for all previous years (2008–2013), we find that actual concentrations varied below the long-term average throughout the period, but that from June till August (during the works), concentrations were markedly above the long-term average (up to 147 % of the long-term average in July, Fig. V.2.6). All the remaining localities recorded decreased concentrations in comparison with the year 2013. In 2014 the new urban background locality Brno-Dětská nemocnice reached an average of 26.6 µg.m-3; during the whole time, however, the nearby Milada Horáková street was closed and undergoing road works. It will therefore be interesting to see whether concentrations will changed after this street is open, and if so, in what direction.
The long-term background concentrations measured in the locality Brno-Tuřany reach the levels around 20 µg.m-3, and in recent years a downward trend has been recorded; the average annual concentration in 2014 amounted to 17.2 µg.m-3 (Fig. V.2.7).
The trend of NO2 concentrations in the monitored period is
relatively stable at all stations (except the already mentioned
hot spot locality Brno-Úvoz in the last year). Unlike in the
case of suspended particles, the measured values are not so much
influenced by meteorological conditions; only the intensity of
traffic is significant. In this respect, however, nitrogen oxide
(NO) is much more significant; nevertheless, no limit value has
been set for this pollutant.
Although at selected localities in the agglomeration of Brno the
limit value for the average annual NO2 concentration is exceeded,
the overall results for the agglomeration are very good; the
average values are approximately the same as the average for the
whole Czech Republic. The agglomeration of Brno has the best
results in the long term in comparison with the remaining
agglomerations. As concerns 1-hour concentrations, a significant
increase was recorded in certain years (2006, 2010). These are
the years with the marked deterioration of ambient air quality
in the cold part of the year due to unfavourable dispersion
conditions (2006) or due to the very long heating season (2010).
Still, the concentrations measured in the agglomeration of Brno
are again the lowest ones in the long term.
Benzo[a]pyrene
Polycyclic aromatic hydrocarbons (PAH) are represented in legislation by benzo[a]pyrene, a carcinogenic substance formed during the combustion of solid and liquid fuels. In the territory of the Brno agglomeration, PAH are measured at two localities – in the city centre with traffic loads (Brno-Masná) and in a background residential area (Brno-Líšeň). While the traffic locality Brno-Masná exceeded the limit value every year in the period 2008–2012, concentrations of PAH at the locality Brno-Líšeň so far have not been exceeded. In 2013 and 2014 the concentration in the locality Brno-Masná dramatically decreased to the level representing 50 % of the concentration measured in the year 2012. The concentrations are lower than at the background locality Brno-Líšeň or at the rural background locality Kuchařovice. With regard to significant impacts of traffic in the centre of Brno and the concentration levels measured in previous years, the 2013 concentration is suspicious and cannot be regarded as reliable (Fig. V.2.8). With regard to average monthly concentrations, winter months are again very important – while in summer the concentrations reach practically zero values, in wither they can reach values of around 5 ng.m-3. This is caused by meteorological conditions and also by higher levels of the regional background. Residential heating is in operation practically only during the heating season and, at the same time, within the South Moravia region it is, after traffic, the second most important source of particles to which PAH are bound. The sector of residential heating increases spatial background concentrations in the whole region during the cold part of the year. At traffic localities, even higher concentrations are measured, which is caused by traffic emissions.
The long-term development of concentrations in the agglomeration of Brno, similarly as in the agglomeration of Prague or in the North-western zone, shows levels close to the limit value. Generally, with regard to the long-term development in Brno, background localities record levels below the limit value; in the city centre, which is influenced by traffic, levels slightly exceeding the limit value are recorded.
Ground-level ozone
In 2014 the monitoring of ground-level ozone (O3) was carried out at four localities in the agglomeration of Brno. Background concentrations are measured at the station Brno-Tuřany and Brno-Lány whereas urban background concentrations are measured at the new locality Brno–Dětská nemocnice. O3 is also measured in the traffic-burdened city centre at the Brno-Zvonařka station. Ozone is a highly reactive molecule which readily reacts with most substances in the air. The highest concentrations of ground-level ozone are therefore measured in clean places with low concentrations of other pollutants. On the contrary, the most loaded (traffic) localities measure the lowest concentrations of ground-level ozone. Ozone reactivity is demonstrated also in concentrations measured in the territory of the Brno agglomeration. In the year 2014 the level of 120 µg.m-3 was not exceeded at any station. The highest concentrations were measured at the background localities Brno–Tuřany (26th highest 8h rolling average 112.2 µg.m-3), and the lowest concentrations were measured at the locality Brno–Dětská nemocnice (26th highest 8h rolling average 75.5 µg.m-3), where concentrations could have been affected by building activity in the Milada Horáková street. Compared to the year 2013, concentrations of ground-level ozone decreased at all localities where this pollutant was monitored in both years.
The long-term development of ground-level ozone concentrations is dependent on meteorological conditions, particularly in summer periods when maximum concentrations are reached, and the agglomeration of Brno is no exception. Urban localities reach lower concentrations than rural localities, which is evident also at the localities discussed above. In spite of the fact that Brno-Tuřany is not a rural locality, the concentrations measured there are higher than in the city centre.
V.2.2 Emissions in the agglomeration of Brno
At present, approximately 600 individually registered plants – sources of ambient air pollution, included in the REZZO 1 and REZZO 2 database, exist in the territory of the Brno agglomeration. Only several dozen, however, contribute significantly to total emissions. These are primarily thermal energy sources (Teplárny Brno a. s.), the municipal waste incineration plant (SAKO Brno, a.s.) and a small number of plants of the formerly highly developed engineering sector (mainly foundries). According to the general census of 2011, central sources of heat energy prevail in the heating of households (about 54 % of flats), followed by and gas boiler stations and local gas boilers (altogether about 37 % of flats). Only in a small part of the housing stock, primarily in the city outskirts, coal, wood and coke are used for heating. Similarly, the majority of public sector buildings are connected to central sources of heat or have their own gas boiler rooms.
In the period from 2002 to 2013, the above-mentioned significant sources reduced all monitored emissions. As concerns TSP emissions, this decrease is connected with modernization and with the closure of some technological branches of production, primarily foundries (e.g. Slévárna Zetor or Šmeral, a. s.). According to the current data of the summary operational records, there is only one significant source of TSP emissions: Eligo, a. s., specialized in the production of dried milk products, followed by foundries (primarily the Královopolská foundry), where, in addition to the reported TSP emissions, we can expect also a certain share of hard to determine fugitive emissions.
As for SO2 emissions, the most significant share is contributed by the municipal waste incineration plant SAKO Brno, a. s. The marked decrease of emissions from heat supply sources results from the reduced combustion of high-sulphur fuel oils and the subsequent transition to burning natural gas as the only type of fuel.
The decrease of NOx emissions was reached, besides the gradual modernization of heat supply sources, also by the shutdown of the TEDOM unit in the company ERDING, a. s. Brno, which produced more than 200 t.year-1 of NOx until the year 2002.
V.2.3 Conclusion
As concerns ambient air quality, the agglomeration of Brno has a crucial problem with traffic and especially the air pollution for which traffic is predominantly responsible. With regard to the location of Brno as a motorway intersection where even transit traffic passes through the city centre, this problem will probably not be solved in the near future. Similarly as in Prague, it will first be necessary to invest in the construction of bypasses (displacement of emissions out of the city centre and their marked reduction as a result of smoother traffic flow). Further traffic and organizational measures will have to be taken until the situation improves. The situation outside the city centre is a little better. Limit values at background localities such as Brno-Líšeň, Brno-Soběšice or Brno-Tuřany are exceeded only in years with longer periods of unfavourable dispersion conditions.
The agglomeration of Brno does not meet the limit values set for suspended particles (both PM10 and PM2.5), NO2 and benzo[a]pyrene. All these pollutants are closely connected with traffic in this agglomeration.
Other pollutants listed in the legislation comply with their limit values. In the cases of sulphur dioxide (both daily and hourly limit values), carbon moNOxide, lead, arsenic, cadmium and nickel, the concentrations in the long term even remain below the lower assessment threshold. Benzene concentrations fluctuate close to the lower assessment threshold.
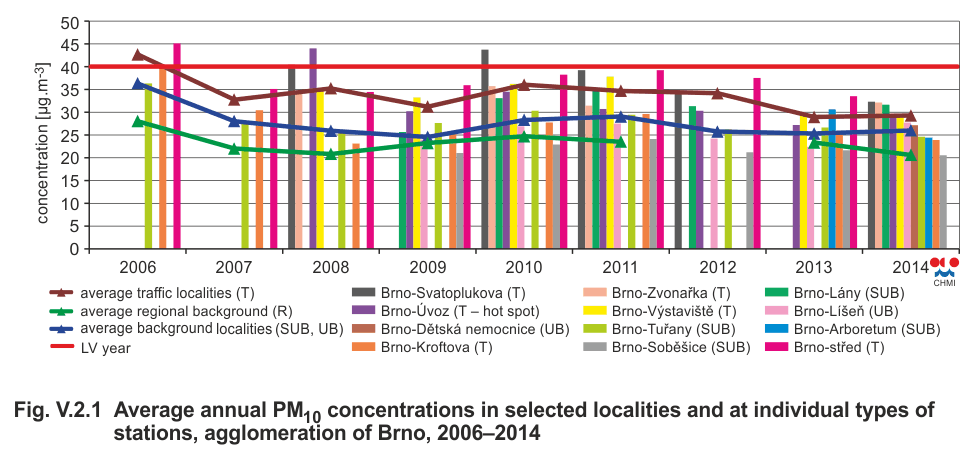
Fig. V.2.1 Average annual PM10 concentrations in selected
localities and at individual types of stations, agglomeration of
Brno, 2006–2014
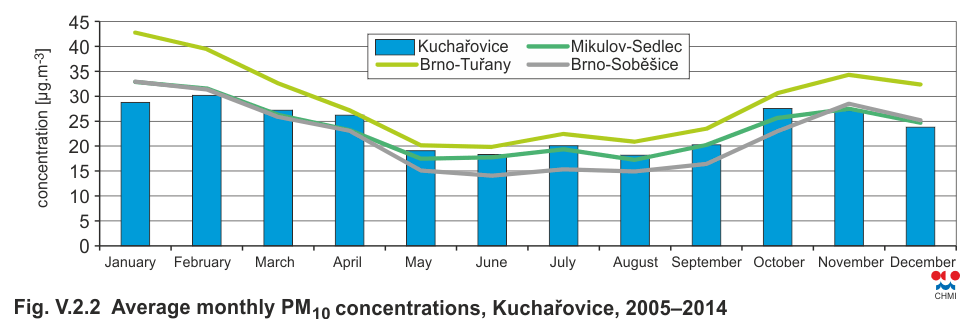
Fig. V.2.2 Average monthly PM10 concentrations, Kuchařovice,
2005–2014
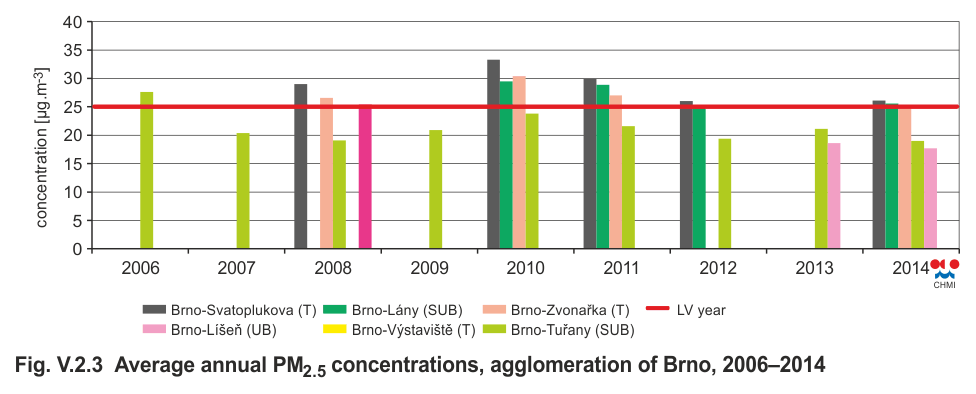
Fig. V.2.3 Average annual PM2.5 concentrations, agglomeration of
Brno, 2006–2014
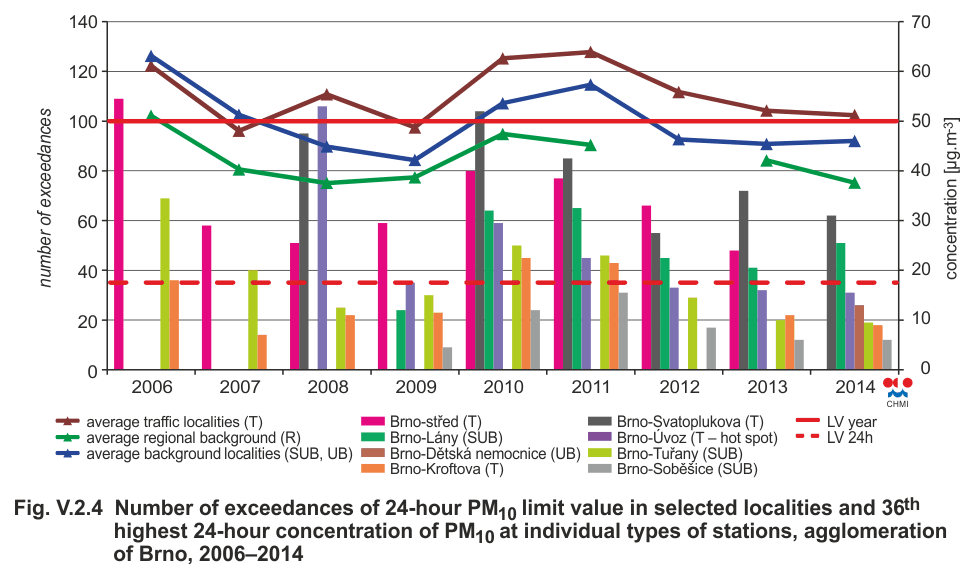
Fig. V.2.4 Number of exceedances of 24-hour PM10 limit value in
selected localities and 36th highest 24-hour concentration of
PM10 at individual types of stations, agglomeration of Brno,
2006–2014
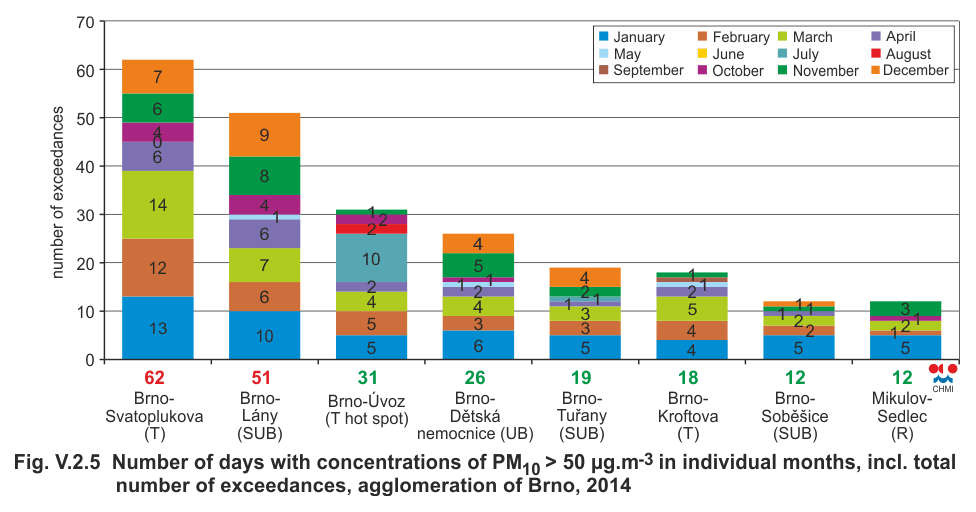
Fig. V.2.5 Number of days with concentrations of PM10 > 50
µg.m-3 in individual months, incl. total number of exceedances,
agglomeration of Brno, 2014
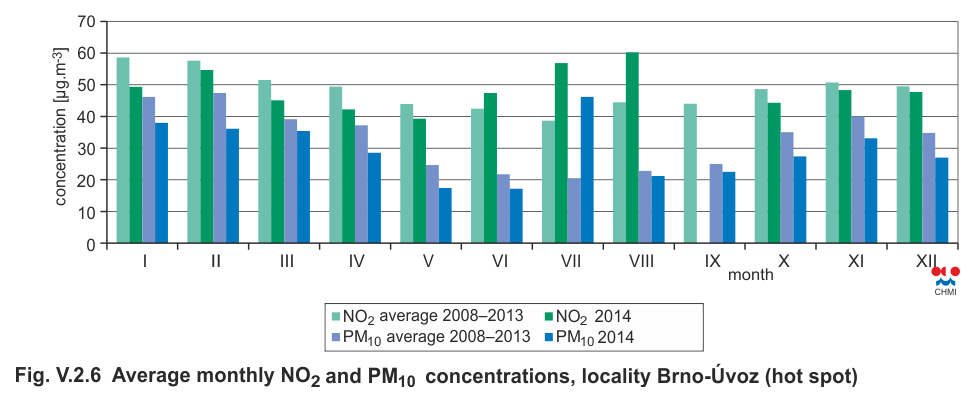
Fig. V.2.6 Average monthly NO2 and PM10 concentrations, locality
Brno-Úvoz (hot spot)
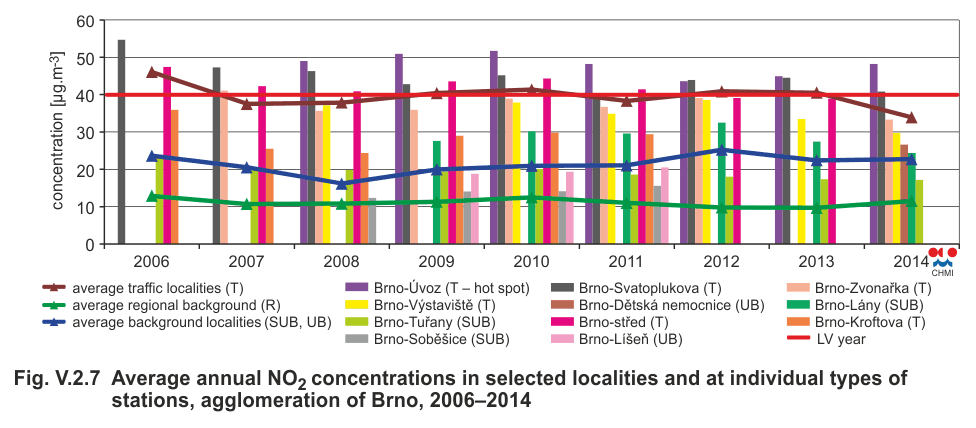
Fig. V.2.7 Average annual NO2 concentrations in selected
localities and at individual types of stations, agglomeration of
Brno, 2006–2014
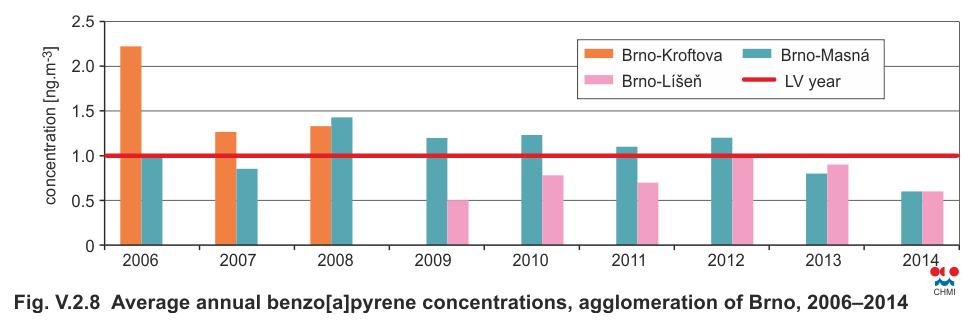
Fig. V.2.8 Average annual benzo[a]pyrene concentrations,
agglomeration of Brno, 2006–2014
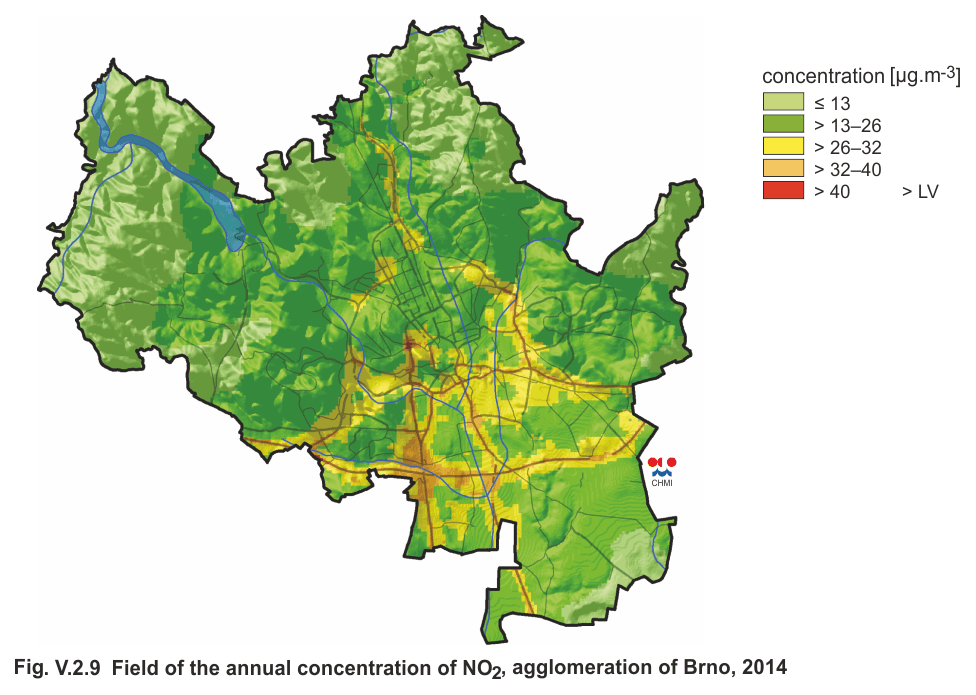
Fig. V.2.9 Field of the annual concentration of NO2,
agglomeration of Brno, 2014
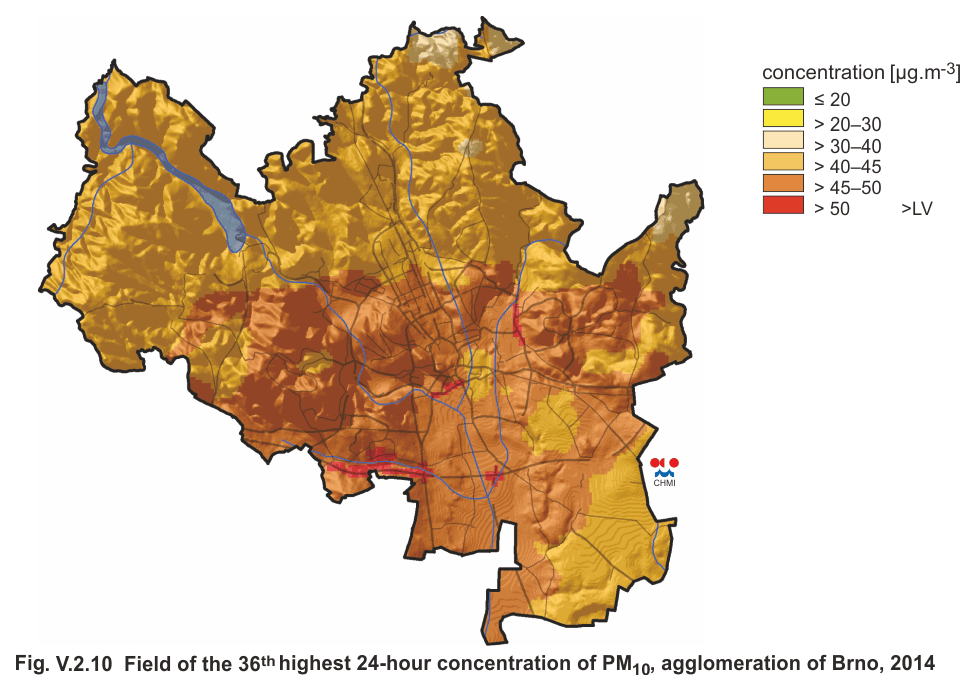
Fig. V.2.10 Field of the 36th highest 24-hour concentration of
PM10, agglomeration of Brno, 2014