|
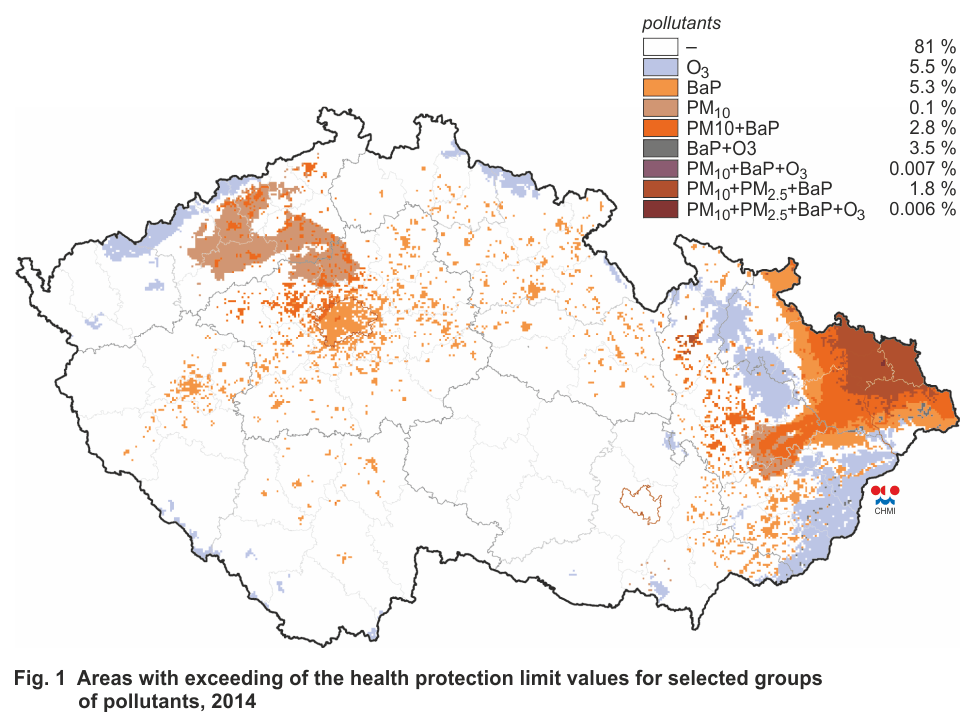
Fig. 1 |
Areas with exceeding of the health protection limit
values for selected groups of pollutants, 2014 |
|
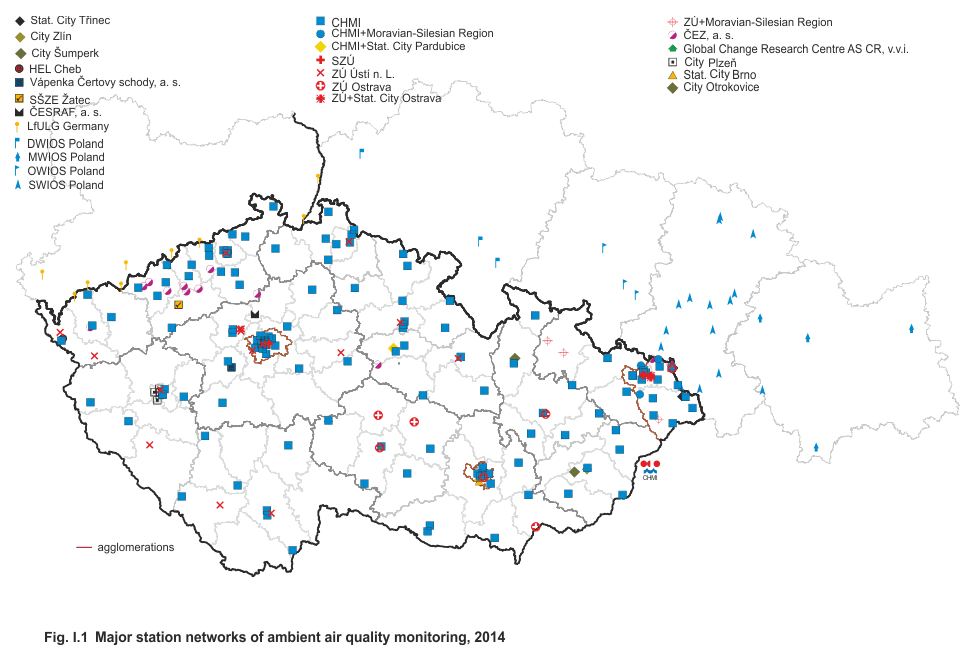
Fig. I.1 |
Major station networks of ambient air quality
monitoring, 2014 |
|
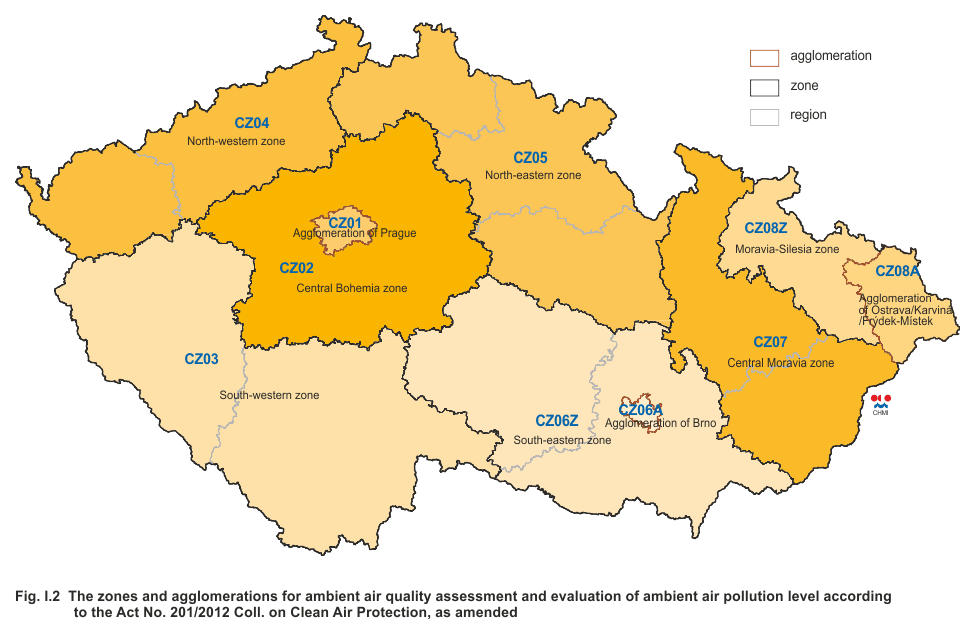
Fig. I.2 |
The zones and agglomerations for ambient air quality
assessment and evaluation of ambient air pollution level
according to the Act No. 201/2012 Coll. On Clear Air
Protection, as amended |
|
Fig. II.1 |
The development of total emissions, 1990–2001 |
|
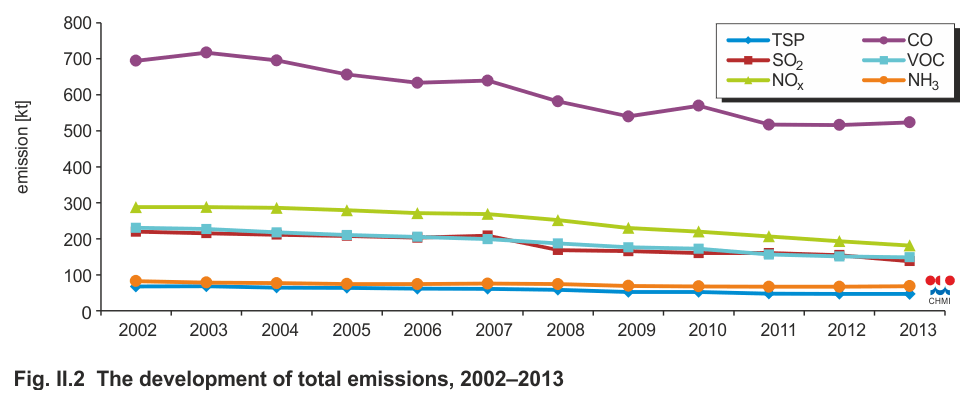
Fig. II.2 |
The development of total emissions, 2002–2013 |
|
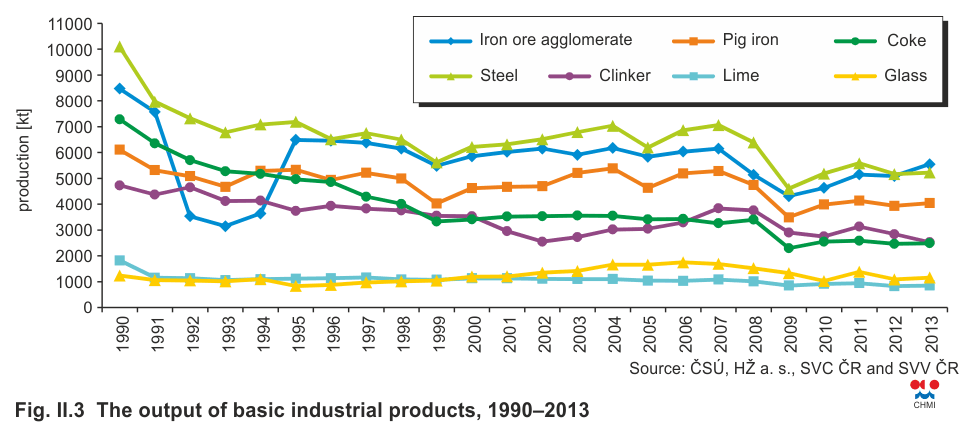
Fig. II.3 |
The output of basic industrial products, 1990–2013
|
|
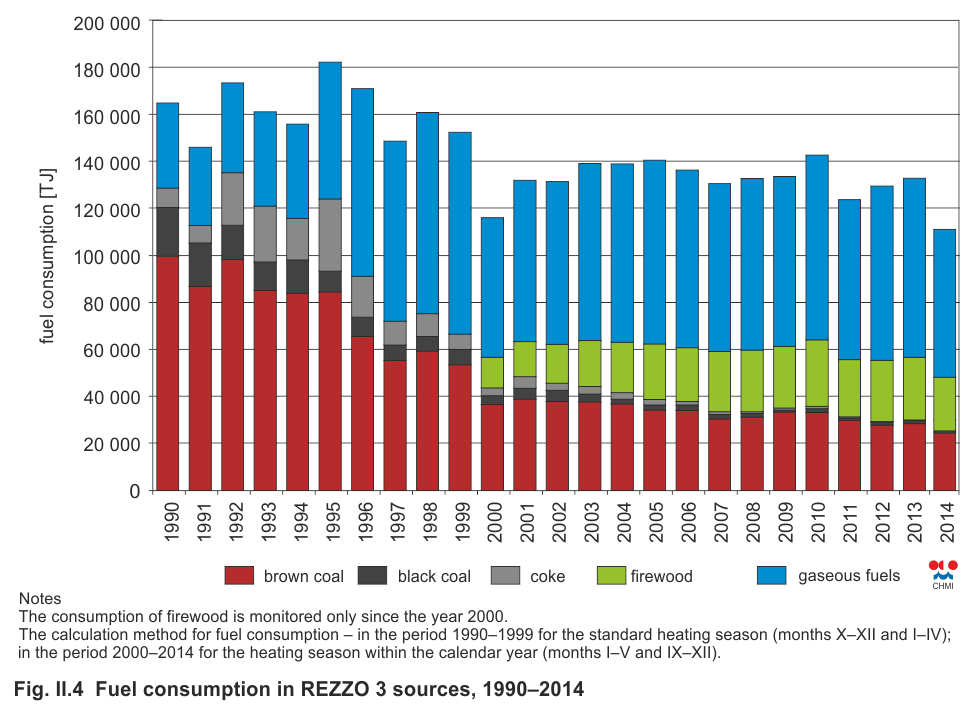
Fig. II.4 |
Fuel consumption in REZZO 3 sources, 1990–2014 |
|
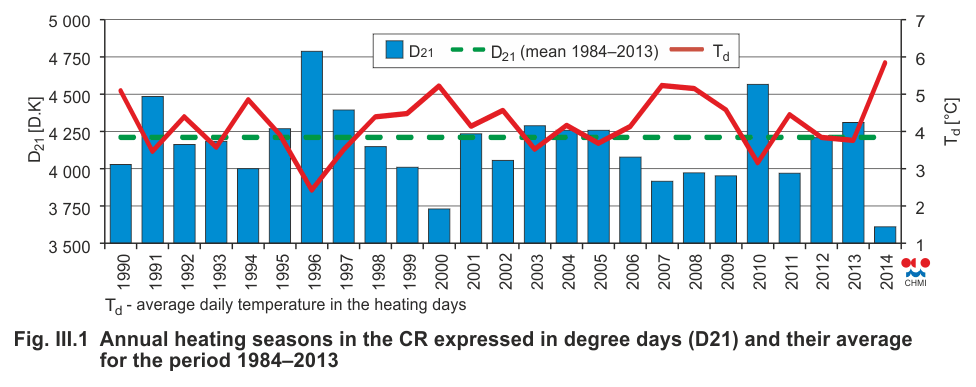
Fig. III.1 |
Annual heating seasons in the CR expressed in degree
days (D21) and their average for the period 1984–2013 |
|
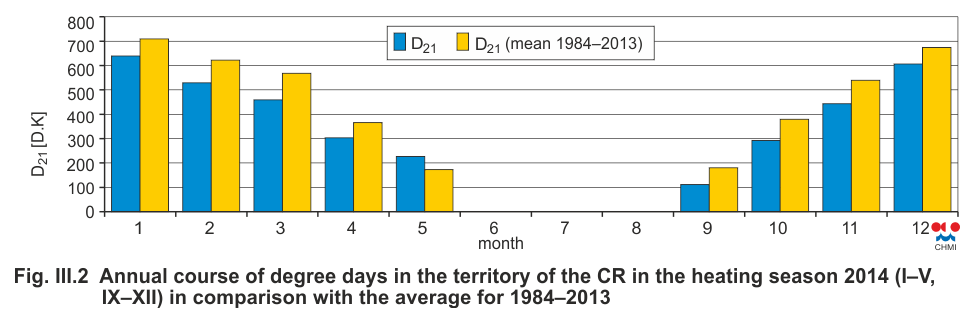
Fig. III.2 |
Annual course of degree days in the territory of the
CR in the heating season 2014 (I–V, IX–XII) in
comparison with the average for 1984–2013 |
|
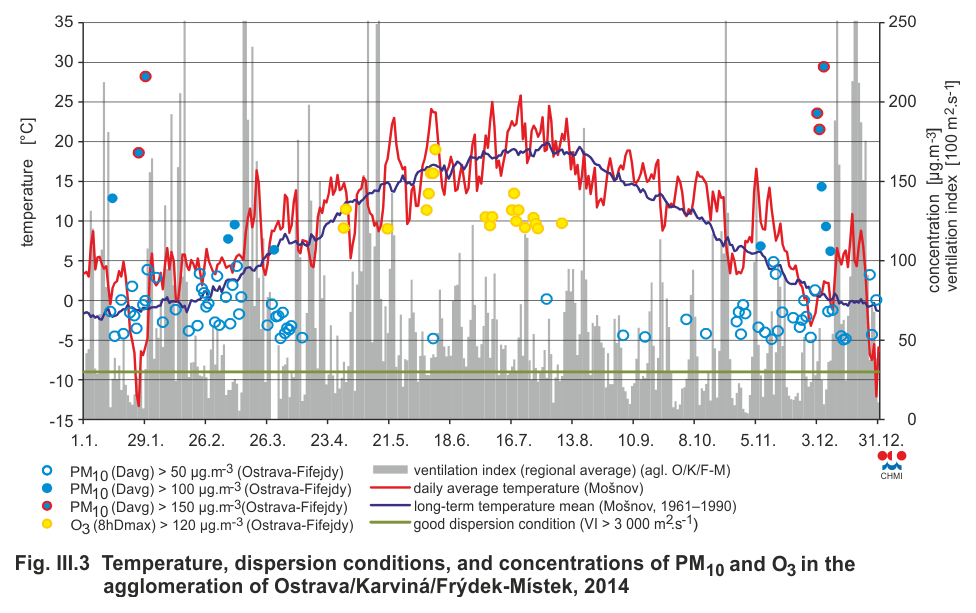
Fig. III.3 |
Temperature, dispersion conditions, and
concentrations of PM10 and O3 in the agglomeration of
Ostrava/Karviná/Frýdek-Místek, 2014 |
|
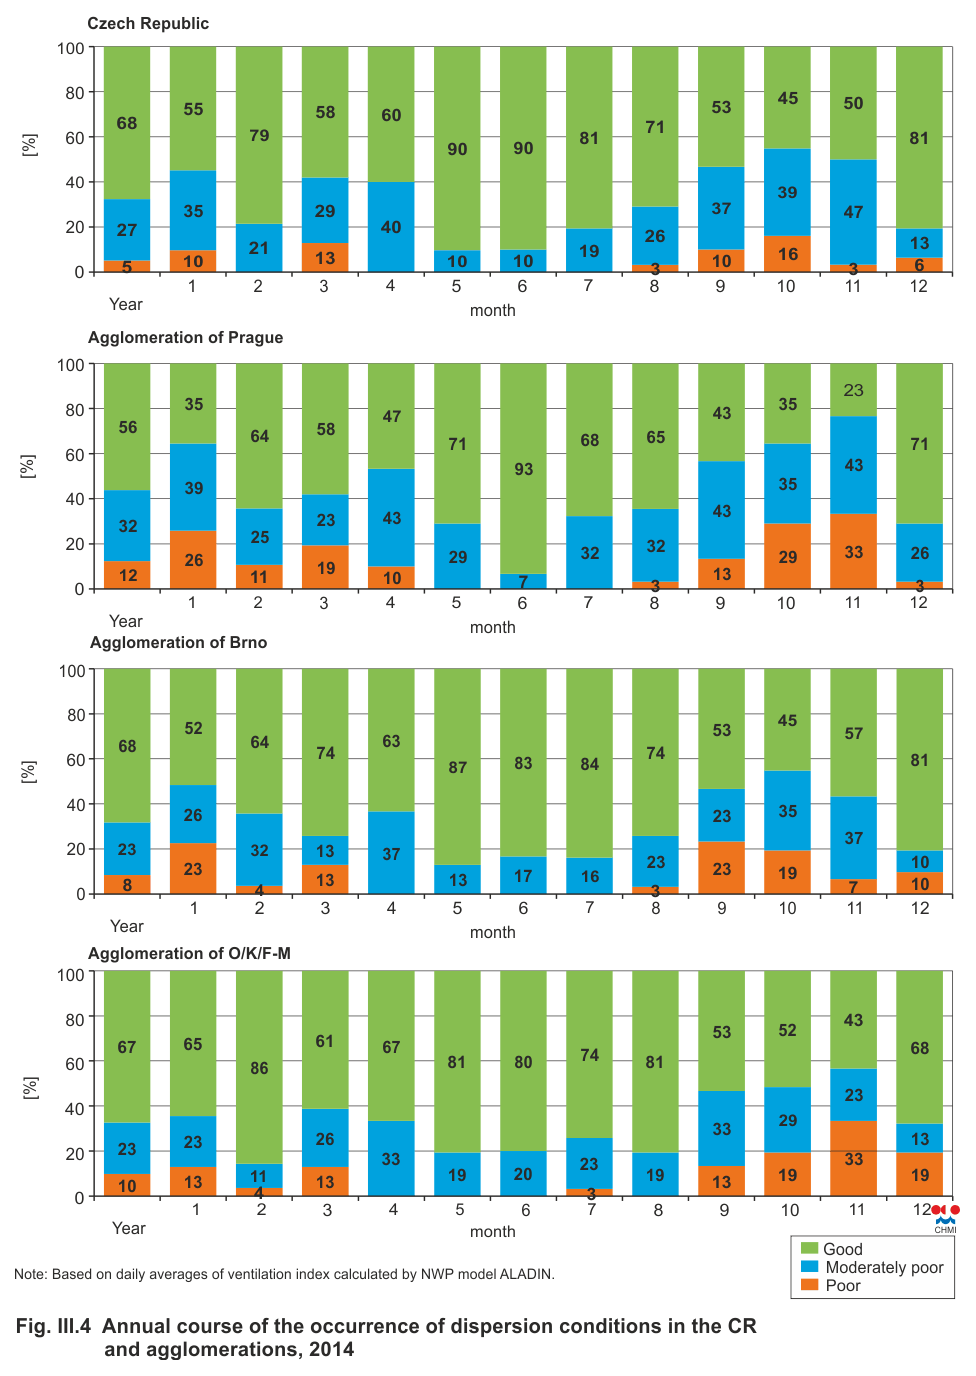
Fig. III.4 |
Annual course of the occurrence of dispersion
conditions in the CR and agglomerations, 2014 |
|
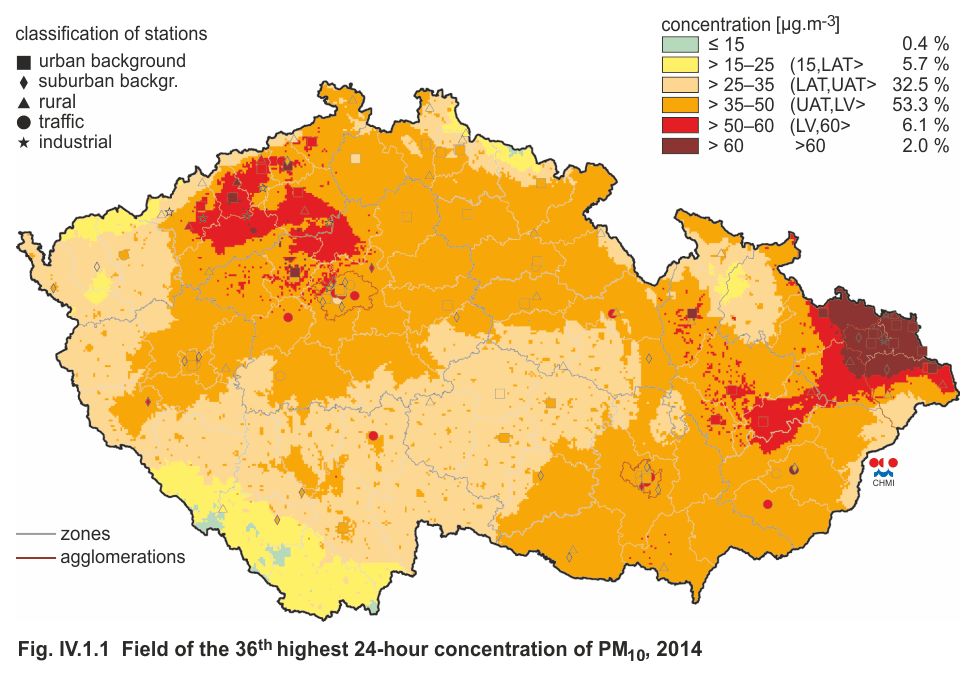
Fig. IV.1.1 |
Field of the 36th highest 24-hour concentration of
PM10, 2014 |
|
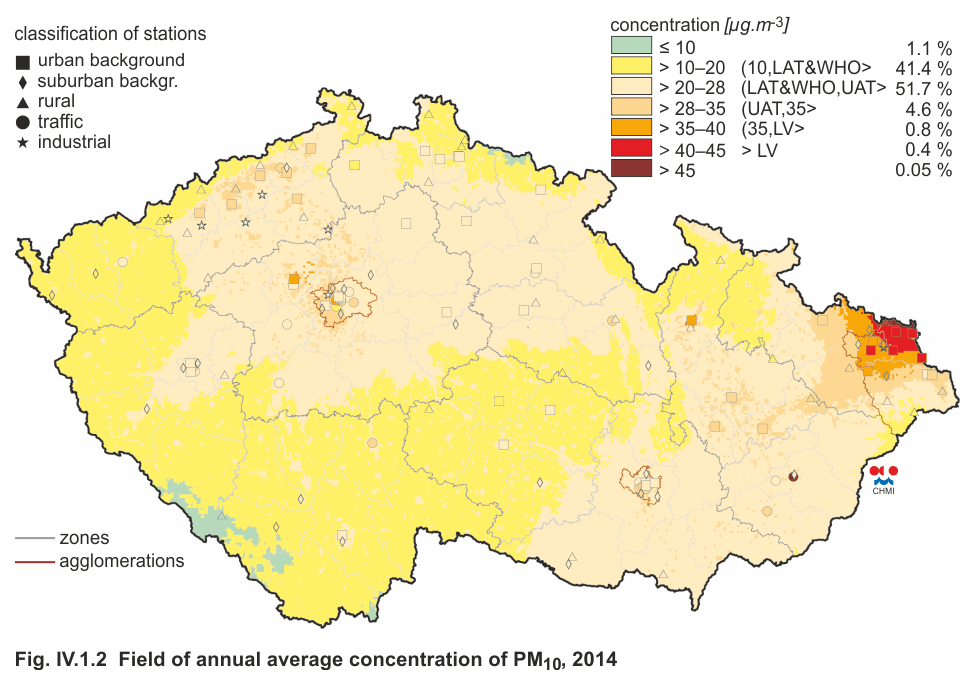
Fig. IV.1.2 |
Field of annual average concentration of PM10, 2014 |
|
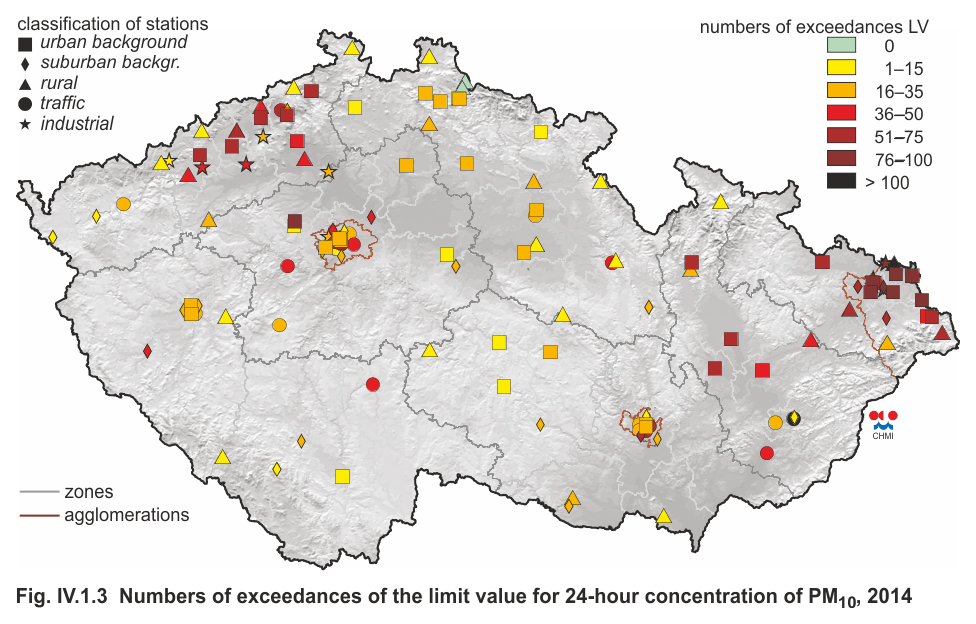
Fig. IV.1.3 |
Numbers of exceedances of the limit value for 24-hour
concentration of PM10, 2014 |
|
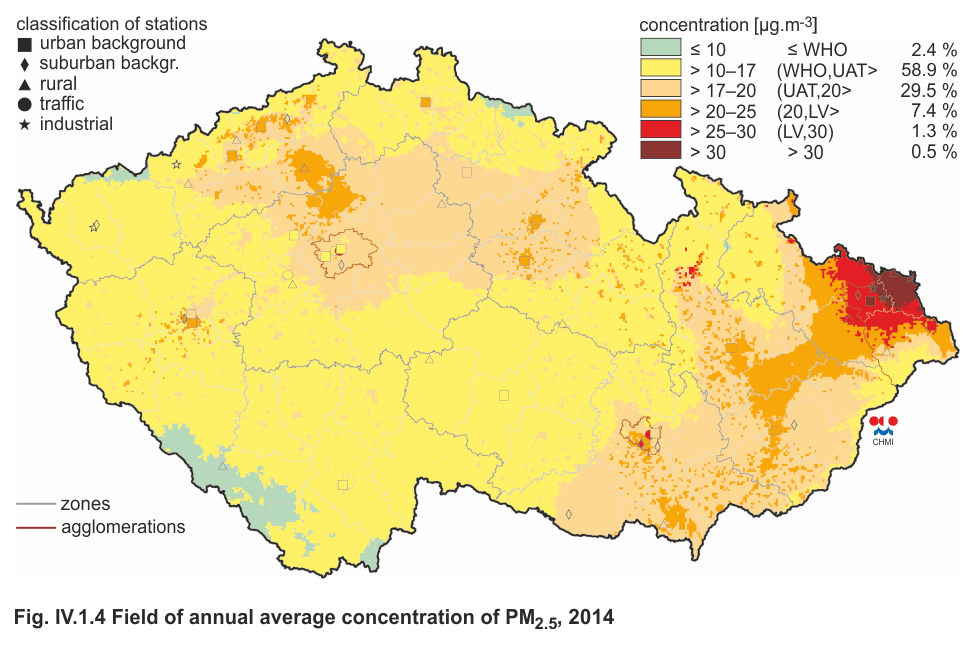
Fig. IV.1.4 |
Field of annual average concentration of PM2.5, 2014 |
|
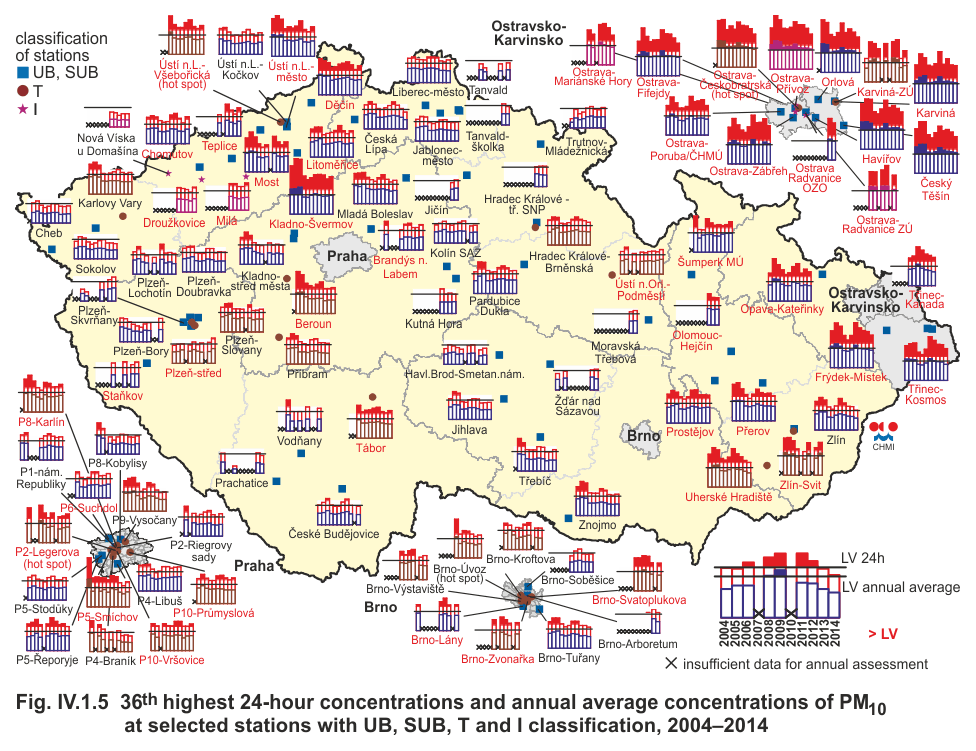
Fig. IV.1.5 |
36th highest 24-hour concentrations and annual
average concentrations of PM10 at selected stations with
UB, SUB, T and I classification, 2004–2014 |
|
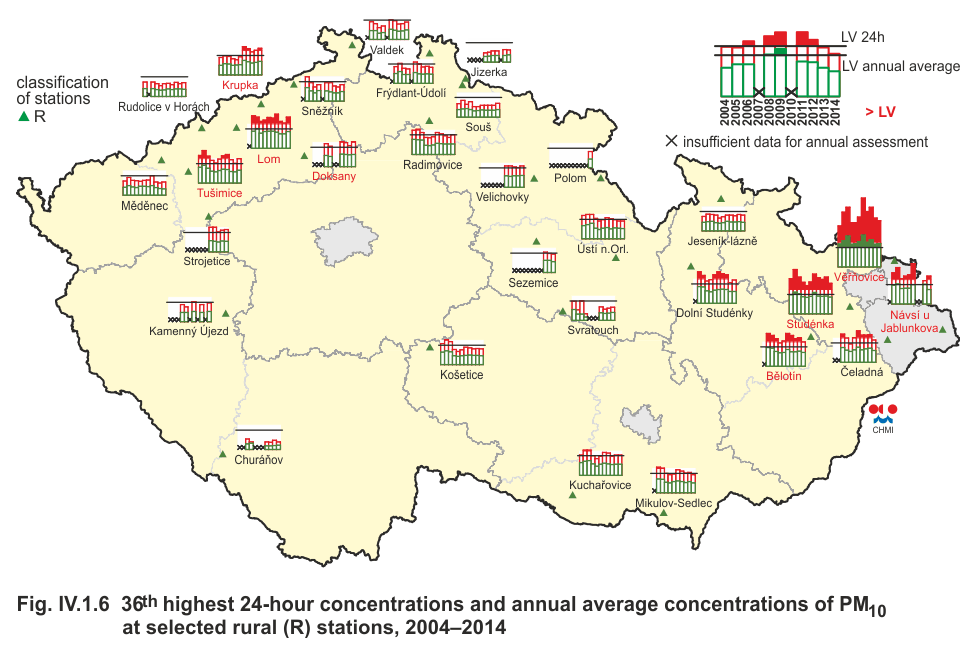
Fig. IV.1.6 |
36th highest 24-hour concentrations and annual
average concentrations of PM10 at selected rural (R)
stations, 2004–2014 |
|
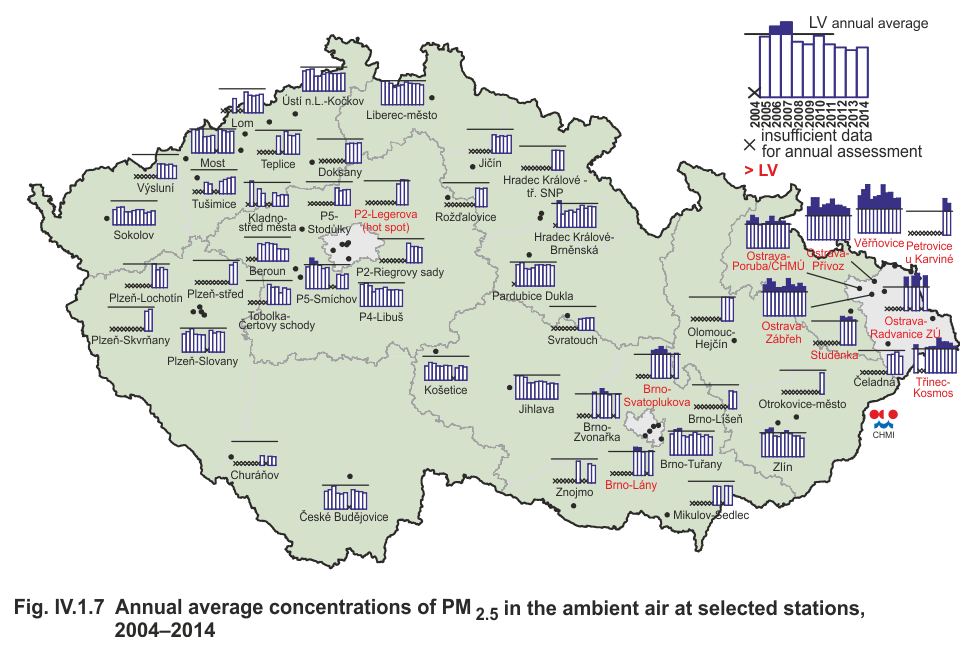
Fig. IV.1.7 |
Annual average concentrations of PM2.5 in the
ambient air at selected stations, 2004–2014 |
|
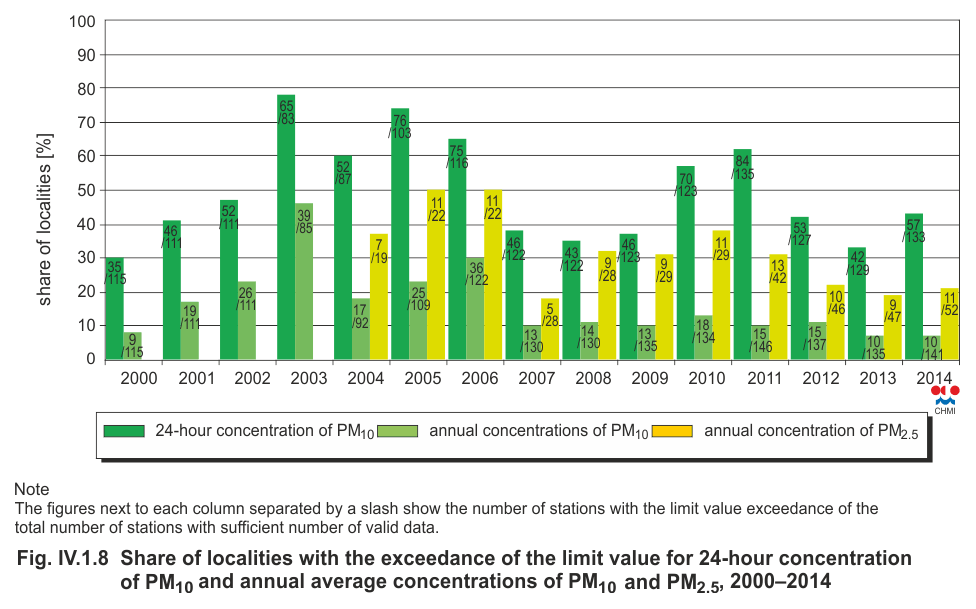
Fig. IV.1.8 |
Share of localities with the exceedance of the limit
value for 24-hour concentration of PM10 and annual
average concentrations of PM10 and PM2.5, 2000–2014 |
|
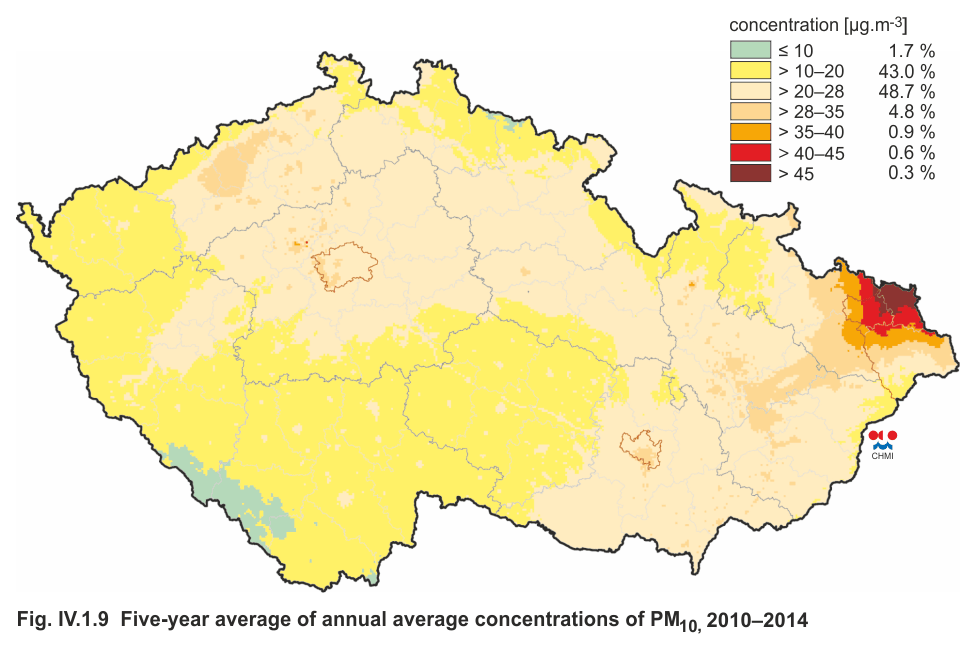
Fig. IV.1.9 |
Five-year average of annual average concentrations
of PM10, 2010–2014 |
|
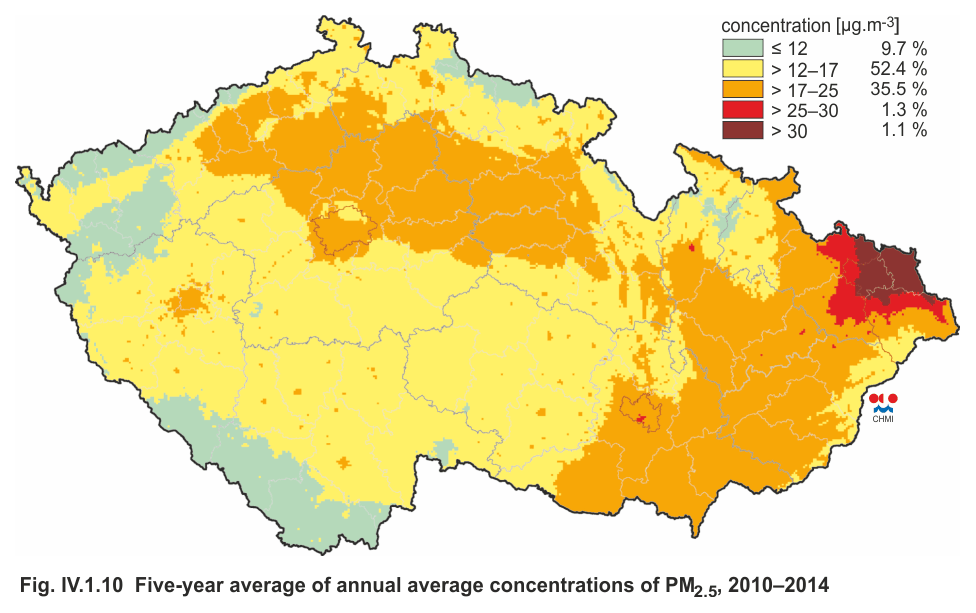
Fig. IV.1.10 |
Five-year average of annual average concentrations
of PM2.5, 2010–2014 |
|
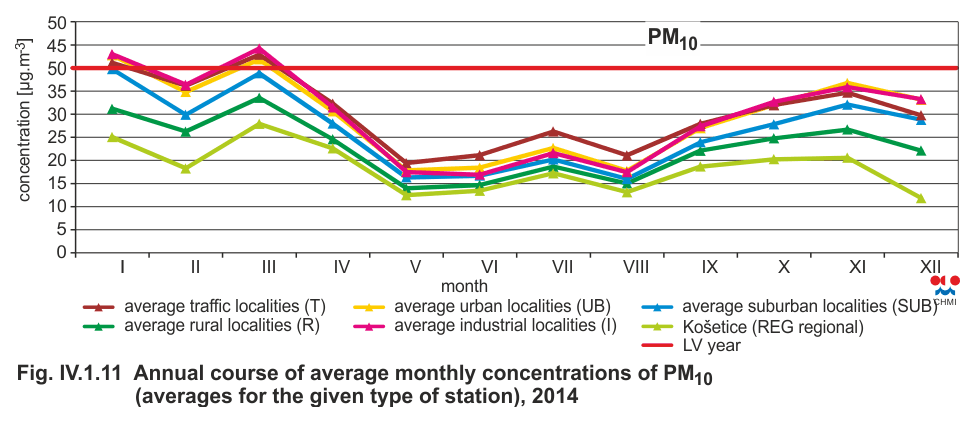
Fig. IV.1.11 |
Annual course of average monthly concentrations of
PM10 (averages for the given type of station), 2014 |
|
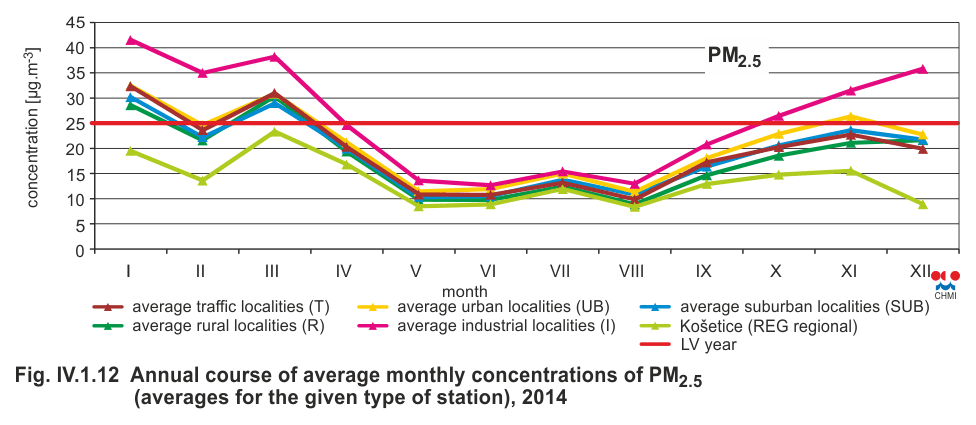
Fig. IV.1.12 |
Annual course of average monthly concentrations of
PM2.5 (averages for the given type of station), 2014 |
|
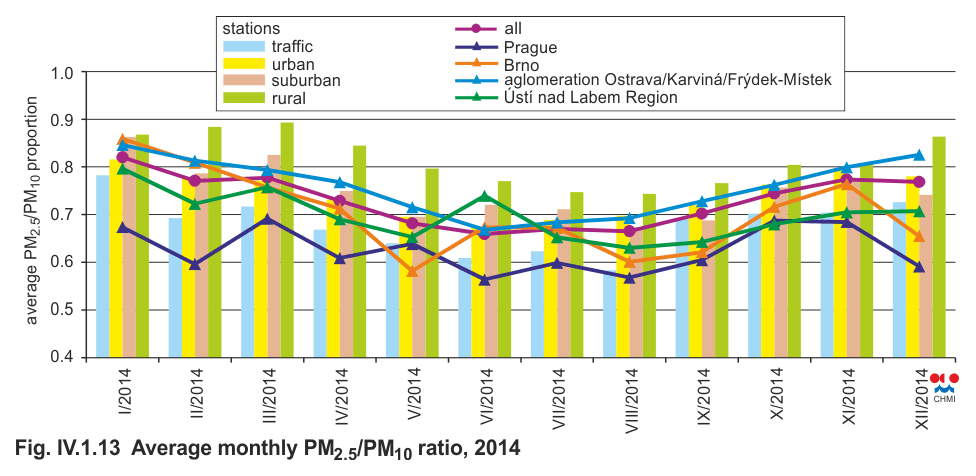
Fig. IV.1.13 |
Average monthly PM2.5/PM10 ratio, 2014 |
|
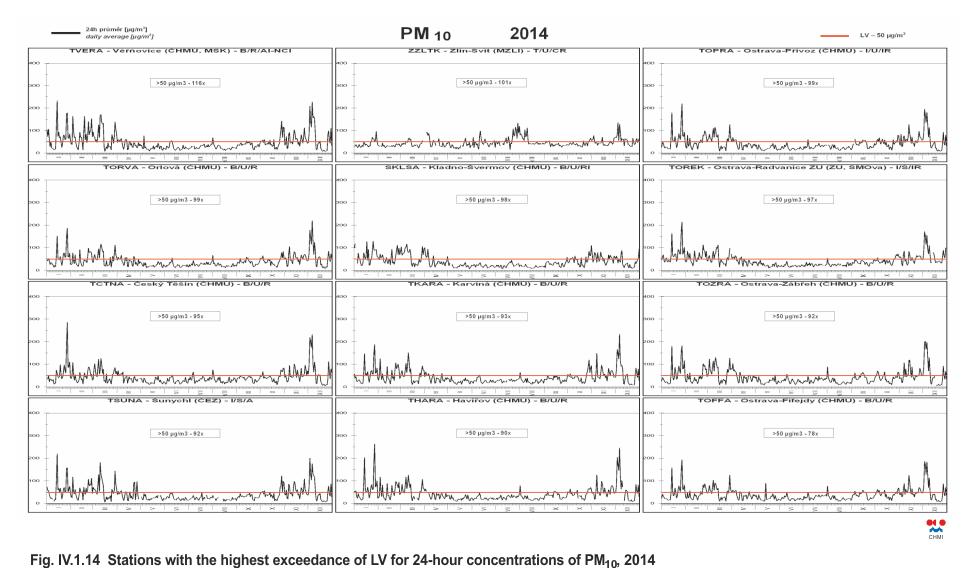
Fig. IV.1.14 |
Stations with the highest exceedance of LV for 24-hour
concentrations of PM10, 2014 |
|
Fig. IV.1.15 |
Trends of PM10 annual characteristics in the Czech
Republic, 2000–2014 |
|
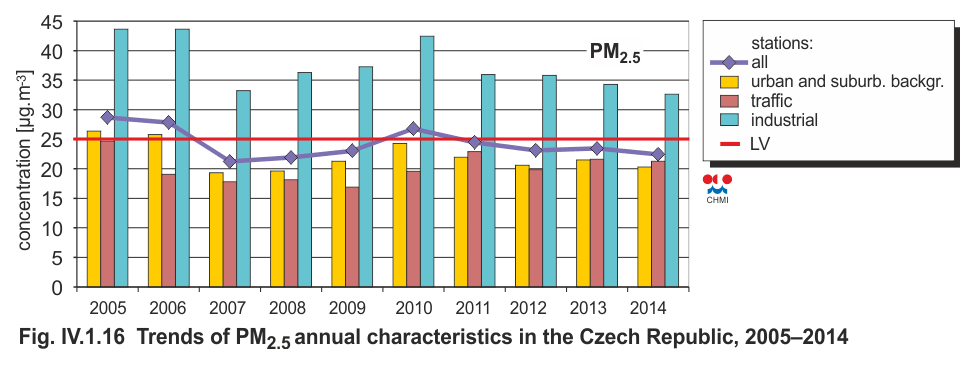
Fig. IV.1.16 |
Trends of PM2.5 annual characteristics in the Czech
Republic, 2005–2014 |
|
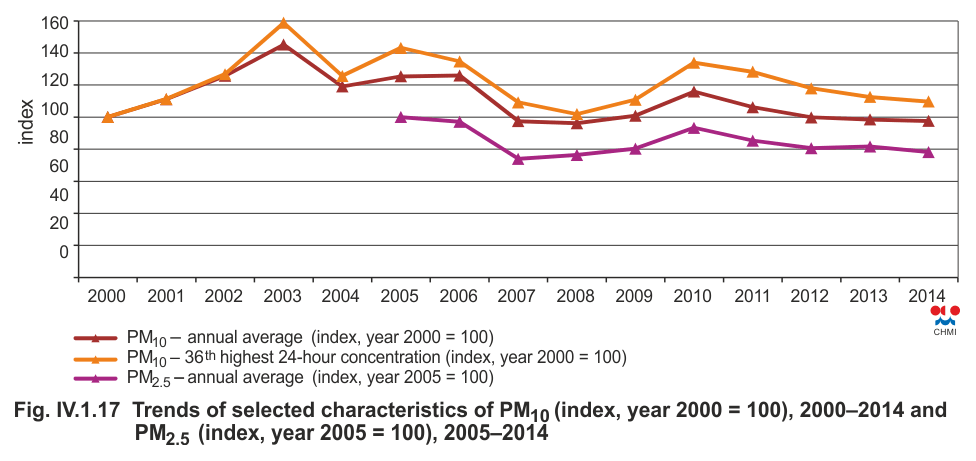
Fig. IV.1.17 |
Trends of selected characteristics of PM10 (index,
year 2000 = 100), 2000–2014 and PM2.5 (index, year 2005
= 100), 2005–2014 |
|
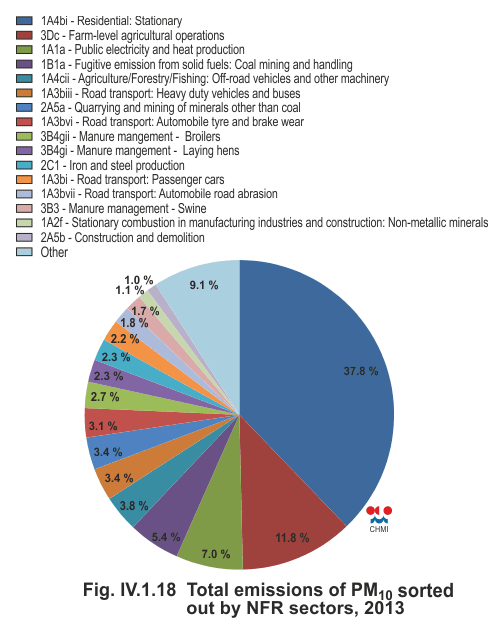
Fig. IV.1.18 |
Total emissions of PM10 sorted out by NFR sectors,
2013 |
|
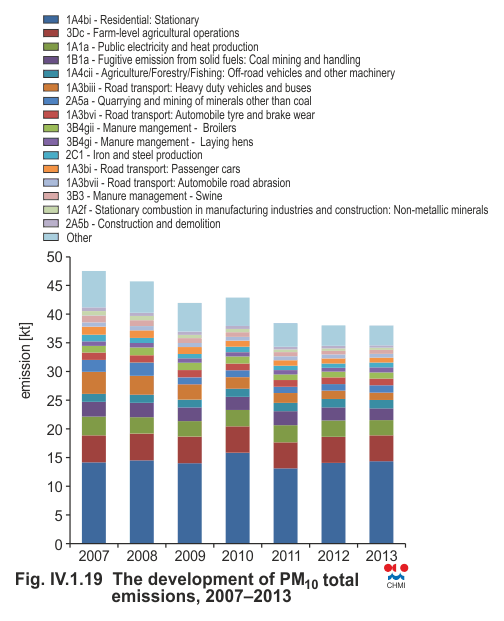
Fig. IV.1.19 |
The development of PM10 total emissions, 2007–2013 |
|
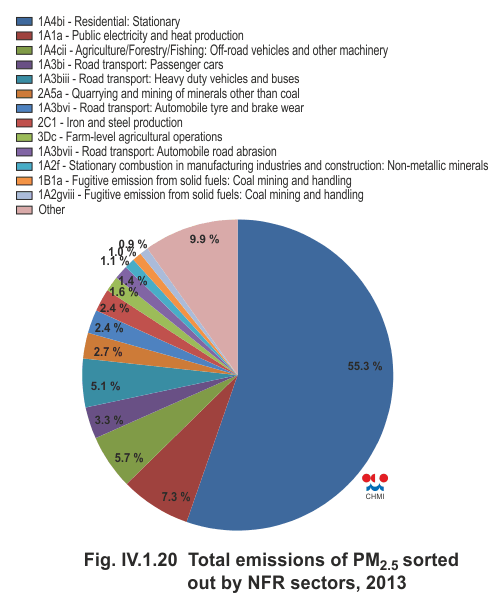
Fig. IV.1.20 |
Total emissions of PM2.5 sorted out by NFR sectors,
2013 |
|
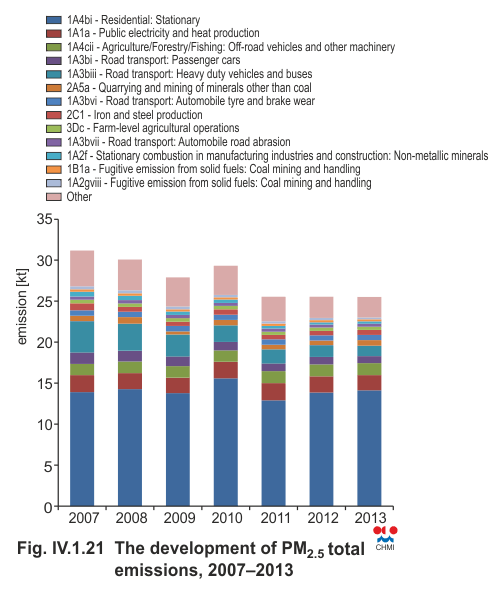
Fig. IV.1.21 |
The development of PM2.5 total emissions, 2007–2013 |
|
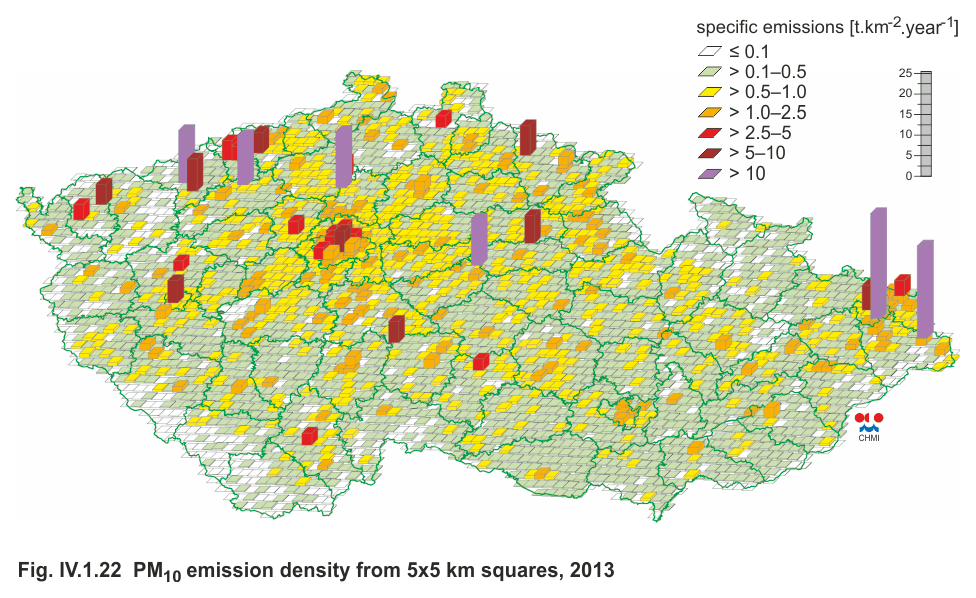
Fig. IV.1.22 |
PM10 emission density from 5x5 km squares, 2013 |
|
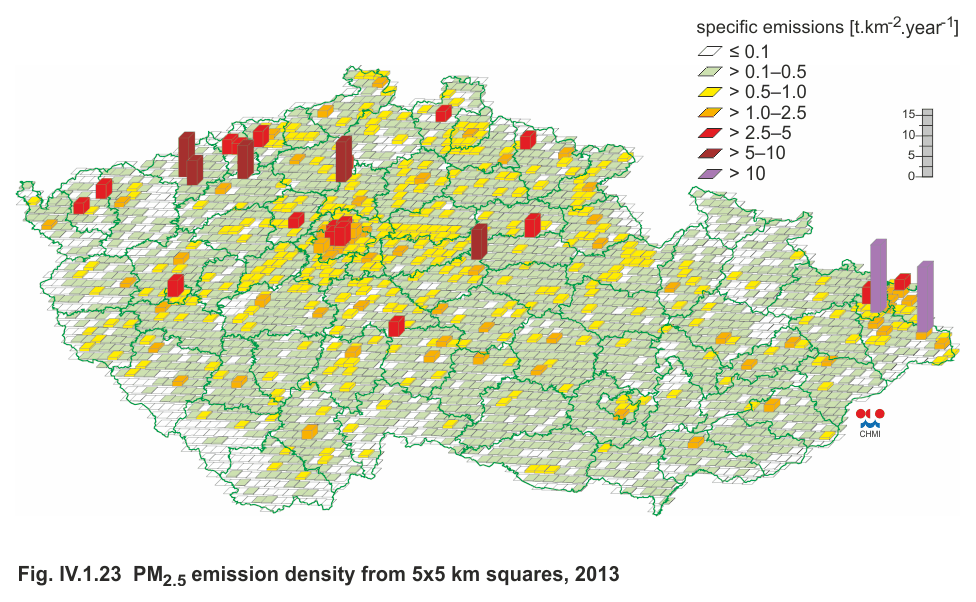
Fig. IV.1.23 |
PM2.5 emission density from 5x5 km squares, 2013 |
|
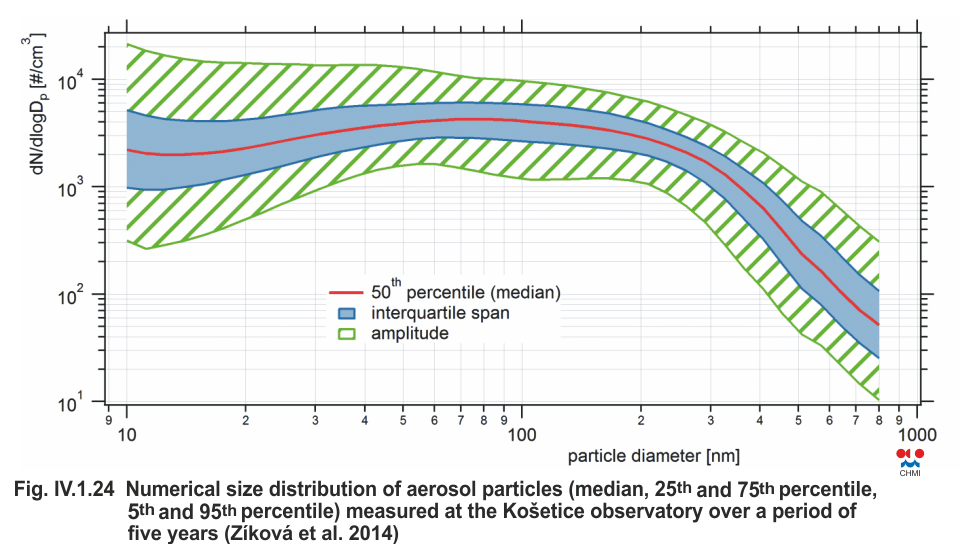
Fig. IV.1.24 |
Numerical size distribution of aerosol particles (median,
25th and 75th percentile, 5th and 95th percentile)
measured at the Košetice observatory over a period of
five years (Zíková et al. 2014) |
|
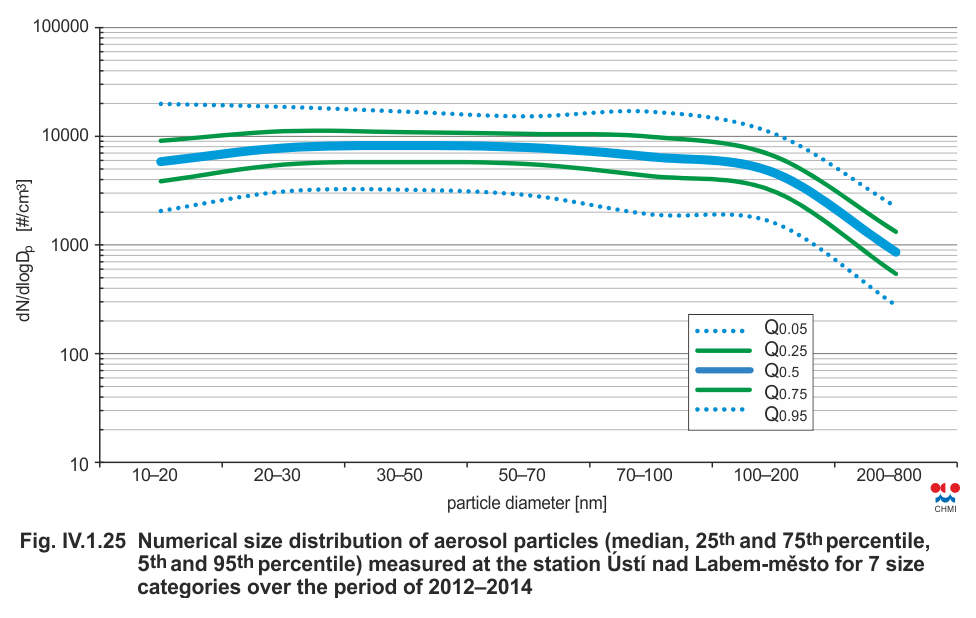
Fig. IV.1.25 |
Numerical size distribution of aerosol particles (median,
25th and 75th percentile, 5th and 95th percentile)
measured at the station Ústí nad Labem-město for 7 size
categories over the period of 2012–2014 |
|
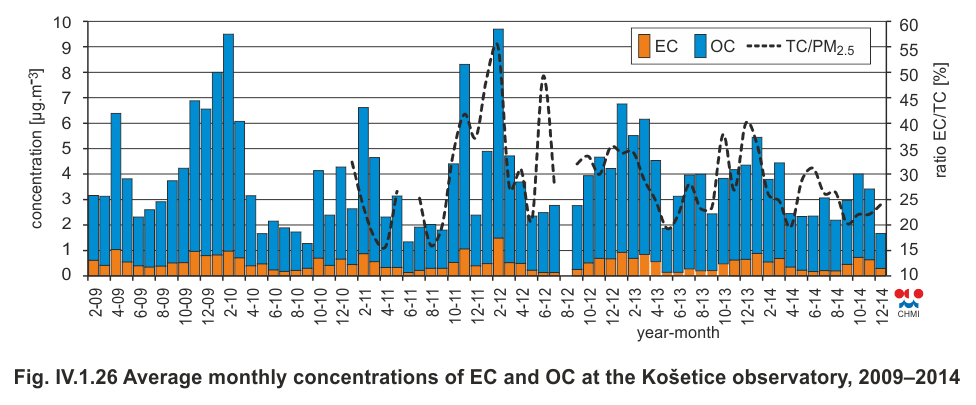
Fig. IV.1.26 |
Average monthly concentrations of EC and OC at the
Košetice observatory, 2009–2014 |
|
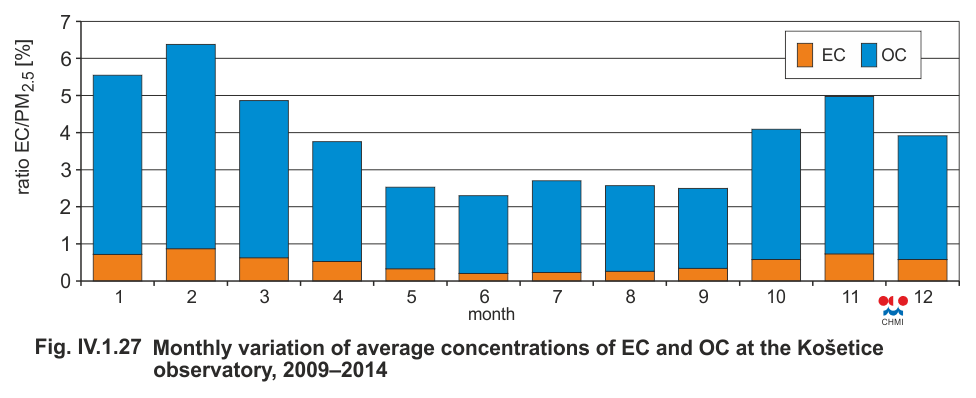
Fig. IV.1.27 |
Monthly variation of average concentrations of EC
and OC at the Košetice observatory, 2009–2014 |
|
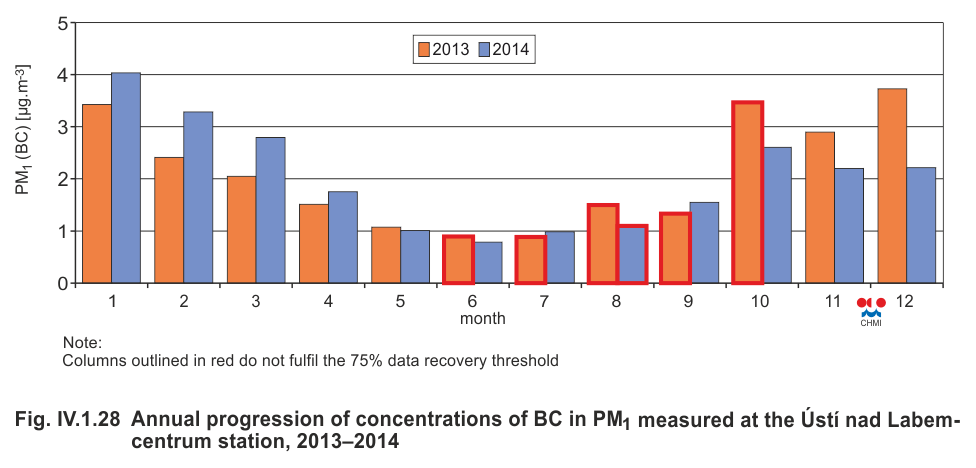
Fig. IV.1.28 |
Annual progression of concentrations of BC in PM1 measured at the Ústí nad Labem-centrum station,
2013–2014 |
|
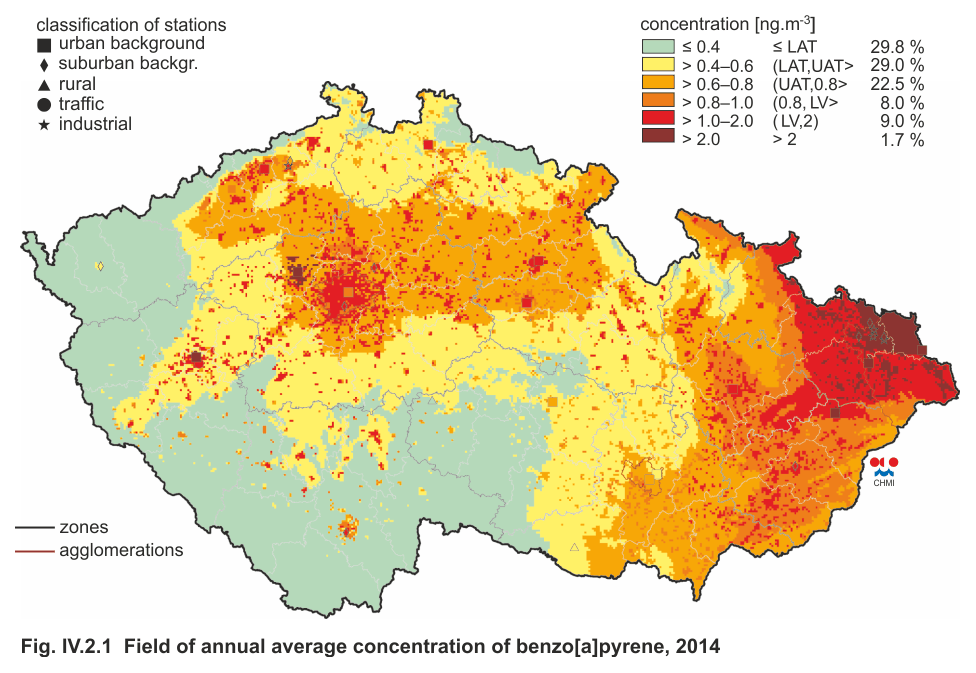
Fig. IV.2.1
|
Field of annual average concentration of benzo[a]pyrene,
2014 |
|
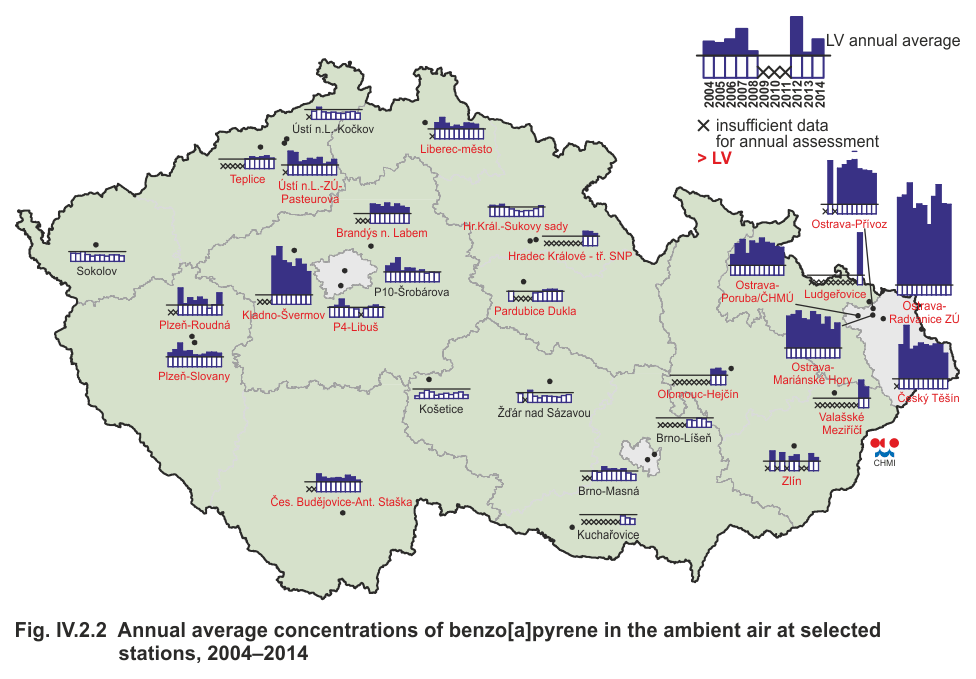
Fig. IV.2.2 |
Annual average concentrations of benzo[a]pyrene in
the ambient air at selected stations, 2004–2014 |
|
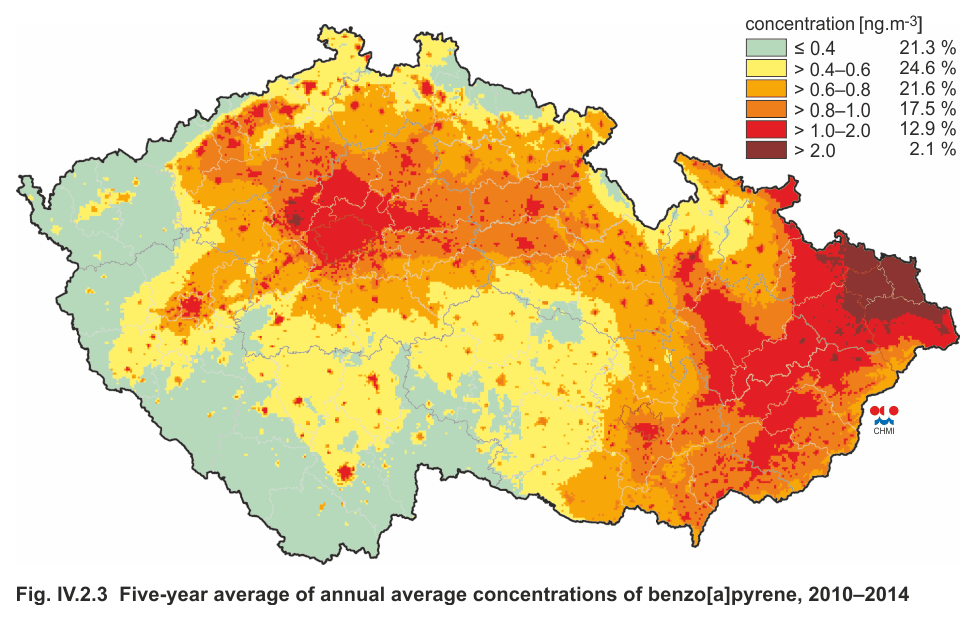
Fig. IV.2.3 |
Five-year average of annual average concentrations
of benzo[a]pyrene, 2010–2014 |
|
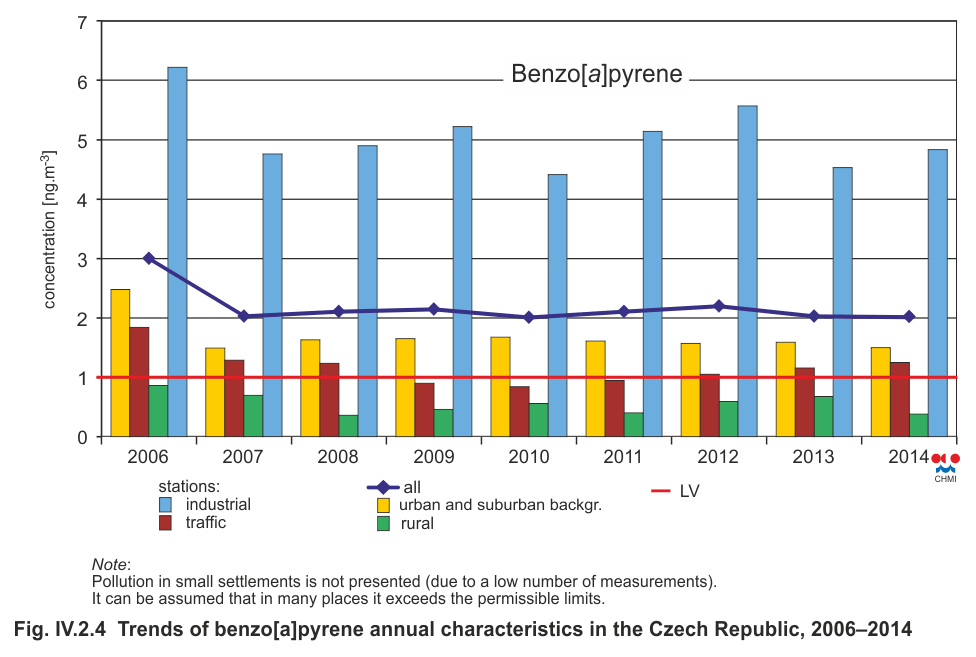
Fig. IV.2.4 |
Trends of benzo[a]pyrene annual characteristics in
the Czech Republic, 2006–2014 |
|
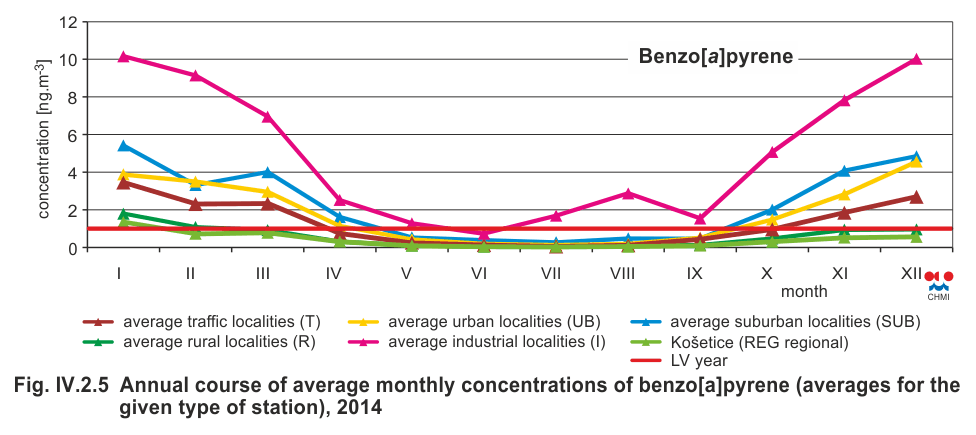
Fig. IV.2.5 |
Annual course of average monthly concentrations of
benzo[a]pyrene (averages for the given type of station),
2014 |
|
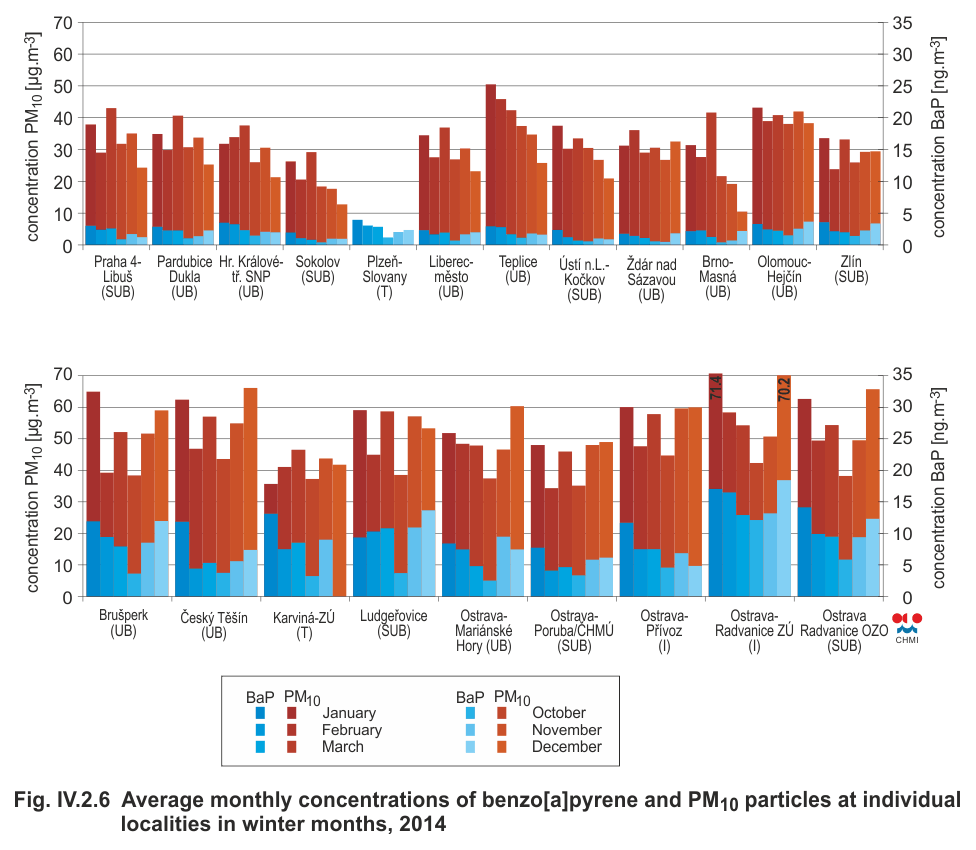
Fig. IV.2.6 |
Average monthly concentrations of benzo[a]pyrene and
PM10 particles at individual localities in winter months,
2014 |
|
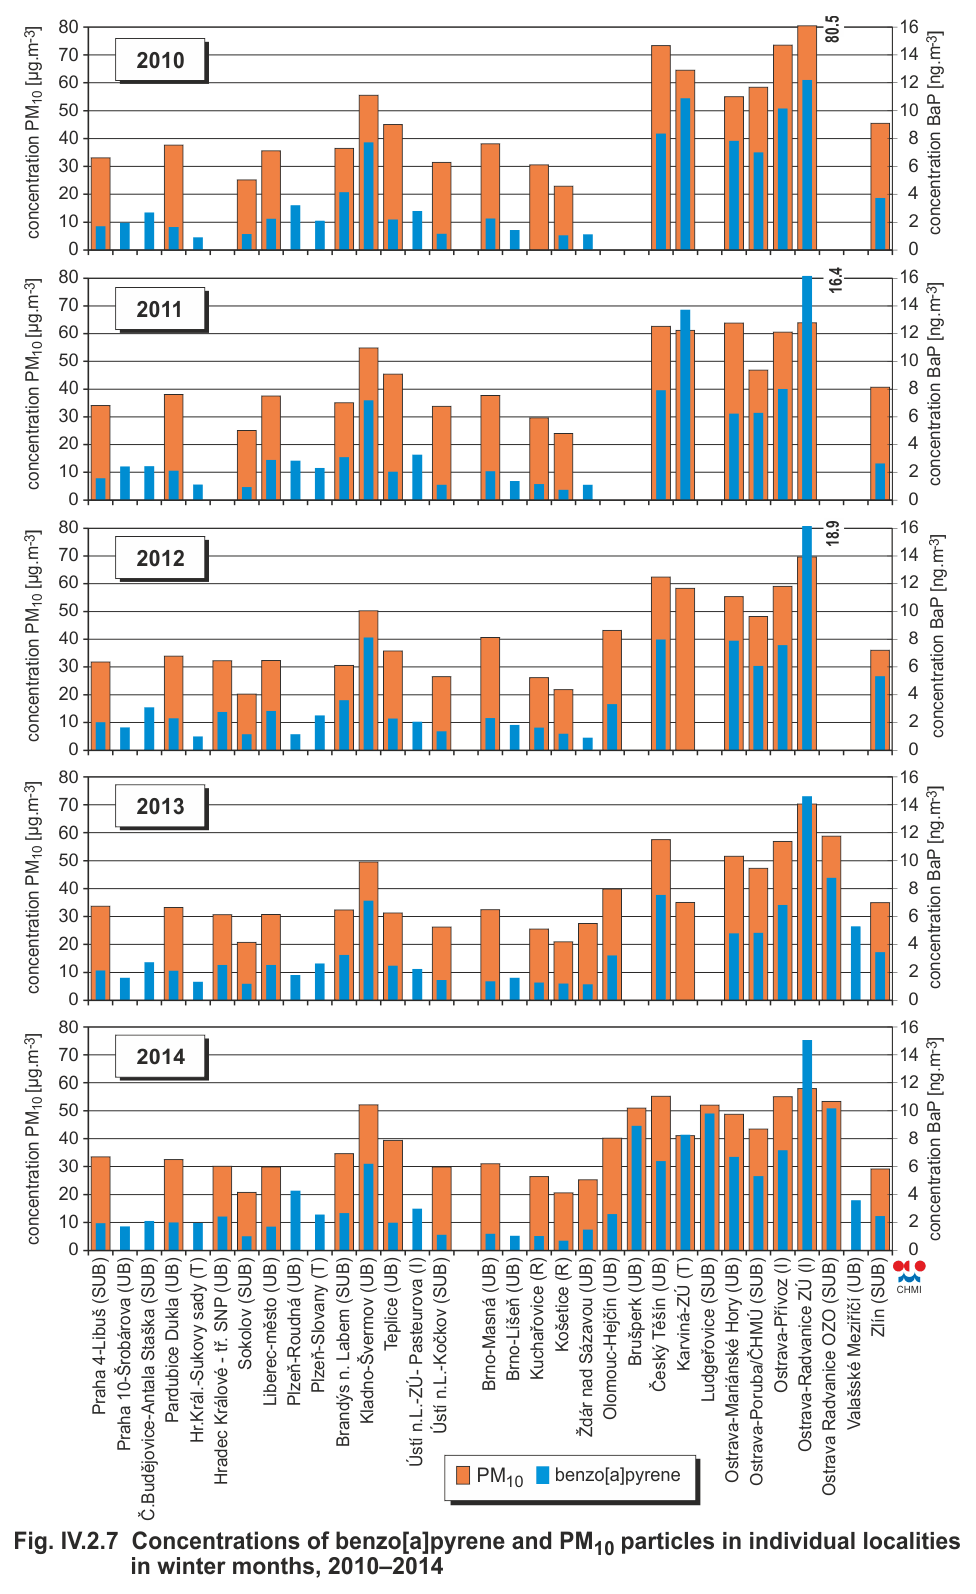
Fig. IV.2.7 |
Concentrations of benzo[a]pyrene and PM10 particles
at individual localities in winter months, 2010–2014 |
|
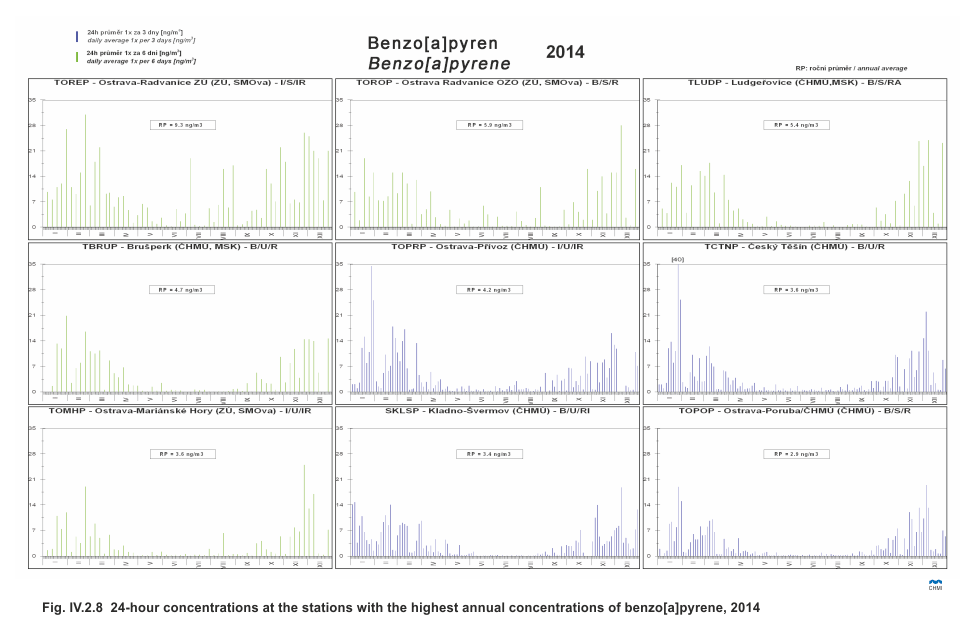
Fig. IV.2.8 |
24-hour concentrations at the stations with the highest annual concentrations of benzo[a]pyrene, 2014 |
|
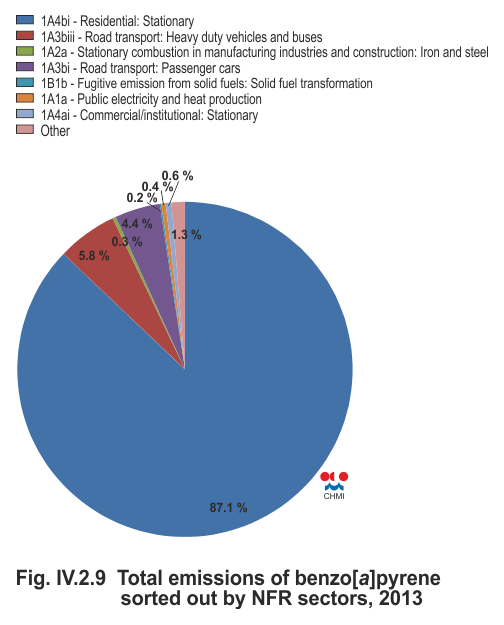
Fig. IV.2.9 |
Total emissions of benzo[a]pyrene sorted out by NFR
sectors, 2013 |
|
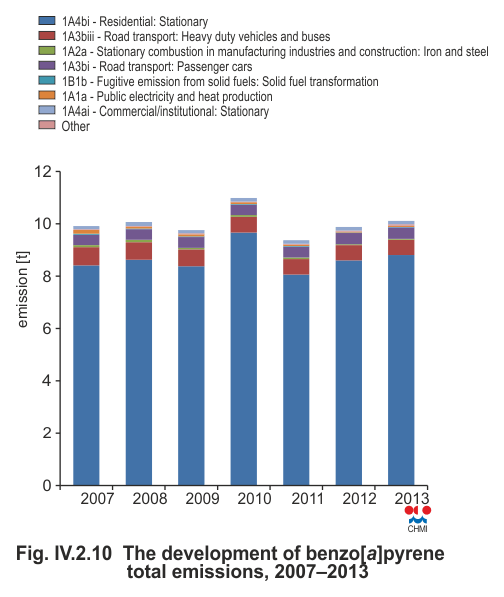
Fig. IV.2.10 |
The development of benzo[a]pyrene total emissions,
2007–2013 |
|
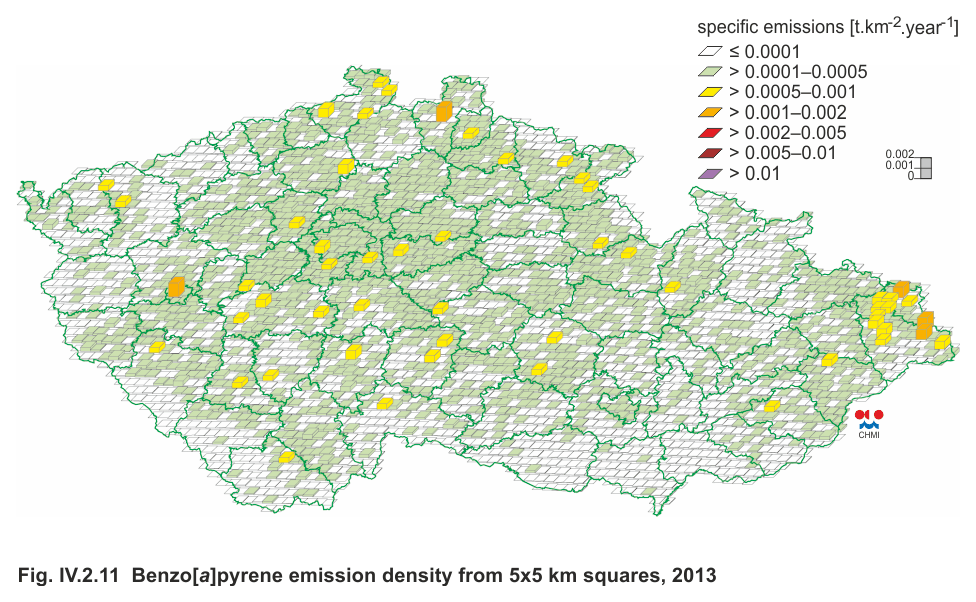
Fig. IV.2.11 |
Benzo[a]pyrene emission density from 5x5 km squares,
2013 |
|
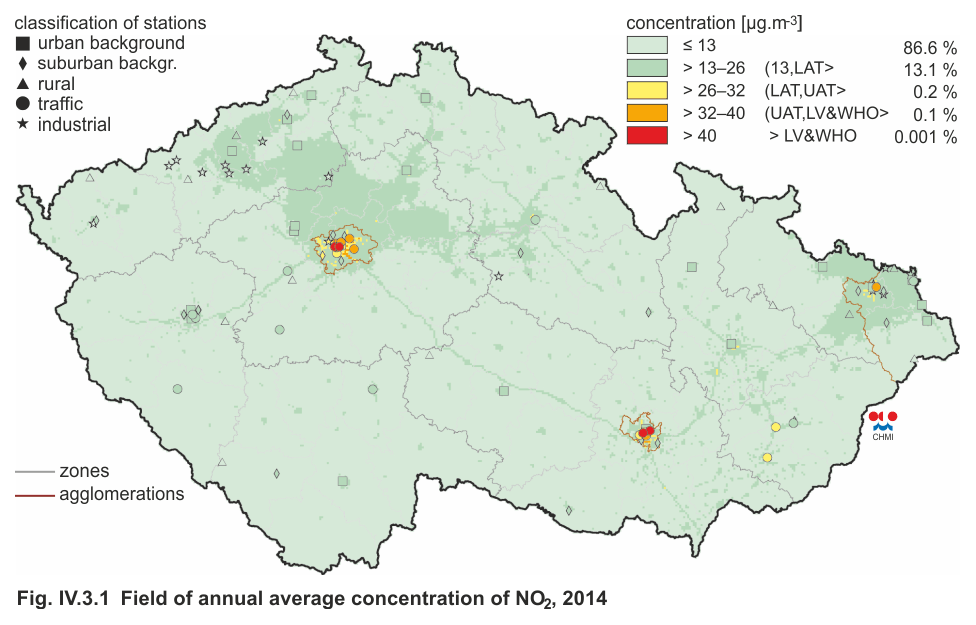
Fig. IV.3.1
|
Field of annual average concentration of NO2, 2014 |
|
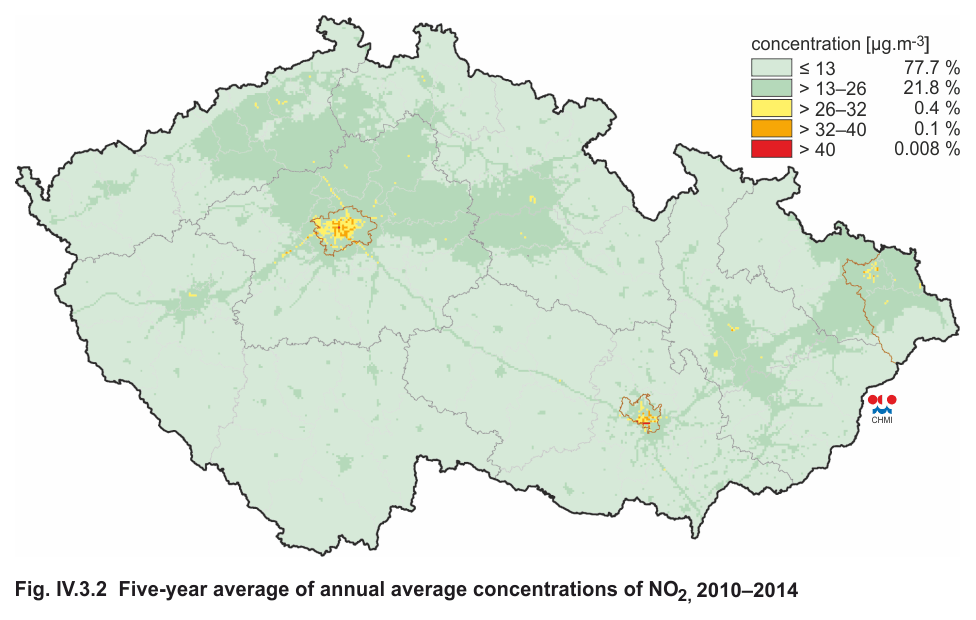
Fig. IV.3.2 |
Five-year average of annual average concentrations
of NO2, 2010–2014 |
|
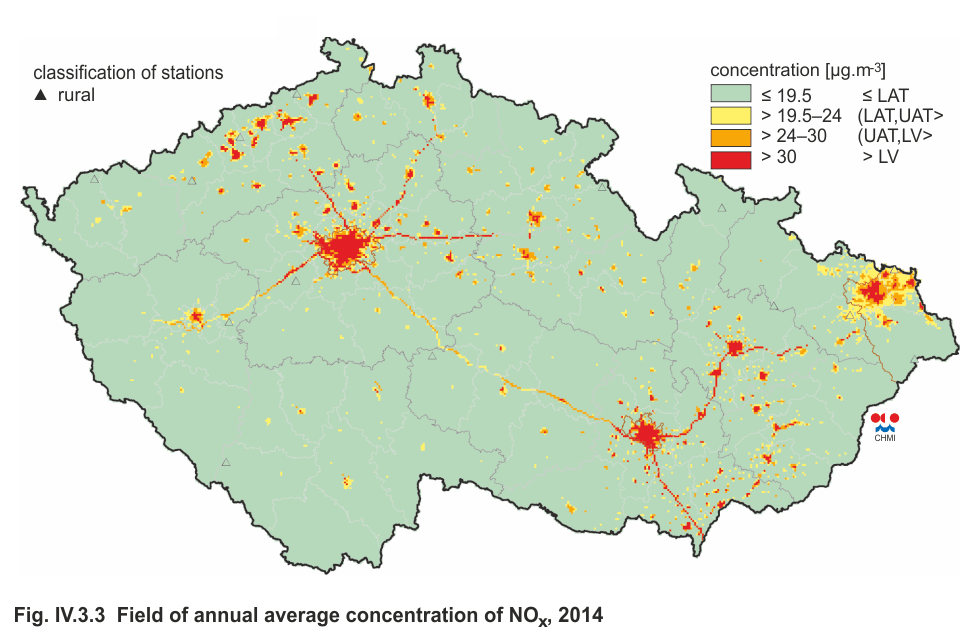
Fig. IV.3.3 |
Field of annual average concentration of NOx , 2014 |
|
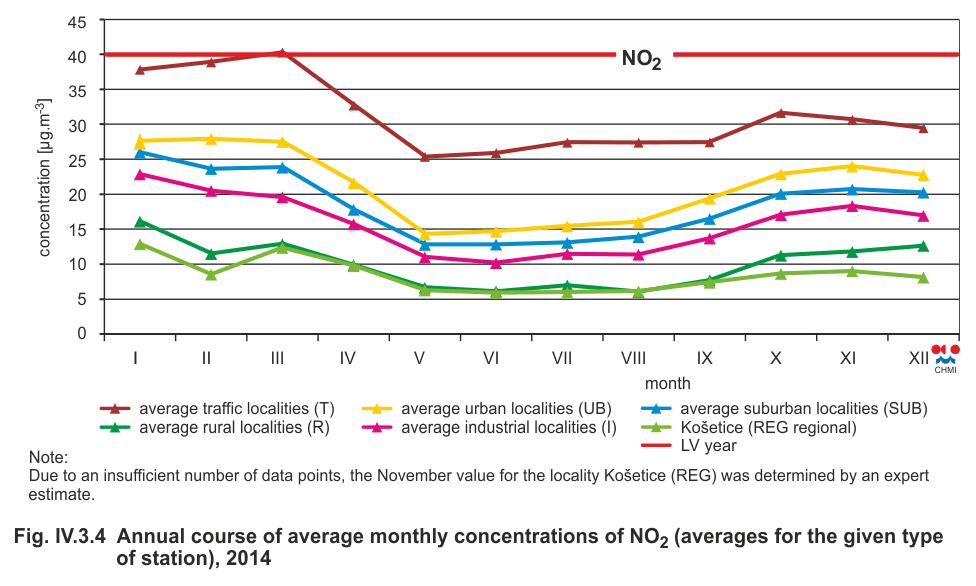
Fig. IV.3.4 |
Annual course of average monthly concentrations of
NO2 (averages for the given type of station), 2014 |
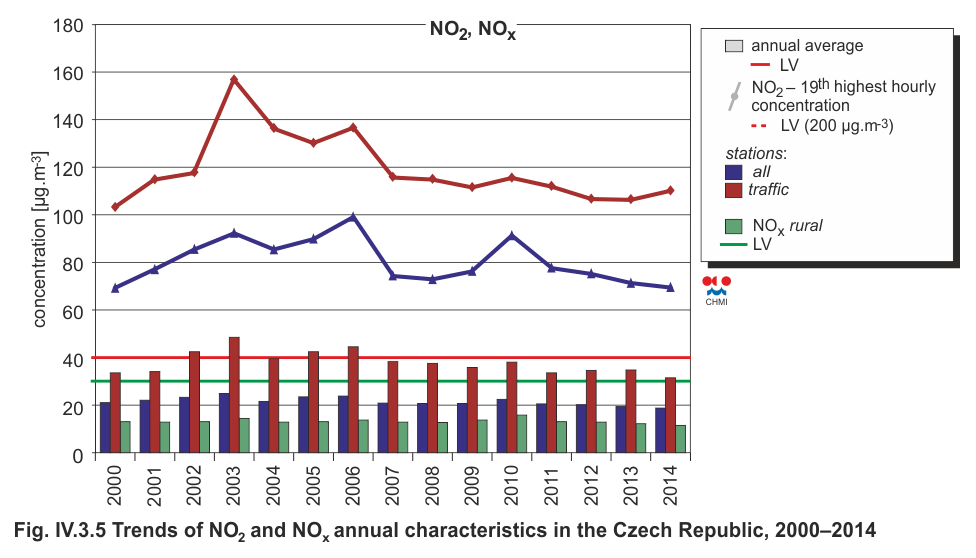
|
Fig. IV.3.5 |
Trends of NO2 and NOx annual characteristics in the
Czech Republic, 2000–2014 |
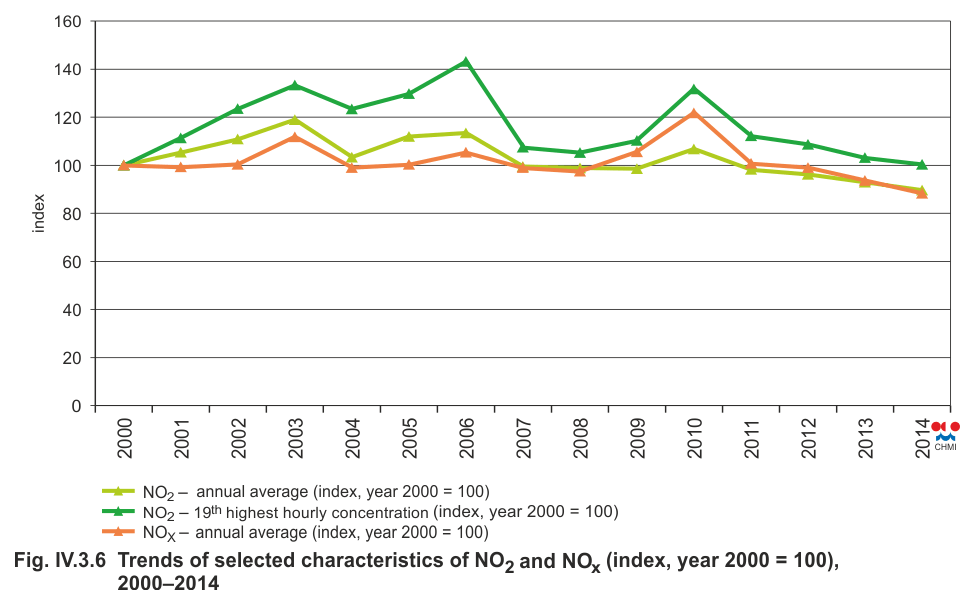
|
Fig. IV.3.6 |
Trends of selected characteristics of NO2 and NOx
(index, year 2000 = 100), 2000–2014 |
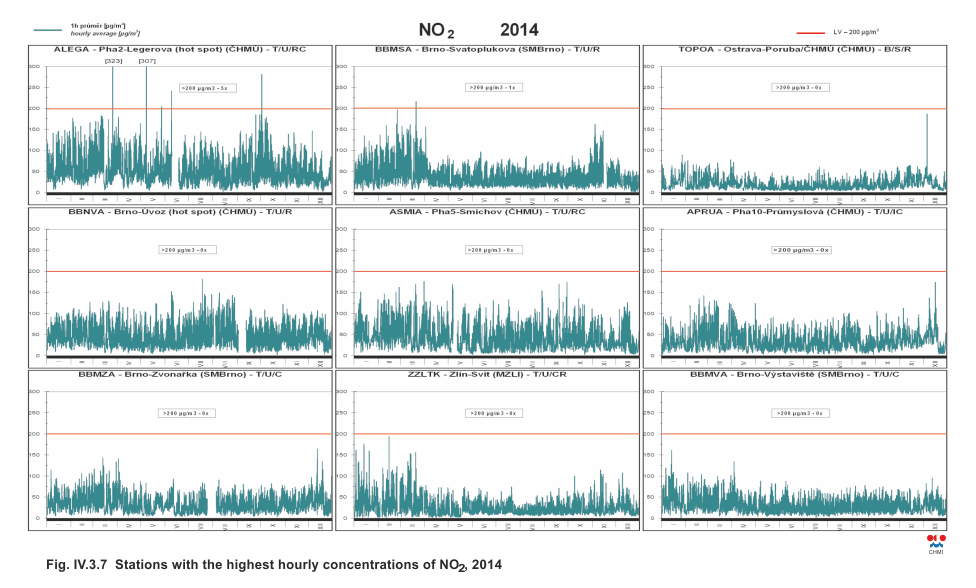
|
Fig. IV.3.7 |
Stations with the highest hourly concentrations of
NO2, 2014 |
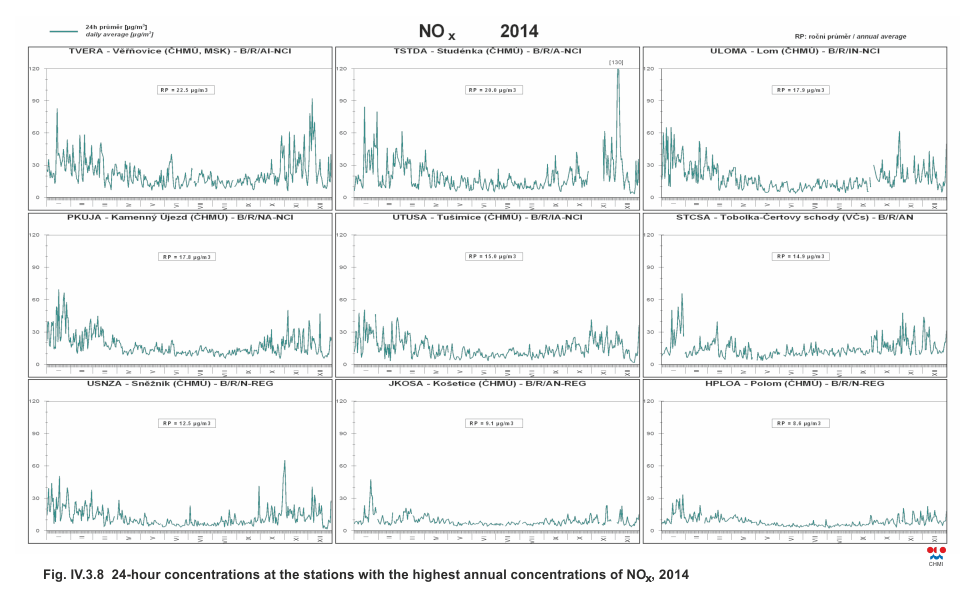
|
Fig. IV.3.8 |
24-hour concentrations at the stations with the highest annual concentrations of NOx , 2014 |
|
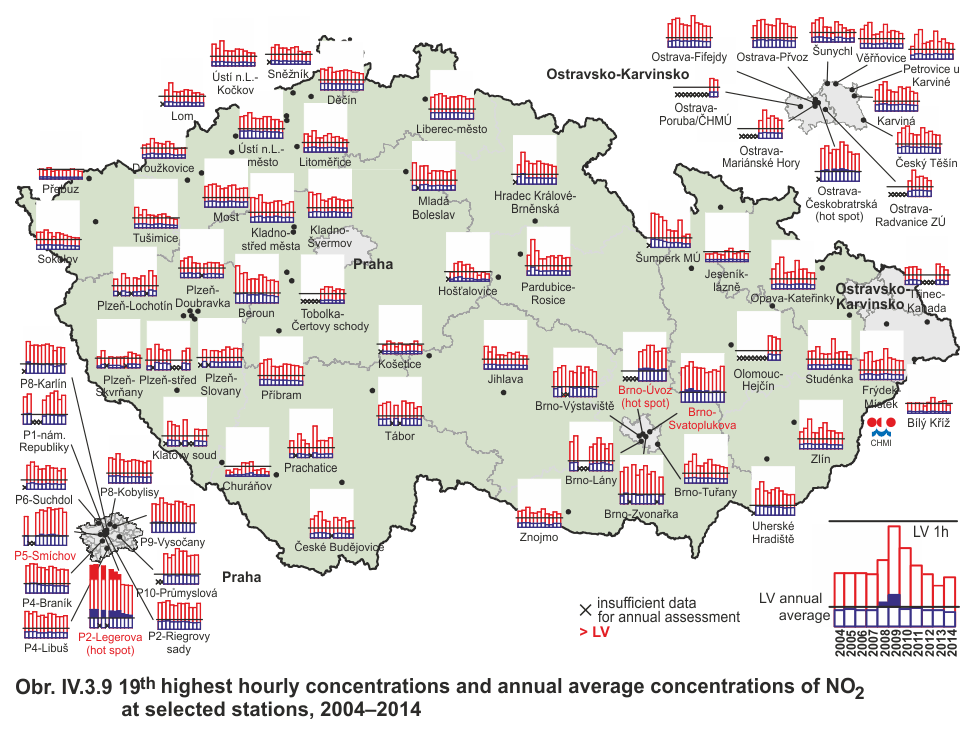
Fig. IV.3.9 |
19th highest hourly concentrations and annual
average concentrations of NO2 at selected stations,
2004–2014 |
|
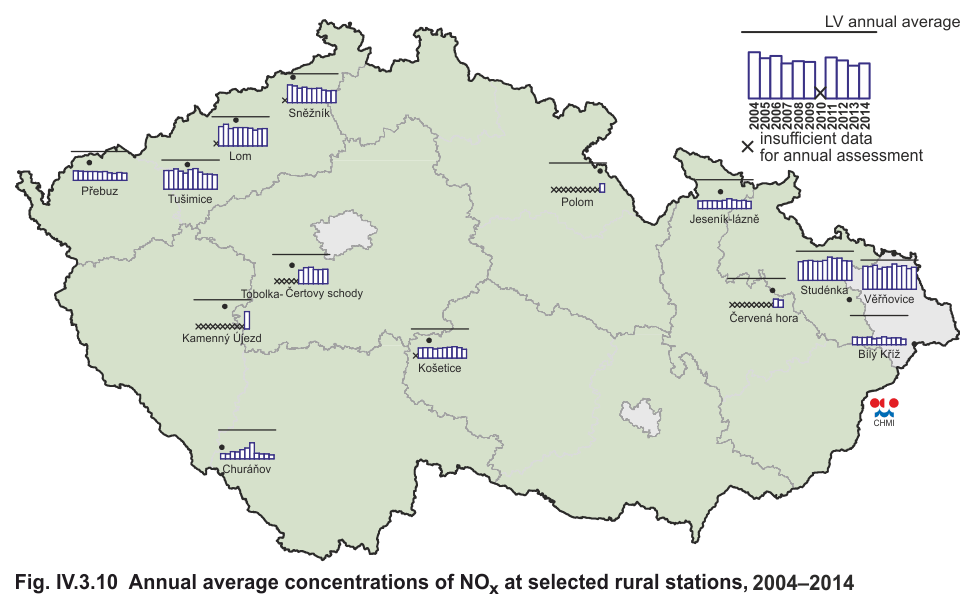
Fig. IV.3.10 |
Annual average concentrations of NOx at selected
rural stations, 2004–2014 |
|
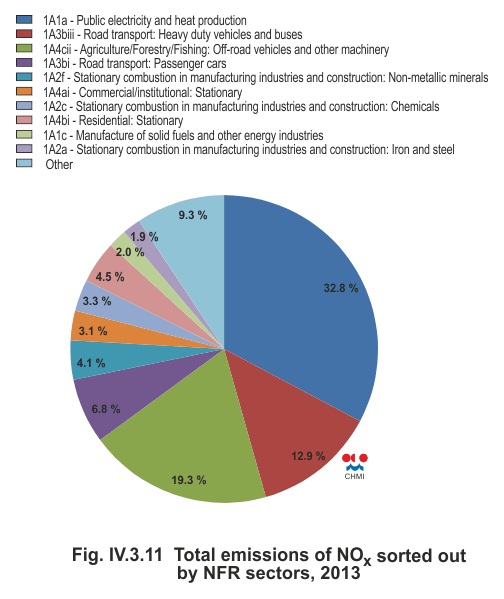
Fig. IV.3.11 |
Total emissions of NOx sorted out by NFR sectors,
2013 |
|
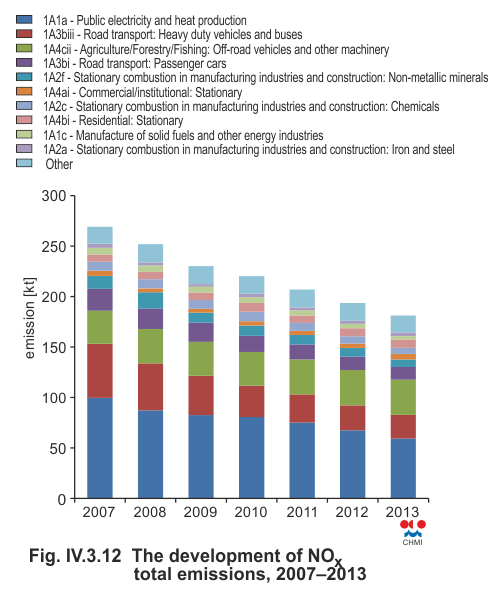
Fig. IV.3.12 |
The development of NOx total emissions, 2007–2013 |
|
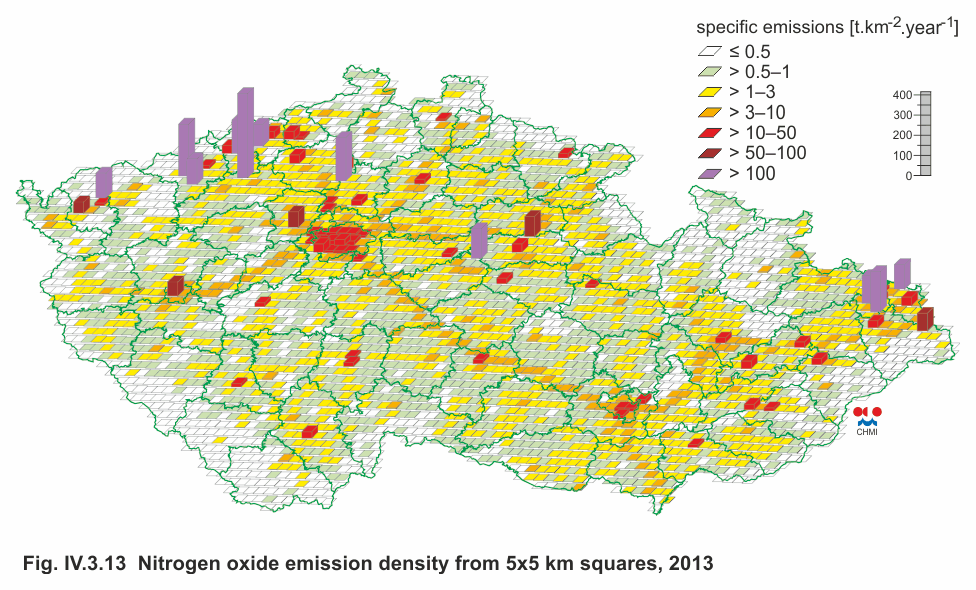
Fig. IV.3.13 |
Nitrogen oxide emission density from 5x5 km squares,
2013 |
|
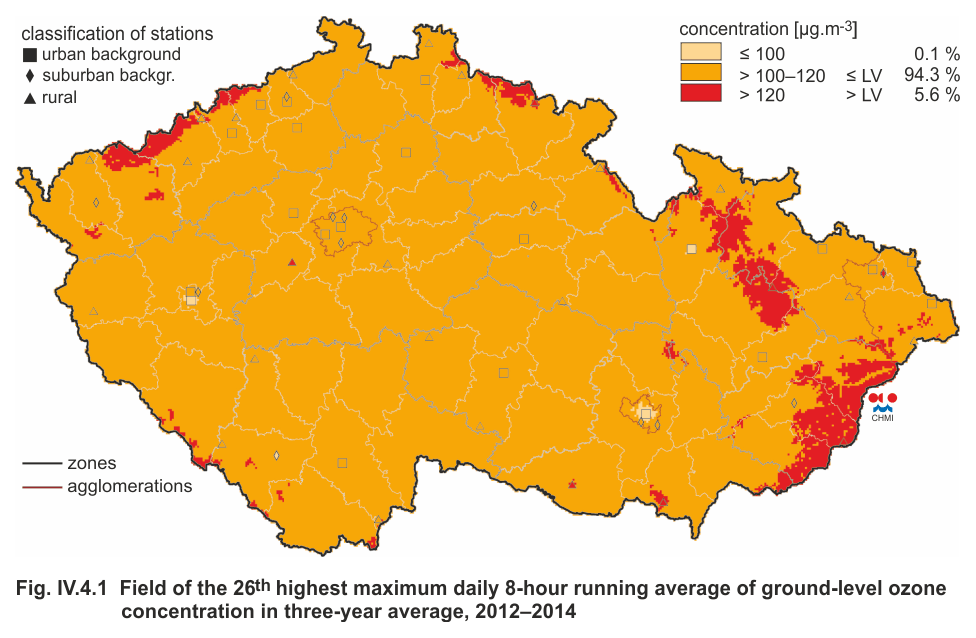
Fig. IV.4.1 |
Field of the 26th highest maximum daily 8-hour
running average of ground-level ozone concentration in
three-year average, 2012–2014 |
|
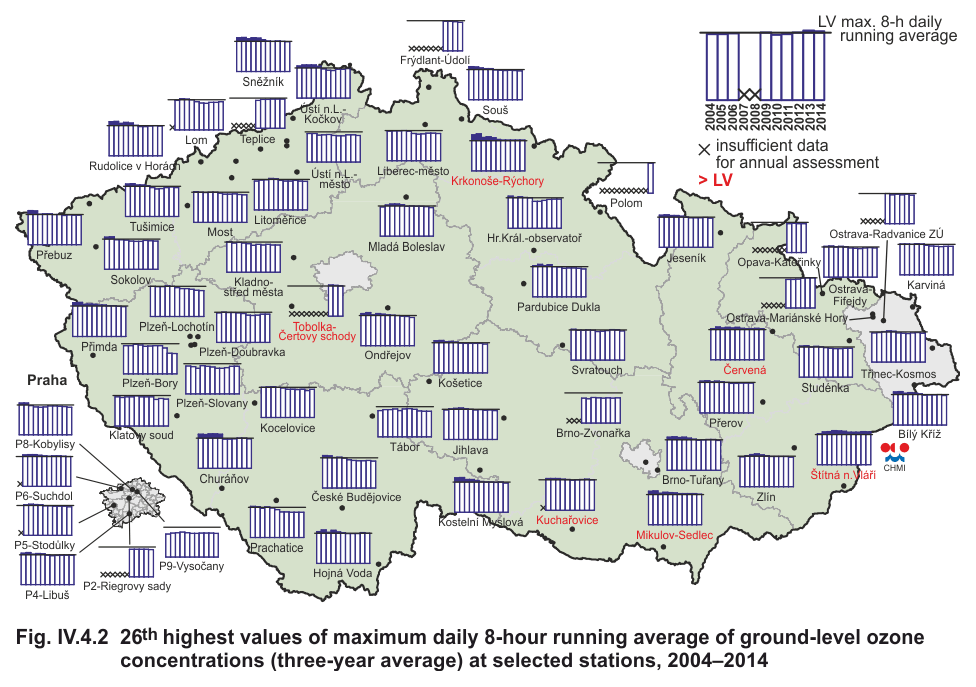
Fig. IV.4.2 |
26th highest values of maximum daily 8-hour running
average of ground-level ozone concentrations (three-year
average) at selected stations, 2004–2014 |
|
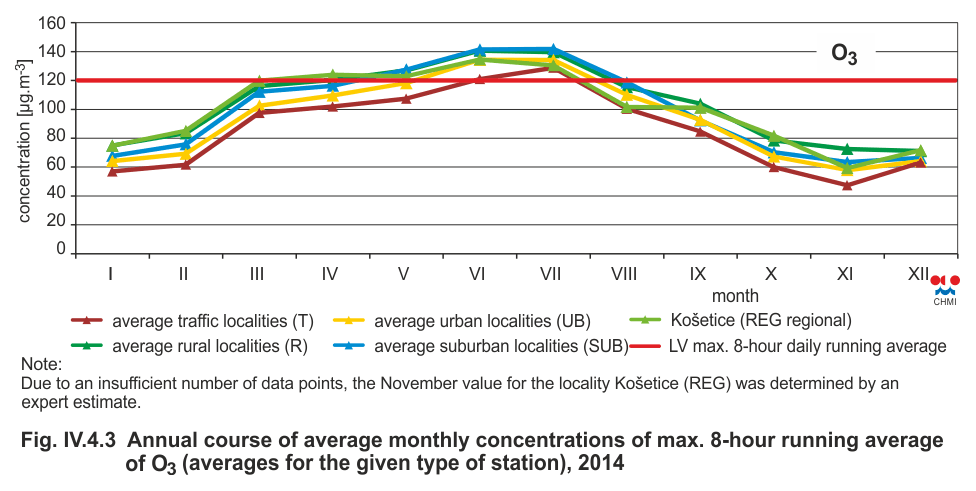
Fig. IV.4.3
|
Annual course of average monthly concentrations of
max. 8-hour running average of O3 (averages for the
given type of station), 2014 |
|
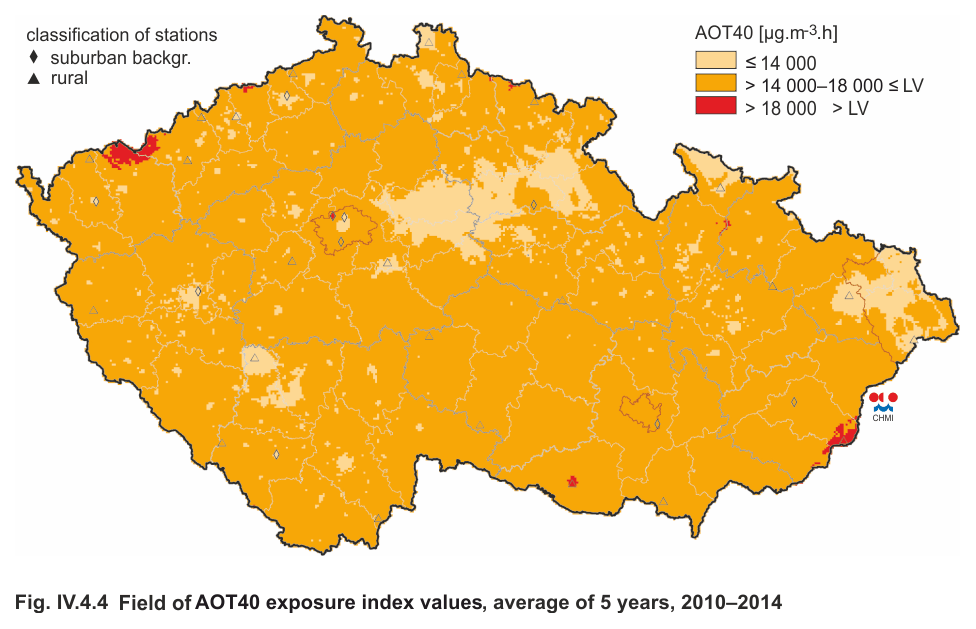
Fig. IV.4.4 |
Field of AOT40 exposure index values, average of 5
years, 2010–2014 |
|
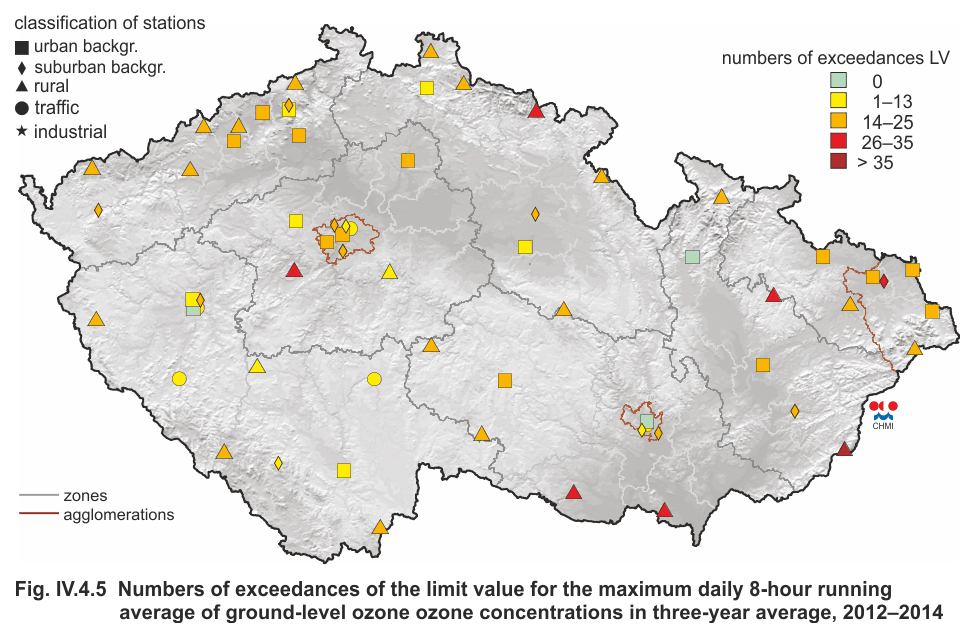
Fig. IV.4.5 |
Numbers of exceedances of the limit value for the
maximum daily 8-hour running average of ground-level
ozone concentrations in three-year average, 2012–2014 |
|
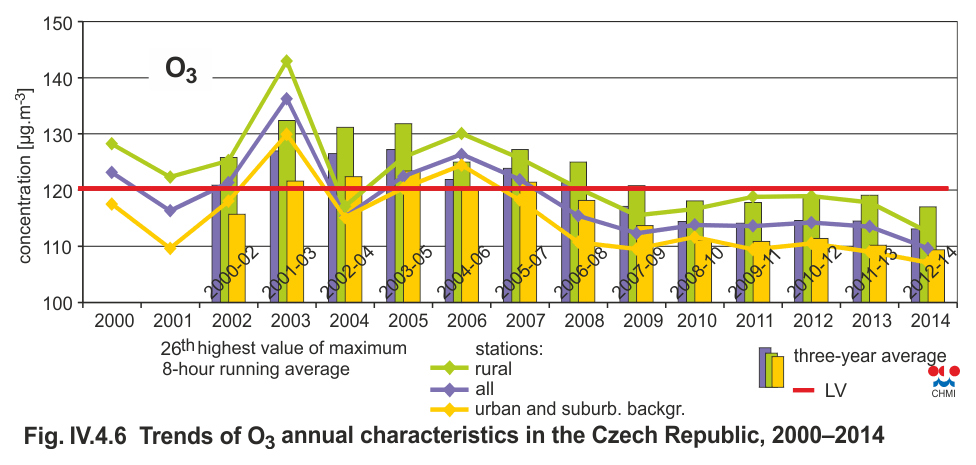
Fig. IV.4.6 |
Trends of O3 annual characteristics in the Czech
Republic, 2000–2014 |
|
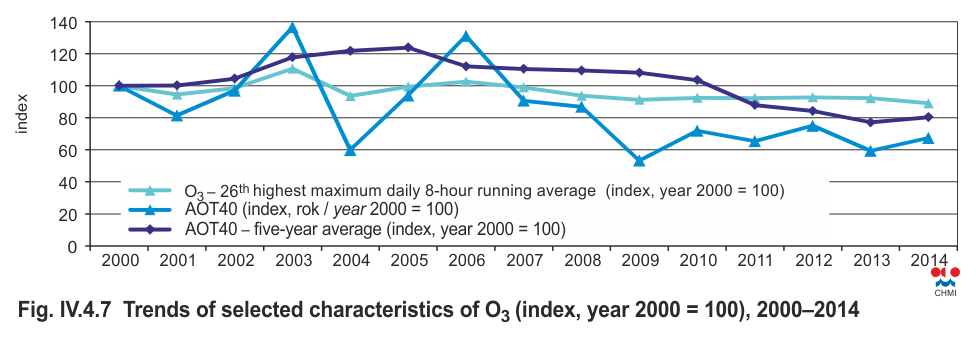
Fig. IV.4.7 |
Trends of selected characteristics of O3 (index,
year 2000 = 100), 2000–2014 |
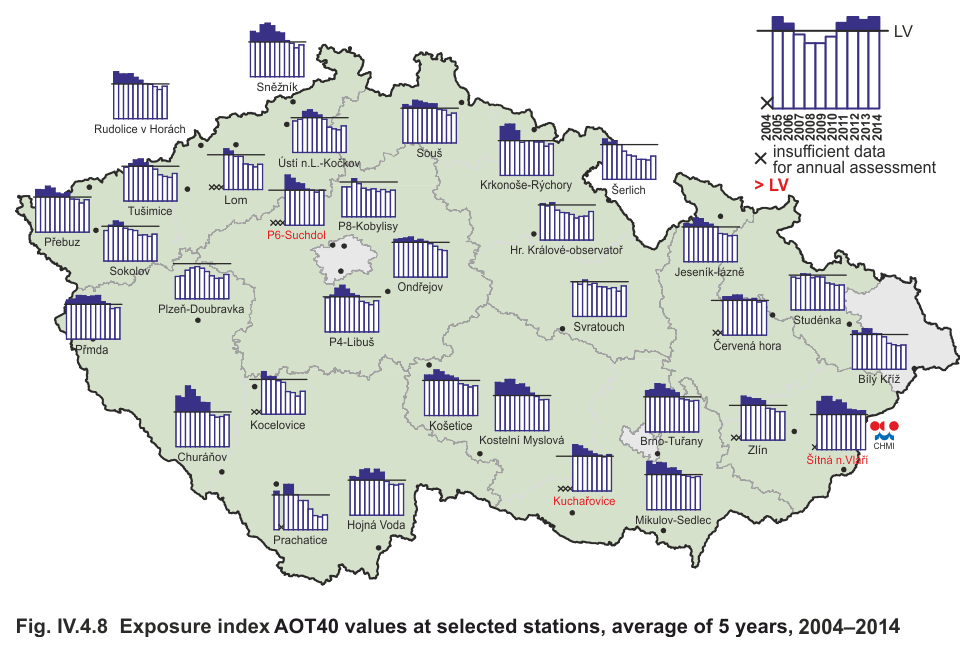
|
Fig. IV.4.8 |
Exposure index AOT40 values at selected stations,
average of 5 years 2004–2014 |
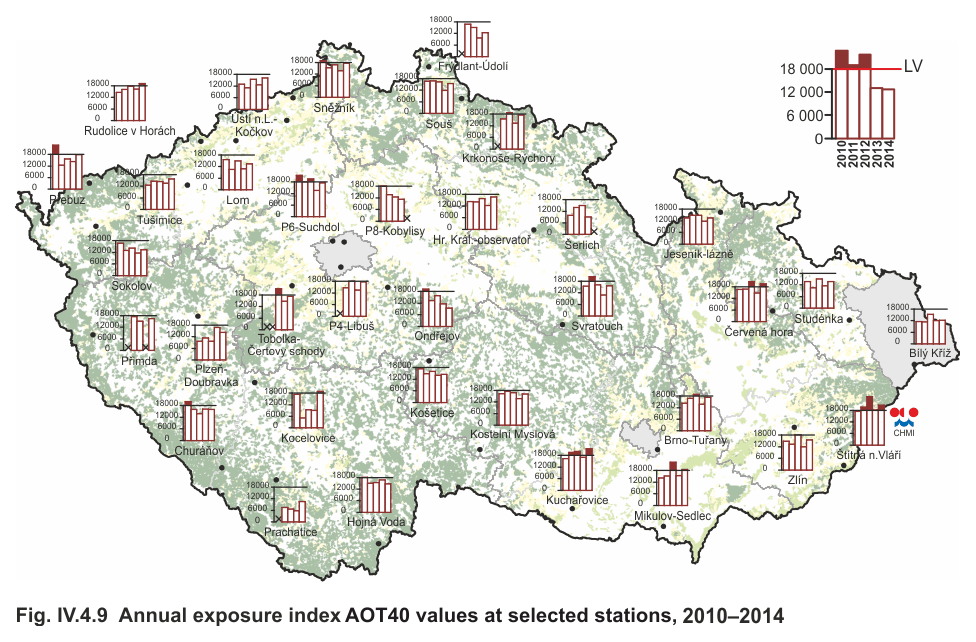
|
Fig. IV.4.9 |
Annual exposure index AOT40 values at selected
stations, 2010–2014 |
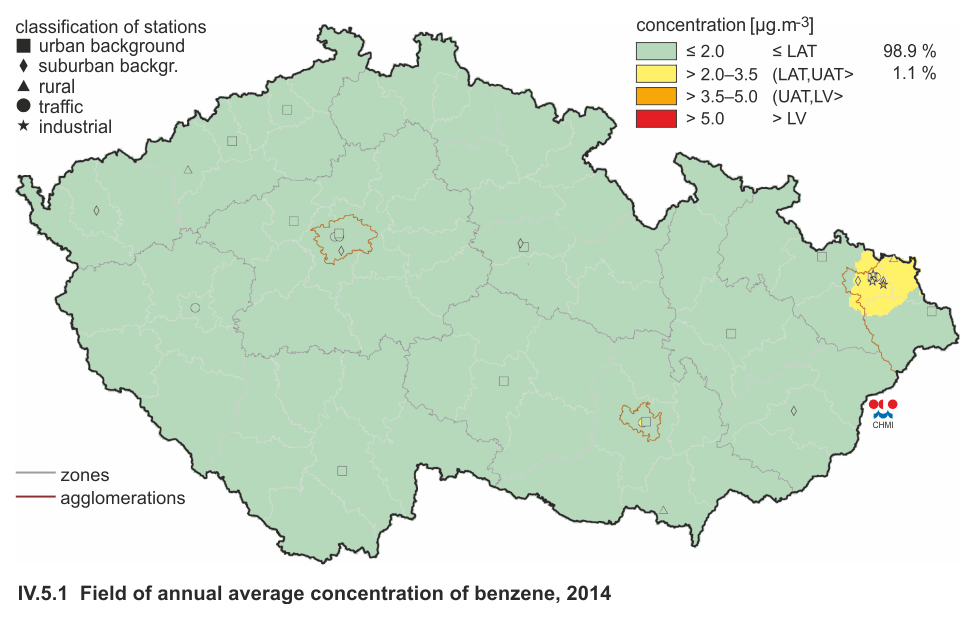
|
Fig. IV.5.1 |
Field of annual average concentration of benzene,
2014 |
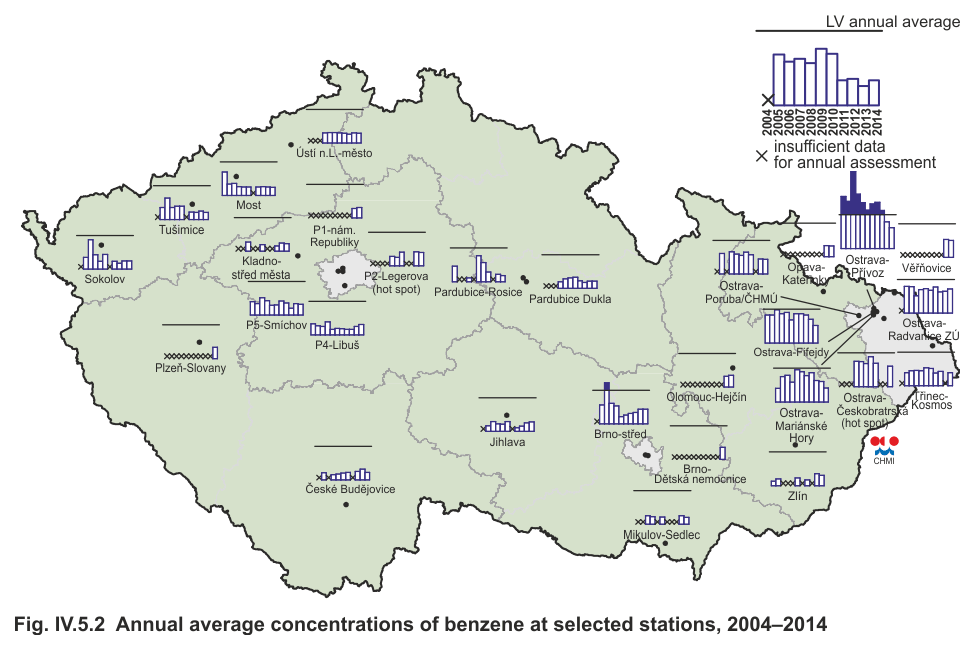
|
Fig. IV.5.2 |
Annual average concentrations of benzene at selected
stations, 2004–2014 |
|
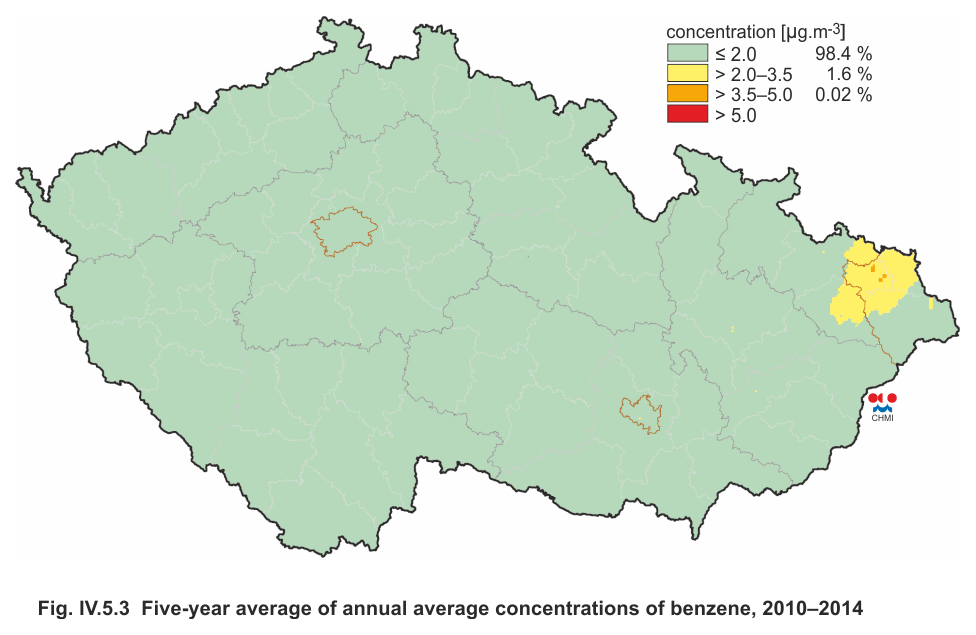
Fig. IV.5.3 |
Five-year average of annual average concentrations
of benzene, 2010–2014 |
|
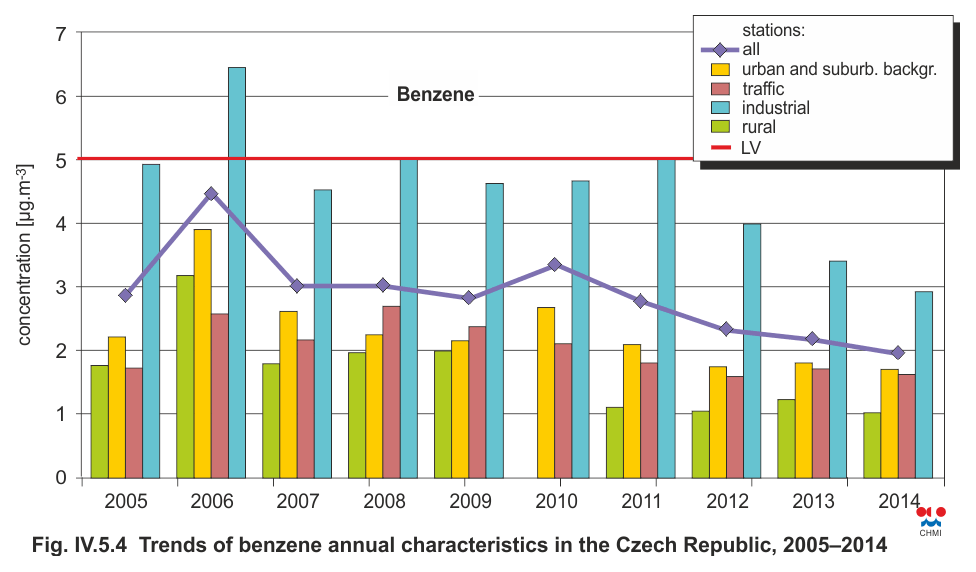
Fig. IV.5.4 |
Trends of benzene annual characteristics in the
Czech Republic, 2005–2014 |
|
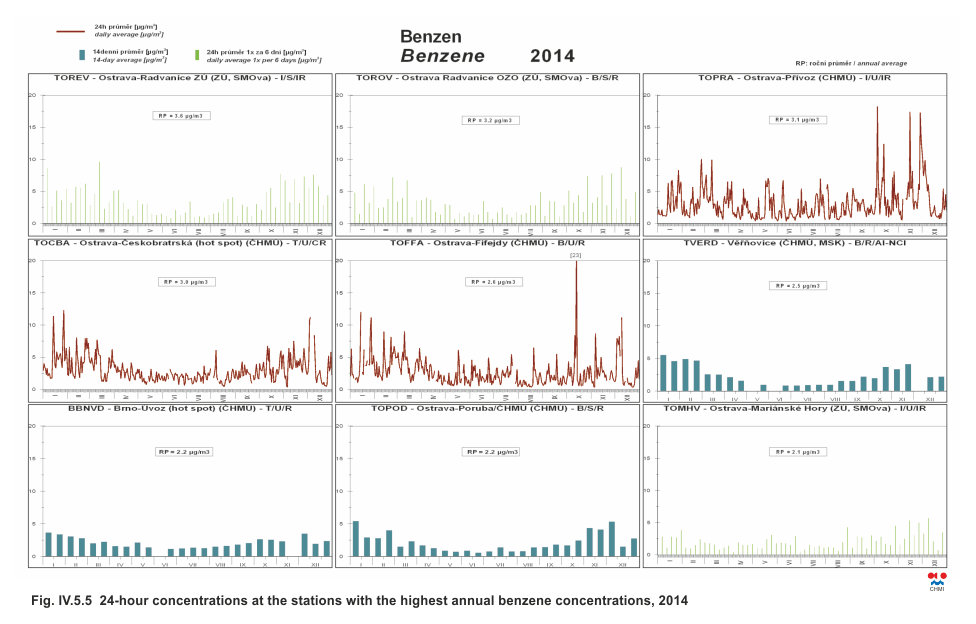
Fig. IV.5.5 |
24-hour concentrations at the stations with the highest annual benzene concentrations, 2014 |
|
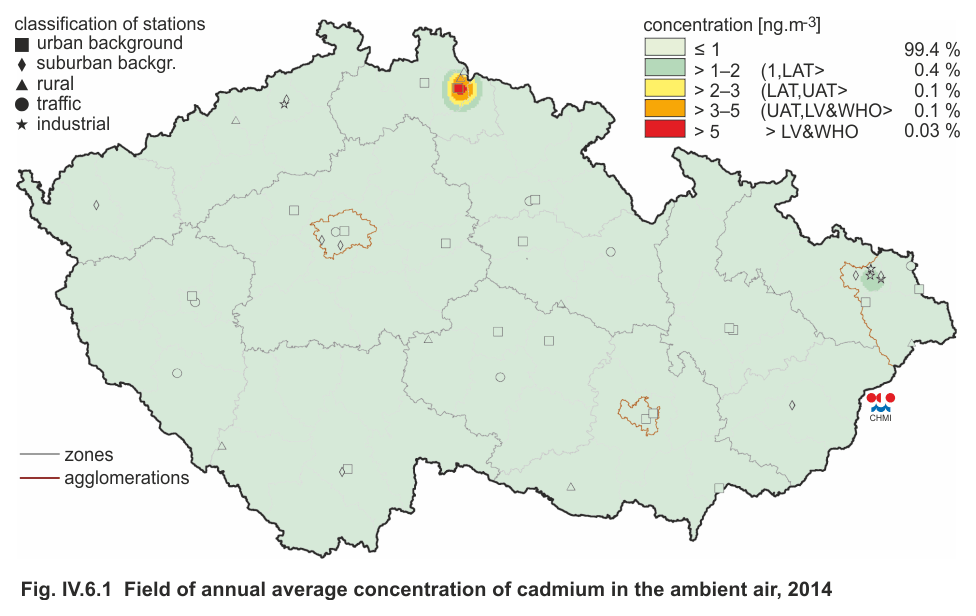
Fig. IV.6.1 |
Field of annual average concentration of cadmium in
the ambient air, 2014 |
|
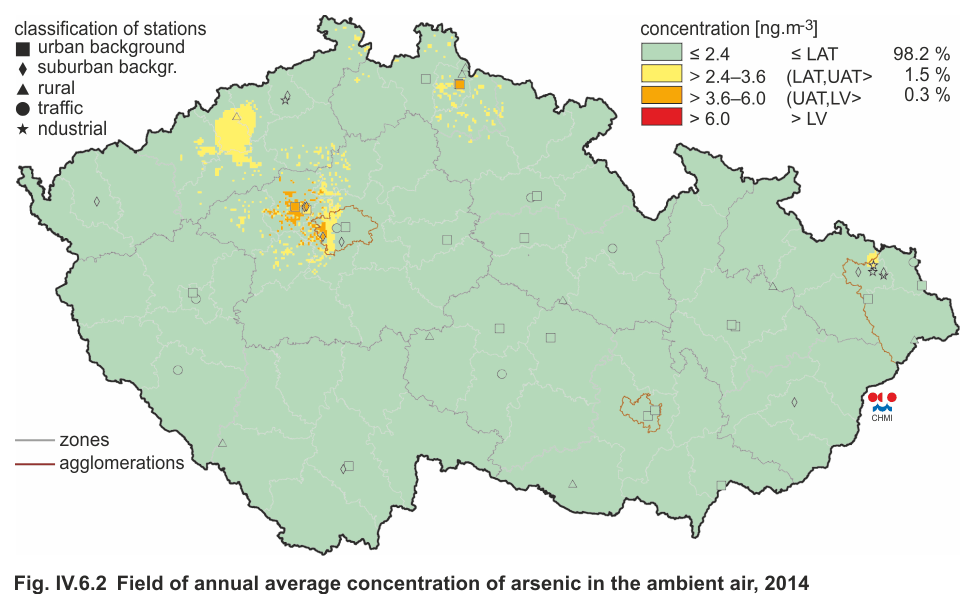
Fig. IV.6.2 |
Field of annual average concentration of arsenic in
the ambient air, 2014 |
|
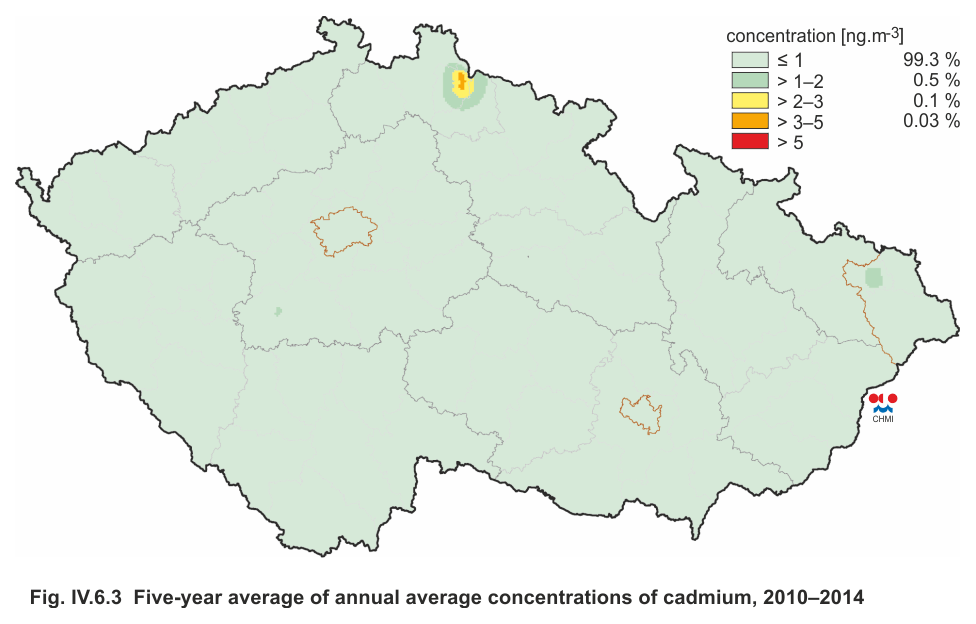
Fig. IV.6.3 |
Five-year average of annual average concentrations
of cadmium, 2010–2014 |
|
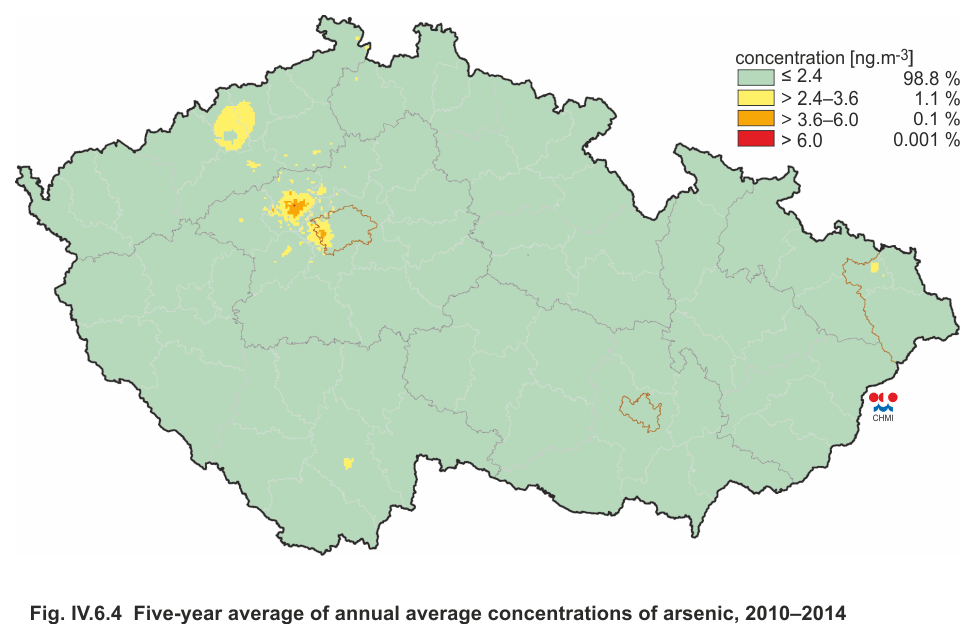
Fig. IV.6.4 |
Five-year average of annual average concentrations
of arsenic, 2010–2014 |
|
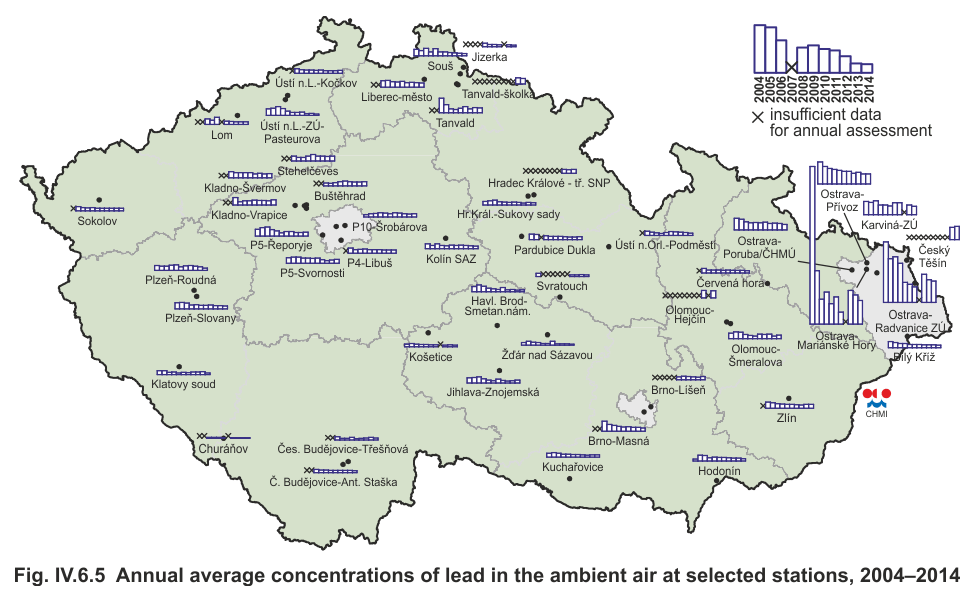
Fig. IV.6.5
|
Annual average concentrations of lead in the ambient
air at selected stations, 2004–2014 |
|
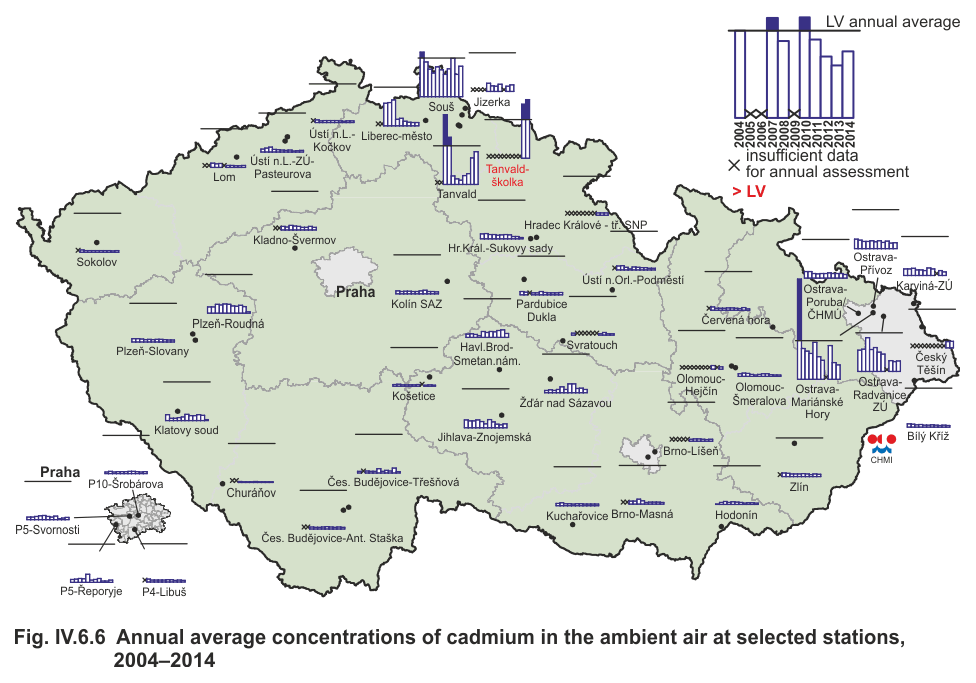
Fig. IV.6.6 |
Annual average concentrations of cadmium in the
ambient air at selected stations, 2004–2014 |
|
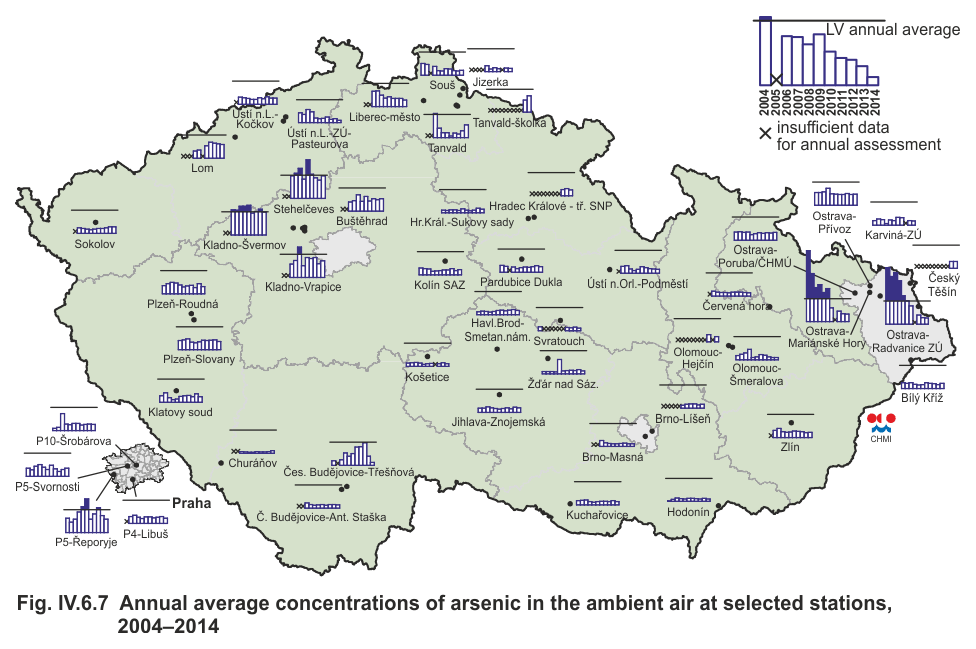
Fig. IV.6.7
|
Annual average concentrations of arsenic in the
ambient air at selected stations, 2004–2014 |
|
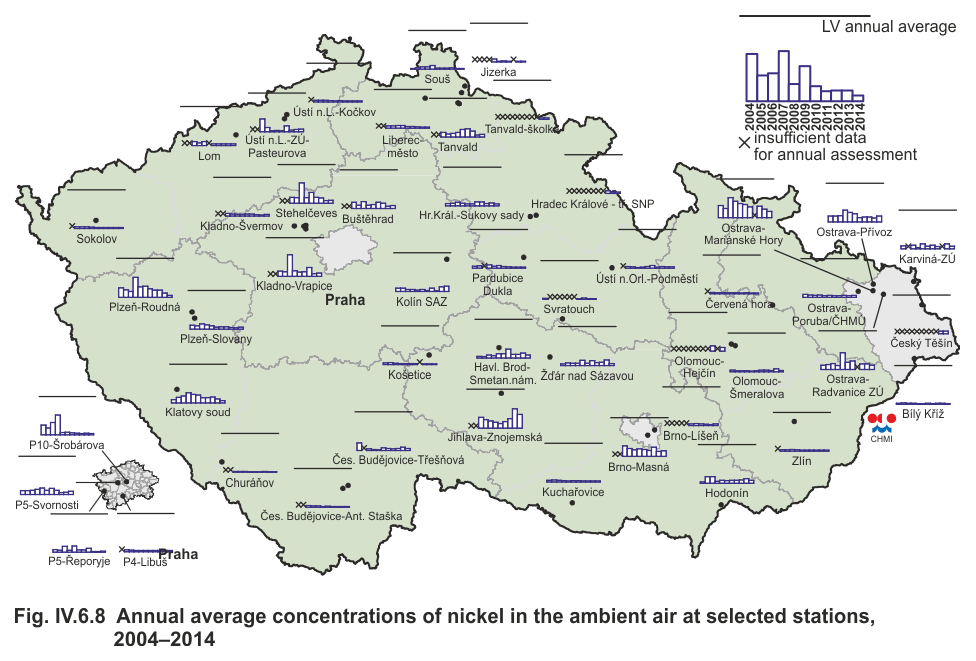
Fig. IV.6.8 |
Annual average concentrations of nickel in the
ambient air at selected stations, 2004–2014 |
|
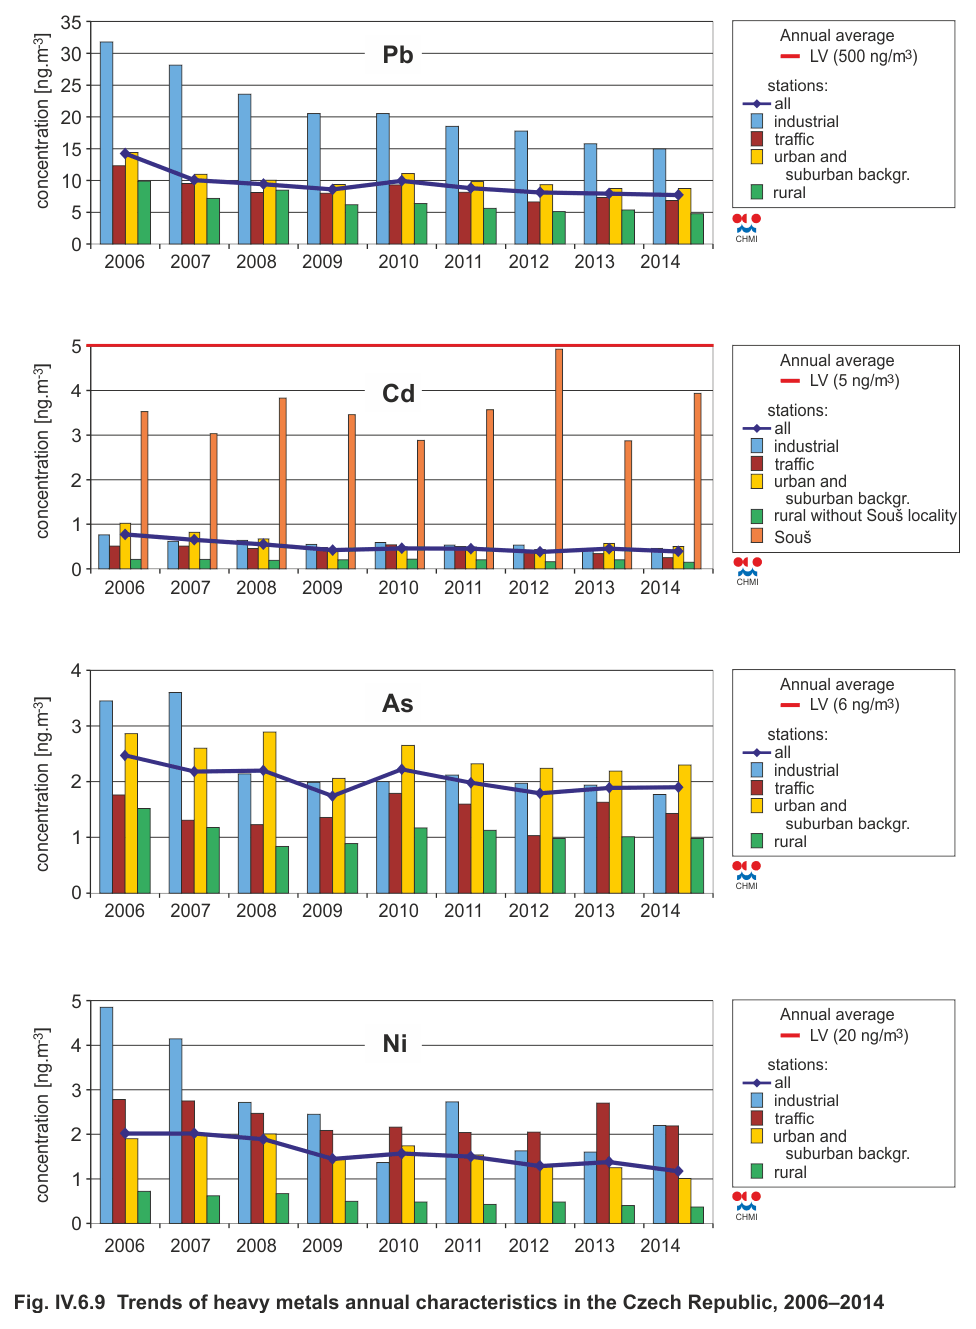
Fig. IV.6.9 |
Trends of heavy metals annual characteristics in the
Czech Republic, 2006–2014 |
|
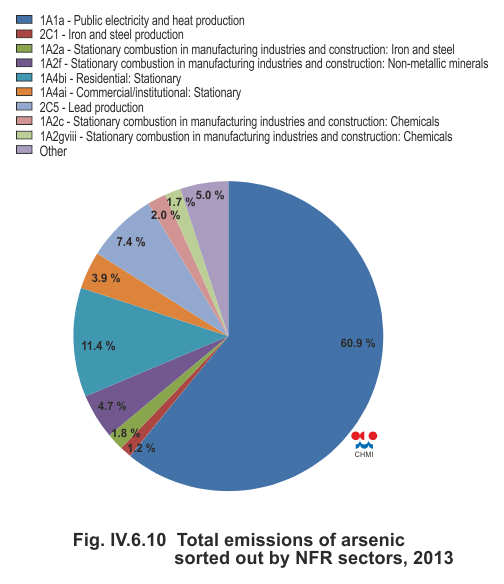
Fig. IV.6.10
|
Total emissions of arsenic sorted out by NFR sectors,
2013 |
|
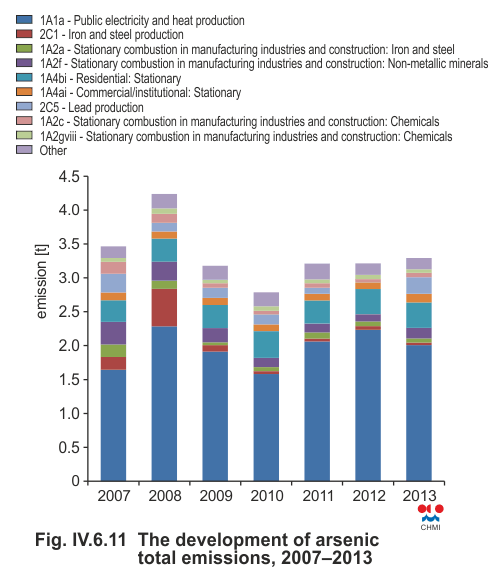
Fig. IV.6.11 |
The development of arsenic total emissions,
2007–2013 |
|
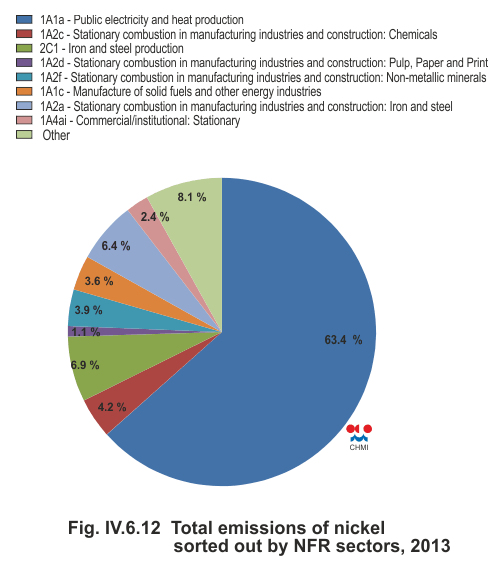
Fig. IV.6.12
|
Total emissions of nickel sorted out by NFR sectors,
2013 |
|
Fig. IV.6.13
|
The development of nickel total emissions, 2007–2013 |
|
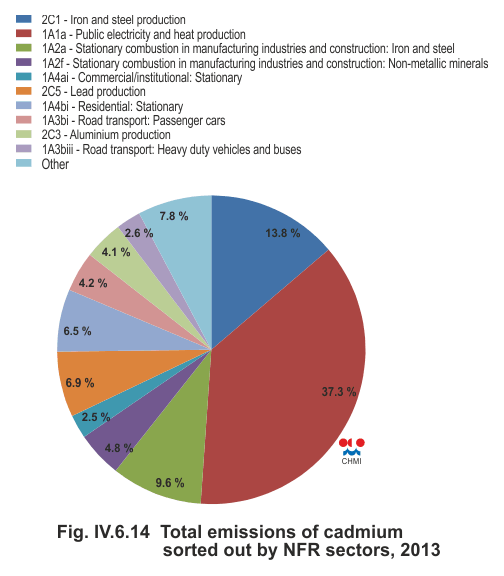
Fig. IV.6.14
|
Total emissions of cadmium sorted out by NFR sectors,
2013 |
|
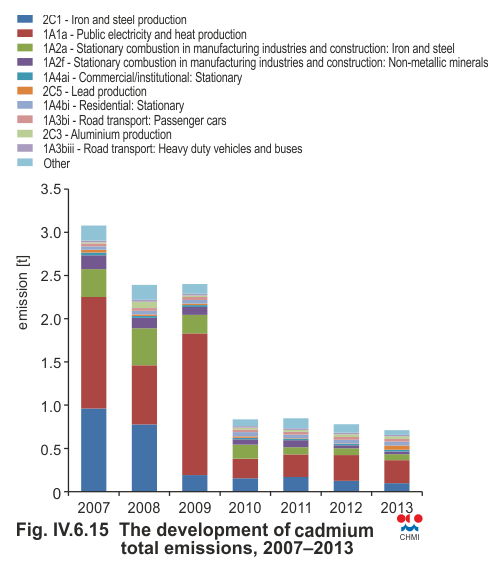
Fig. IV.6.15
|
The development of cadmium total emissions,
2007–2013 |
|
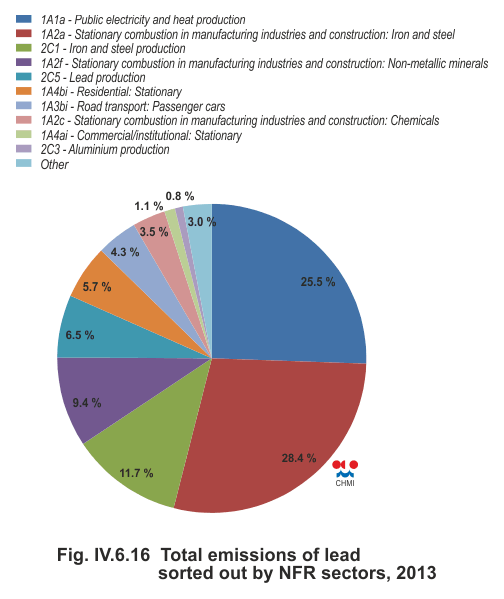
Fig. IV.6.16
|
Total emissions of lead sorted out by NFR sectors,
2013 |
|
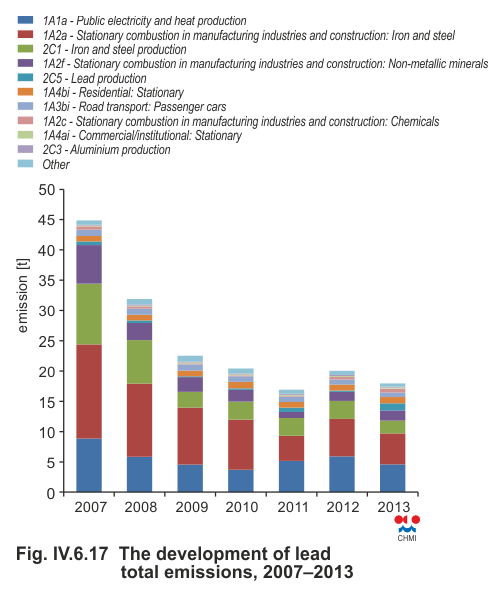
Fig. IV.6.17 |
The development of lead total emissions, 2007–2013 |
|
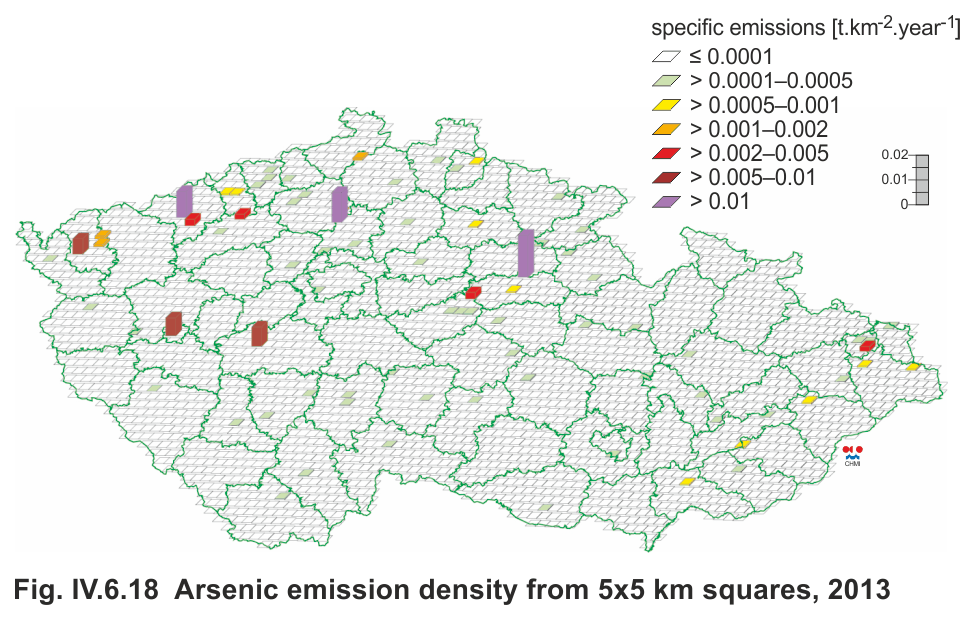
Fig. IV.6.18 |
Arsenic emission density from 5x5 km squares, 2013 |
|
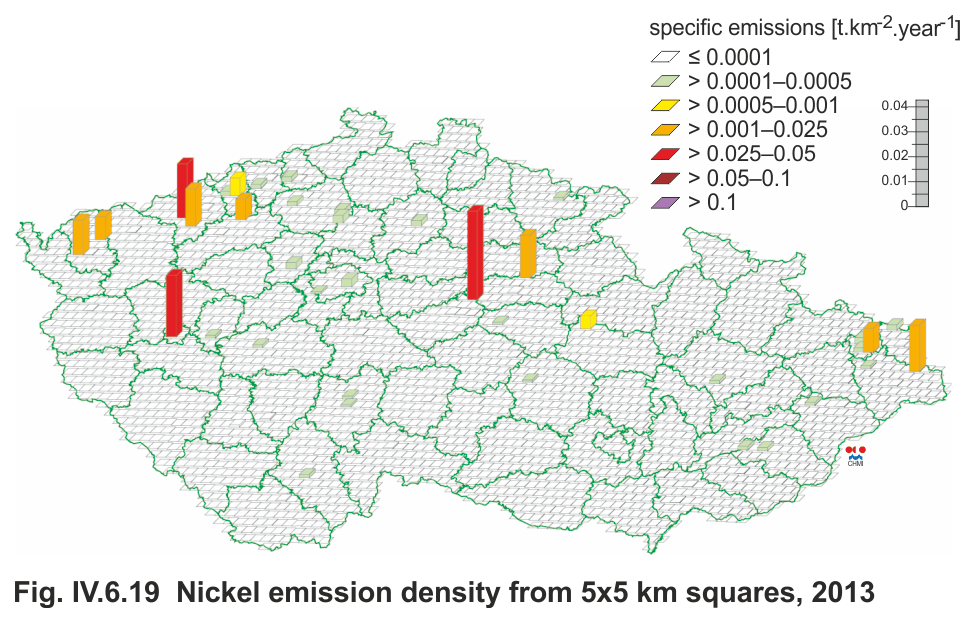
Fig. IV.6.19 |
Nickel emission density from 5x5 km squares, 2013 |
|
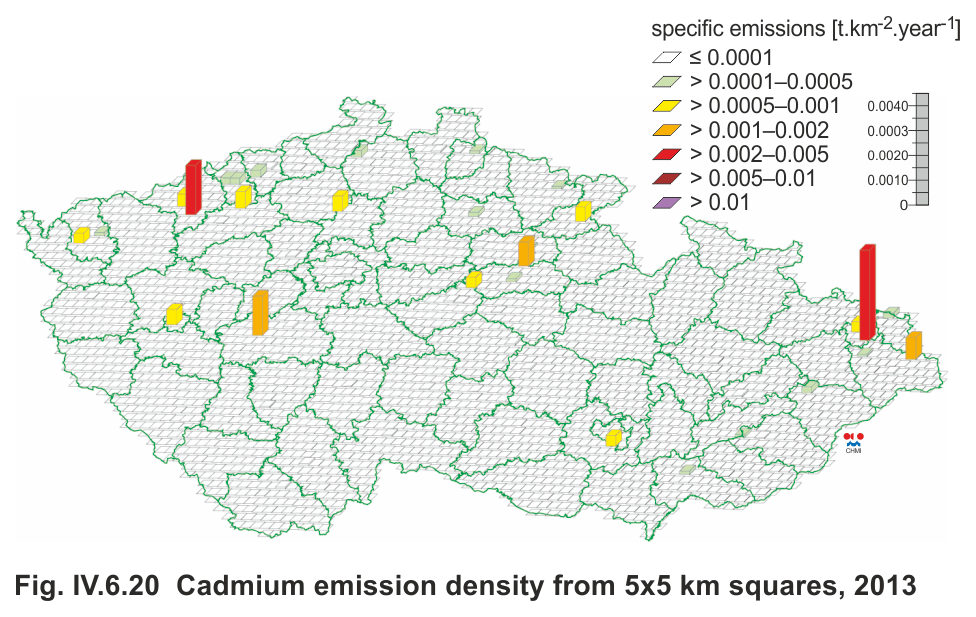
Fig. IV.6.20 |
Cadmium emission density from 5x5 km squares, 2013 |
|
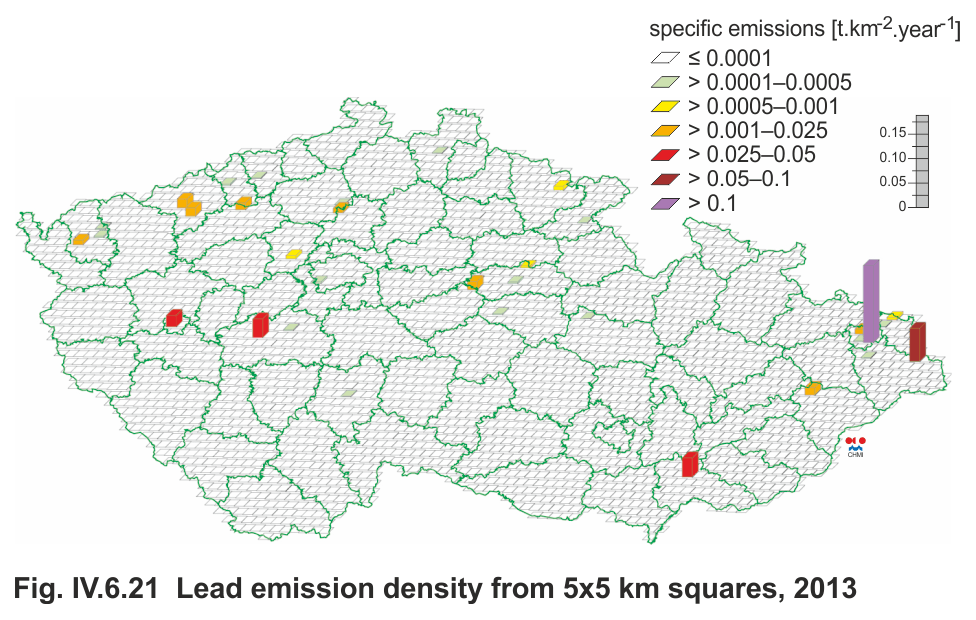
Fig.
IV.6.21 |
Lead emission density from 5x5 km squares, 2013 |
|
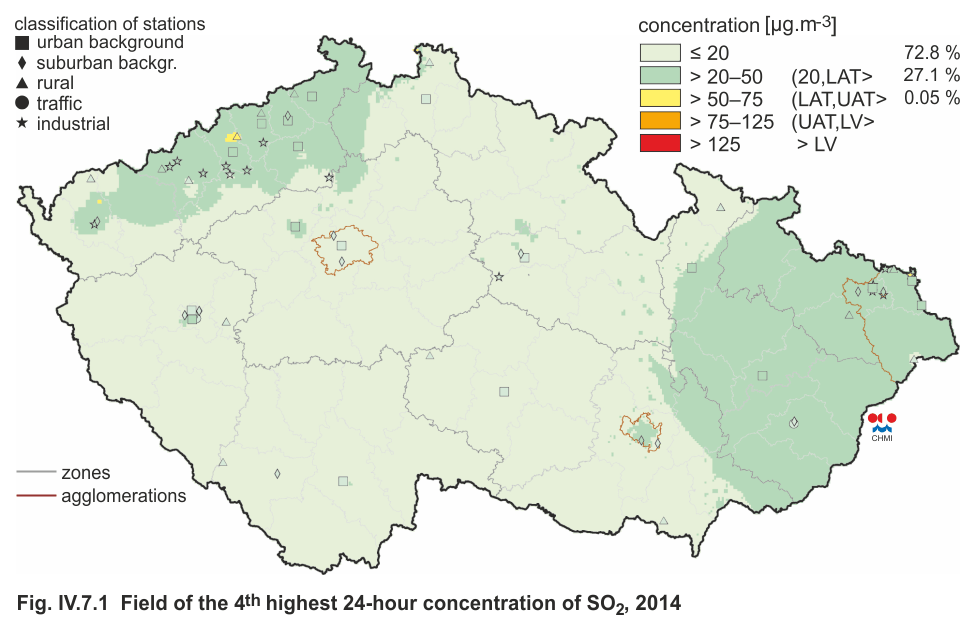
Fig. IV.7.1 |
Field of the 4th highest 24-hour concentration of
SO2, 2014 |
|
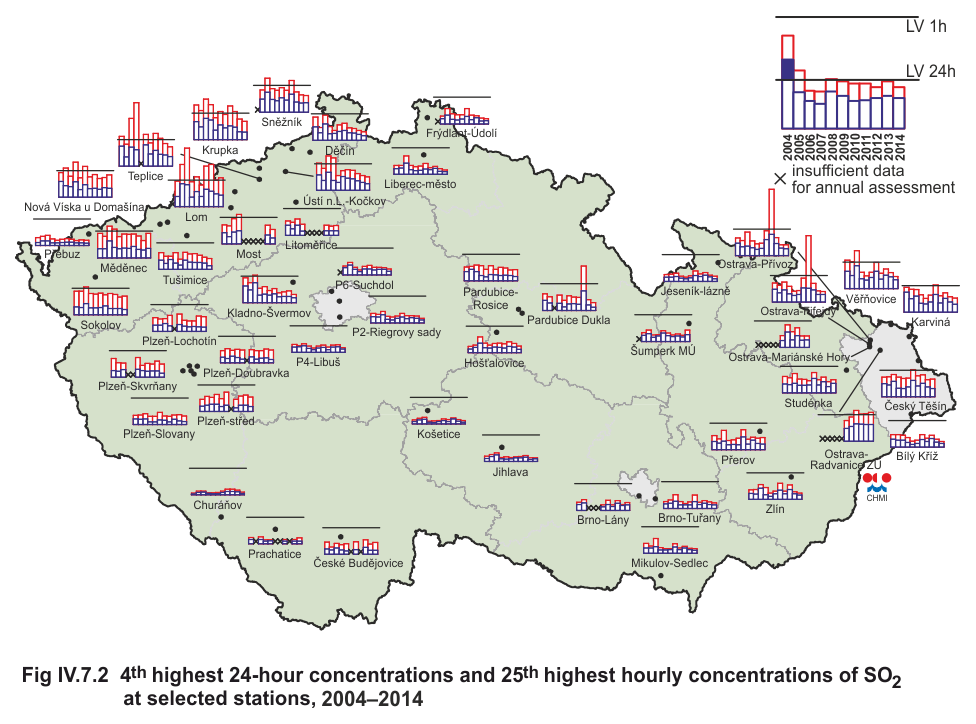
Fig. IV.7.2 |
4th highest 24-hour concentrations and 25th highest hourly concentrations of SO2 at selected stations,
2004–2014 |
|
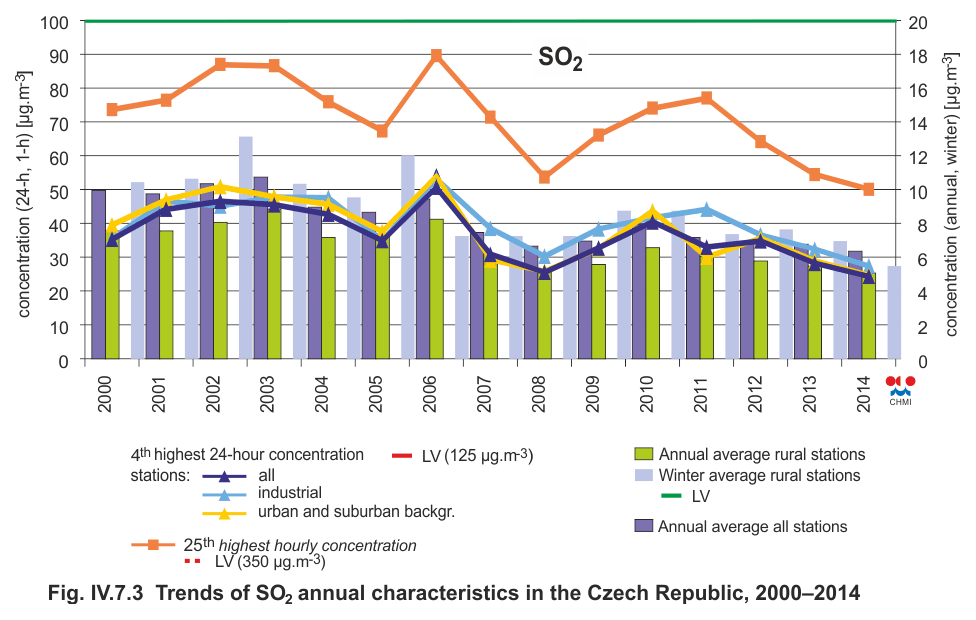
Fig. IV.7.3 |
Trends of SO2 annual characteristics in the Czech
Republic, 2000–2014 |
|
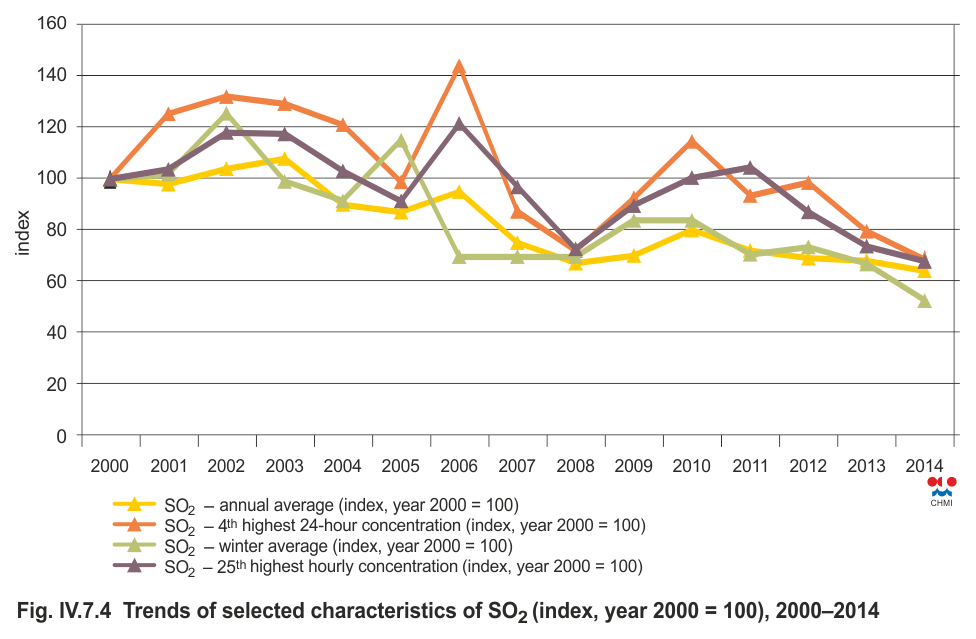
Fig. IV.7.4
|
Trends of selected characteristics of SO2 (index,
year 2000 = 100), 2000–2014 |
|
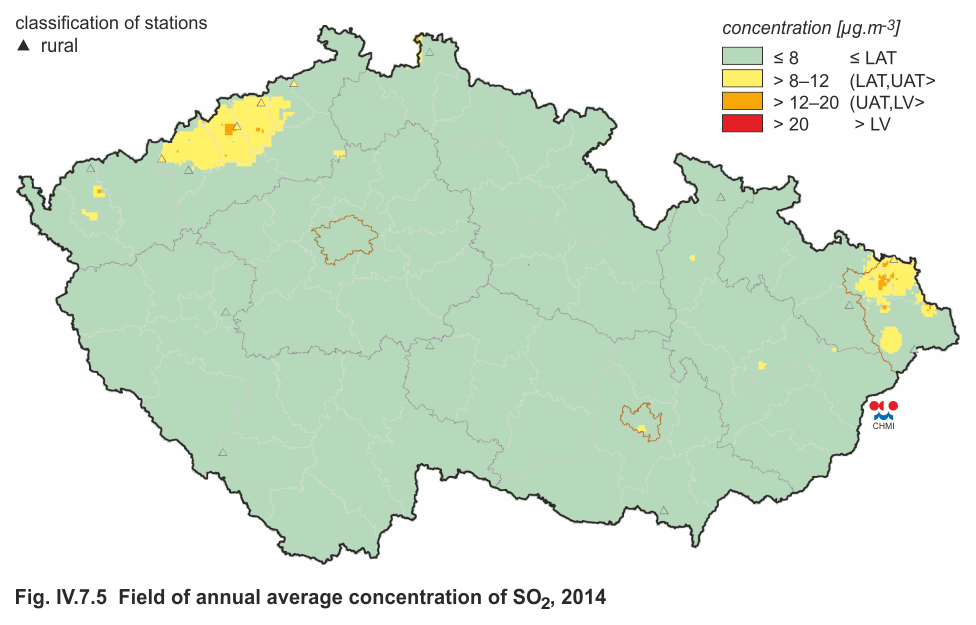
Fig. IV.7.5 |
Field of annual average concentration of SO2, 2014 |
|
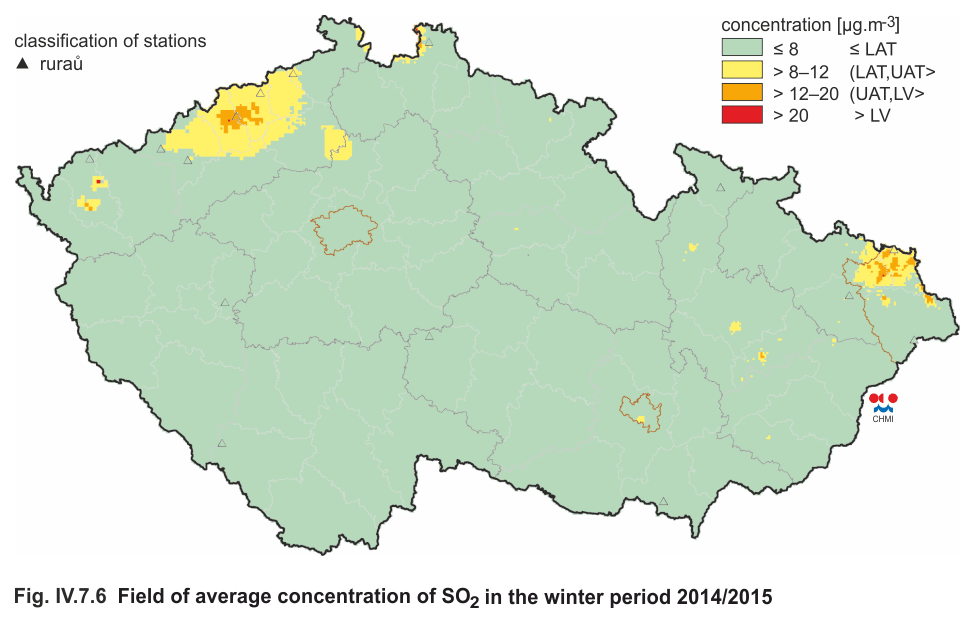
Fig. IV.7.6 |
Field of average concentration of SO2 in the winter
period 2014/2015 |
|
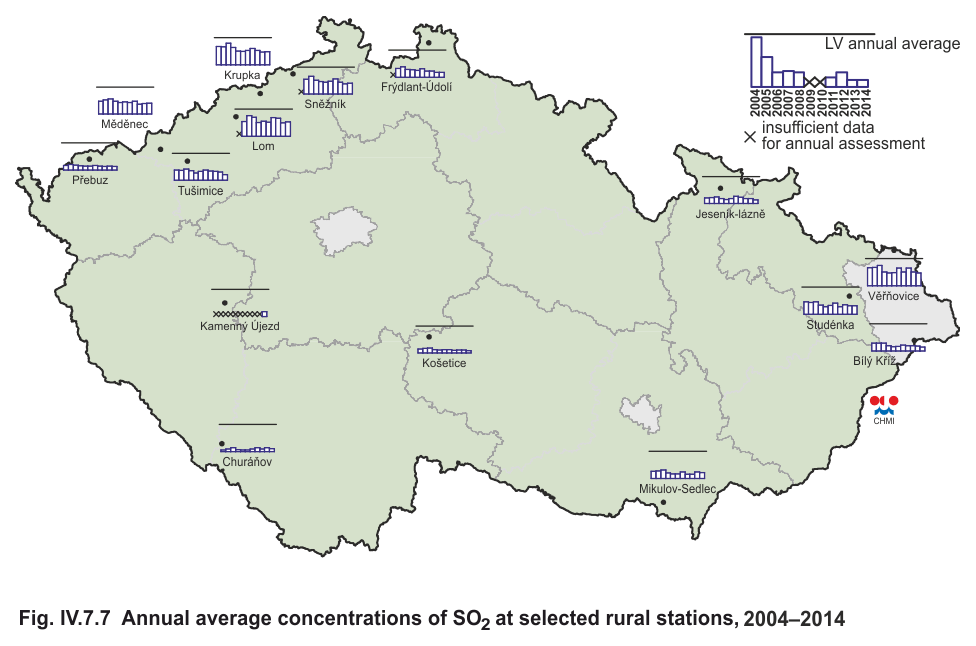
Fig. IV.7.7 |
Annual average concentrations of SO2 at selected
rural stations, 2004–2014 |
|
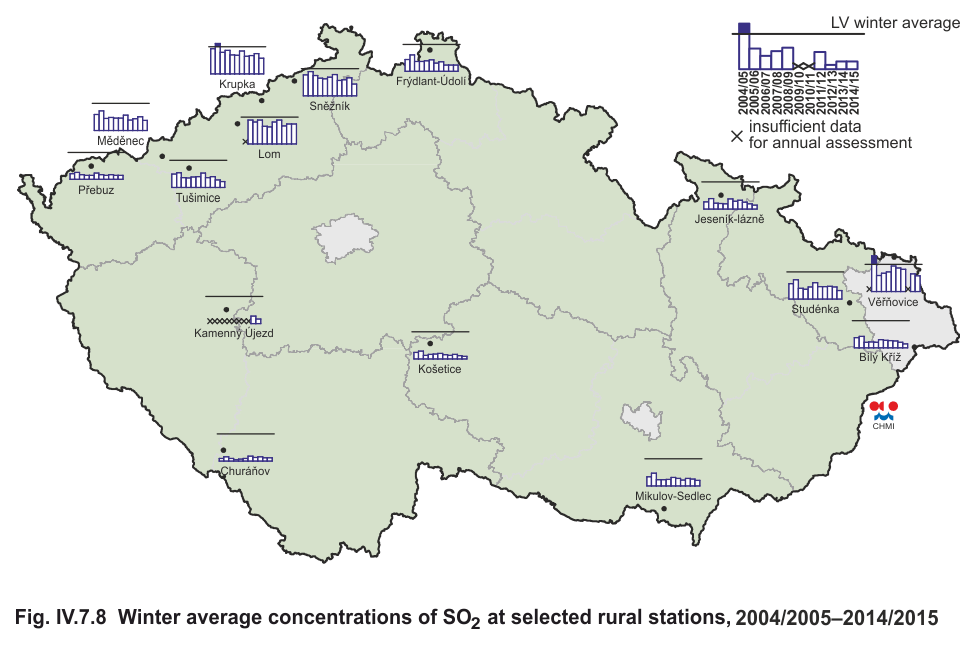
Fig. IV.7.8 |
Winter average concentrations of SO2 at selected
rural stations, 2004/2005–2014/2015 |
|
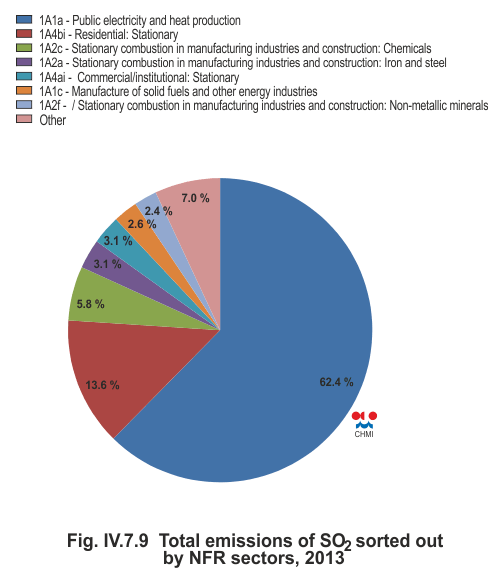
Fig. IV.7.9 |
Total emissions of SO2 sorted out by NFR sectors,
2013 |
|
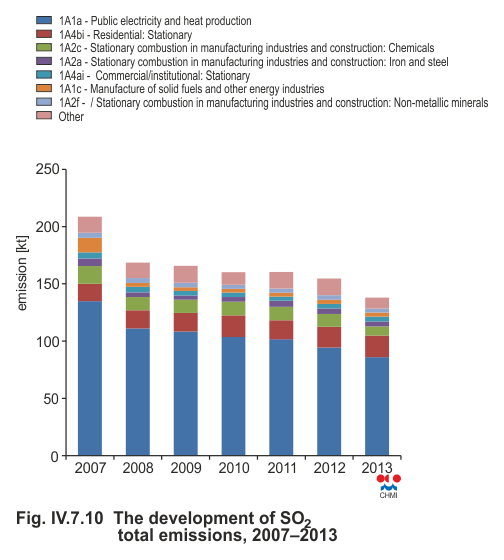
Fig. IV.7.10 |
The development of SO2 total emissions, 2007–2013 |
|
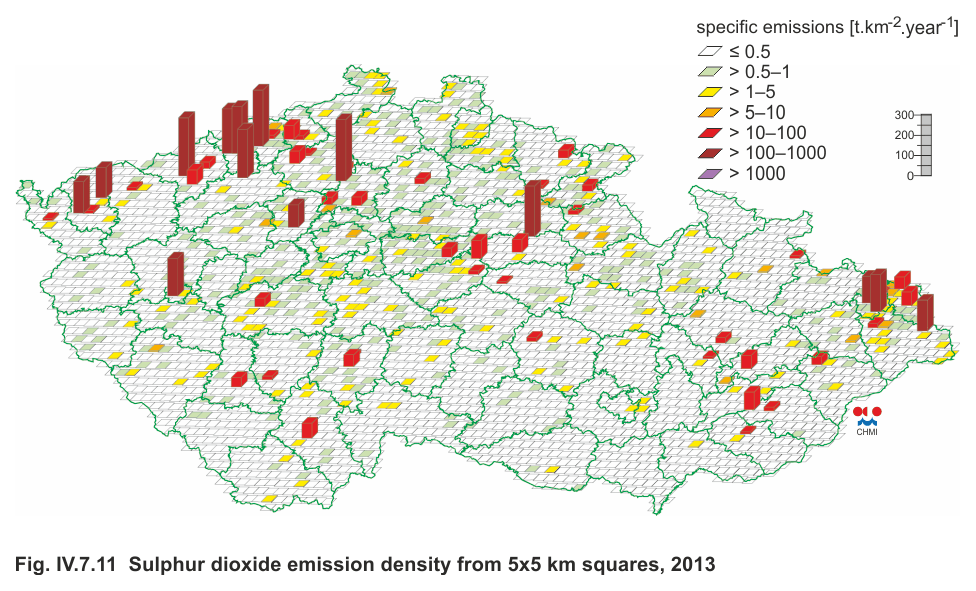
Fig. IV.7.11 |
Sulphur dioxide emission density from 5x5 km squares,
2013 |
|
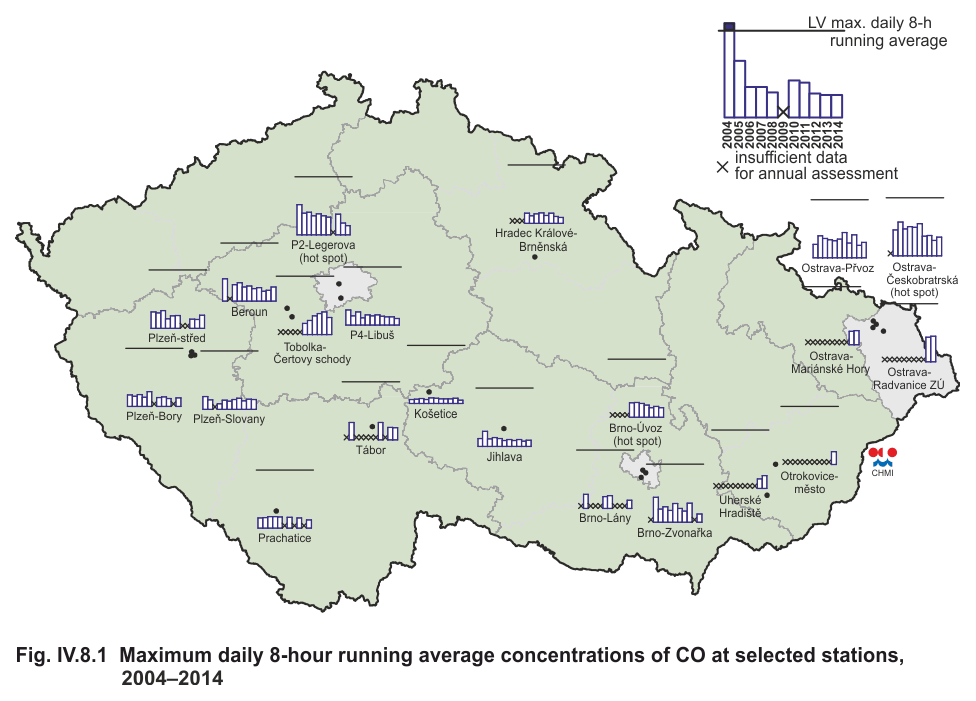
Fig. IV.8.1 |
Maximum daily 8-hour running average concentrations
of CO at selected stations, 2004–2014 |
|
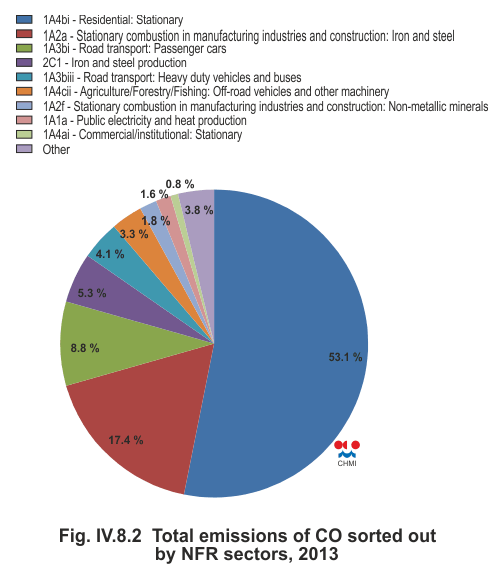
Fig. IV.8.2 |
Total emissions of CO sorted out by NFR sectors,
2013 |
|
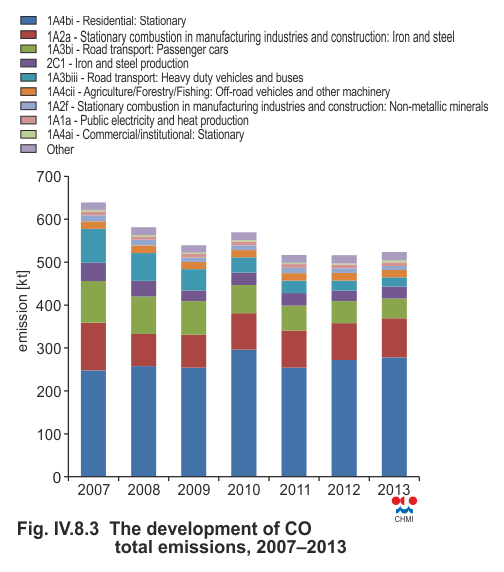
Fig. IV.8.3 |
The development of CO total emissions, 2007–2013 |
|
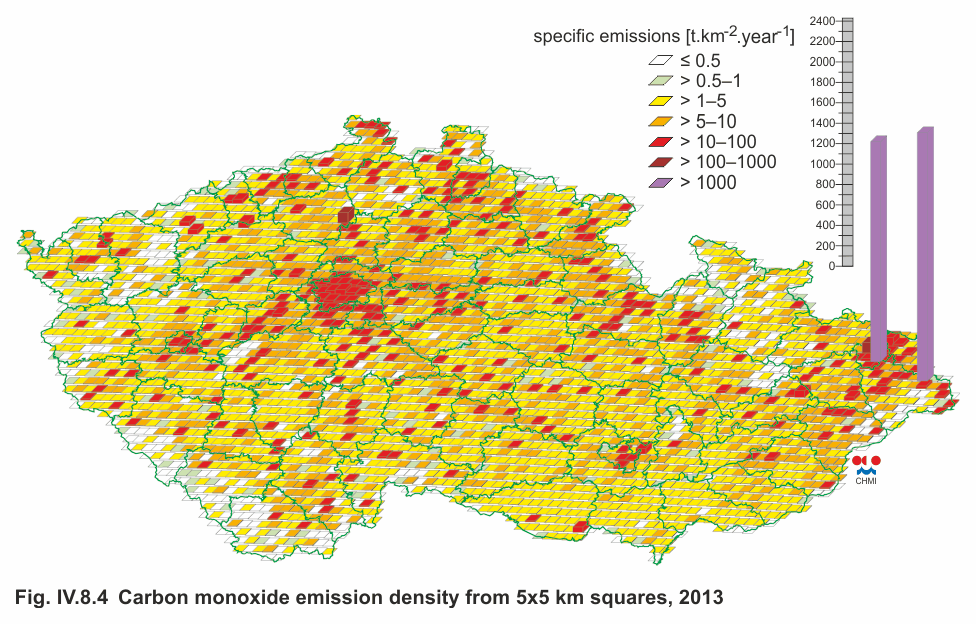
Fig. IV.8.4 |
Carbon moNOx ide emission density from 5x5 km squares,
2013 |
|
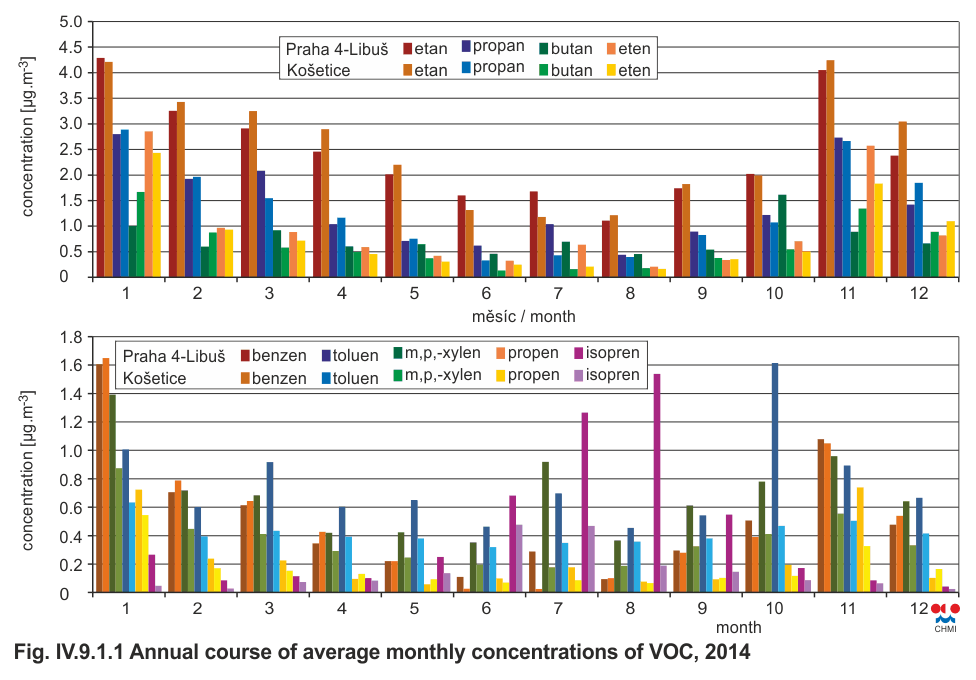
Fig. IV.9.1.1 |
Annual course of average monthly concentrations of
VOC, 2014 |
|
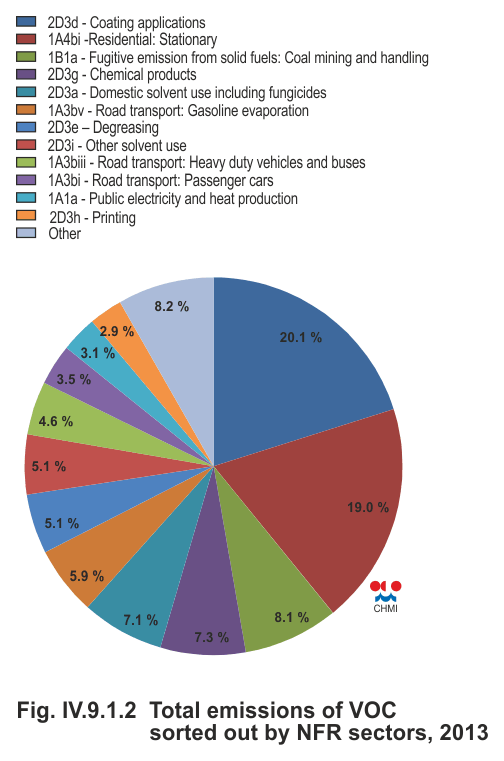
Fig. IV.9.1.2 |
Total emissions of VOC sorted out by NFR sectors,
2013 |
|
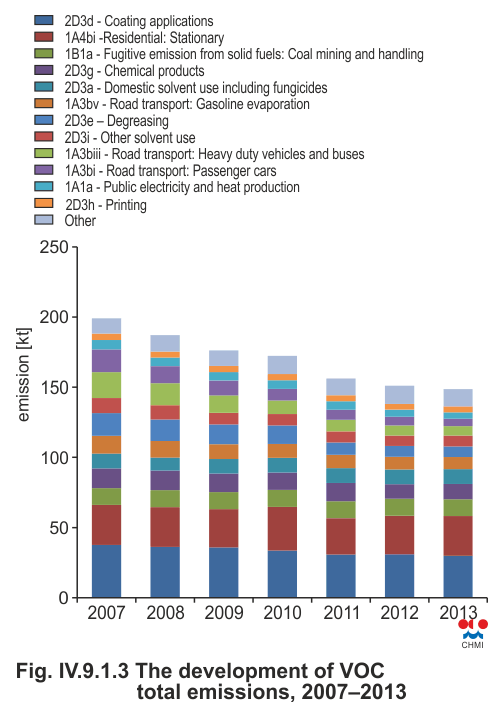
Fig. IV.9.1.3
|
The development of VOC total emissions, 2007–2013 |
|
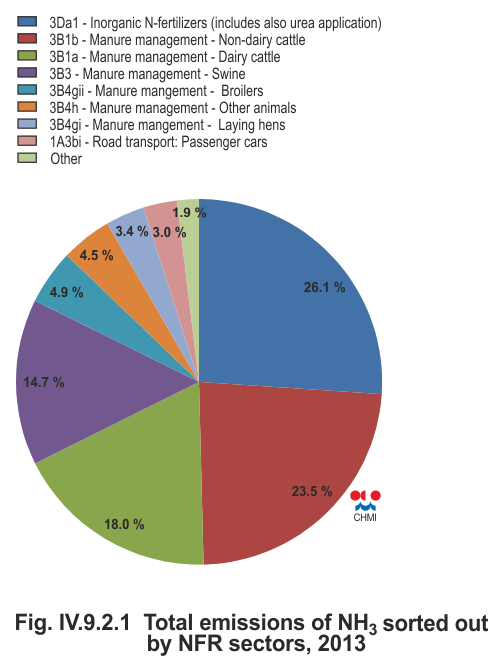
Fig. IV.9.2.1 |
Total emissions of NH3 sorted out by NFR sectors,
2013 |
|
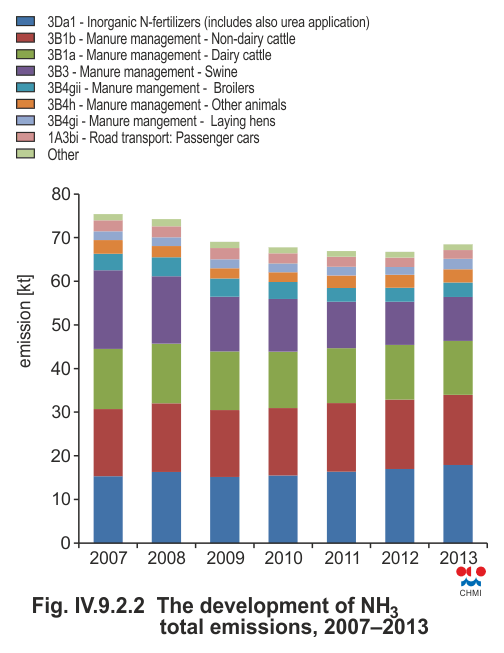
Fig. IV.9.2.2 |
The development of NH3 total emissions, 2007–2013 |
|
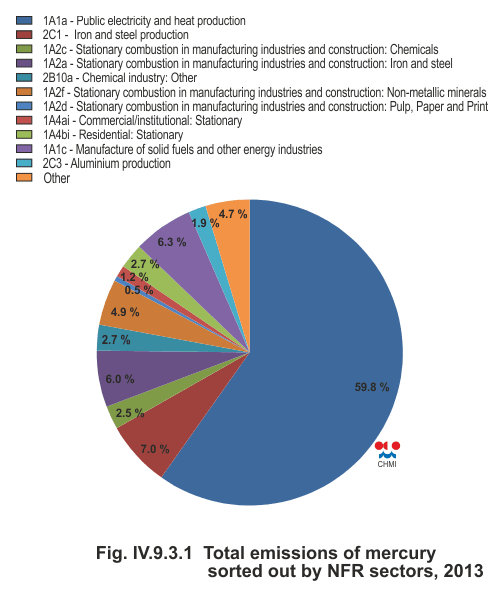
Fig. IV.9.3.1 |
Total emissions of mercury sorted out by NFR sectors,
2013 |
|
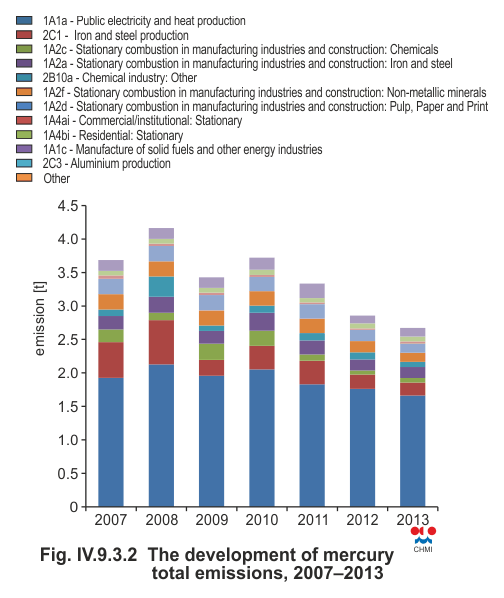
Fig. IV.9.3.2 |
The development of mercury total emissions,
2007–2013 |
|
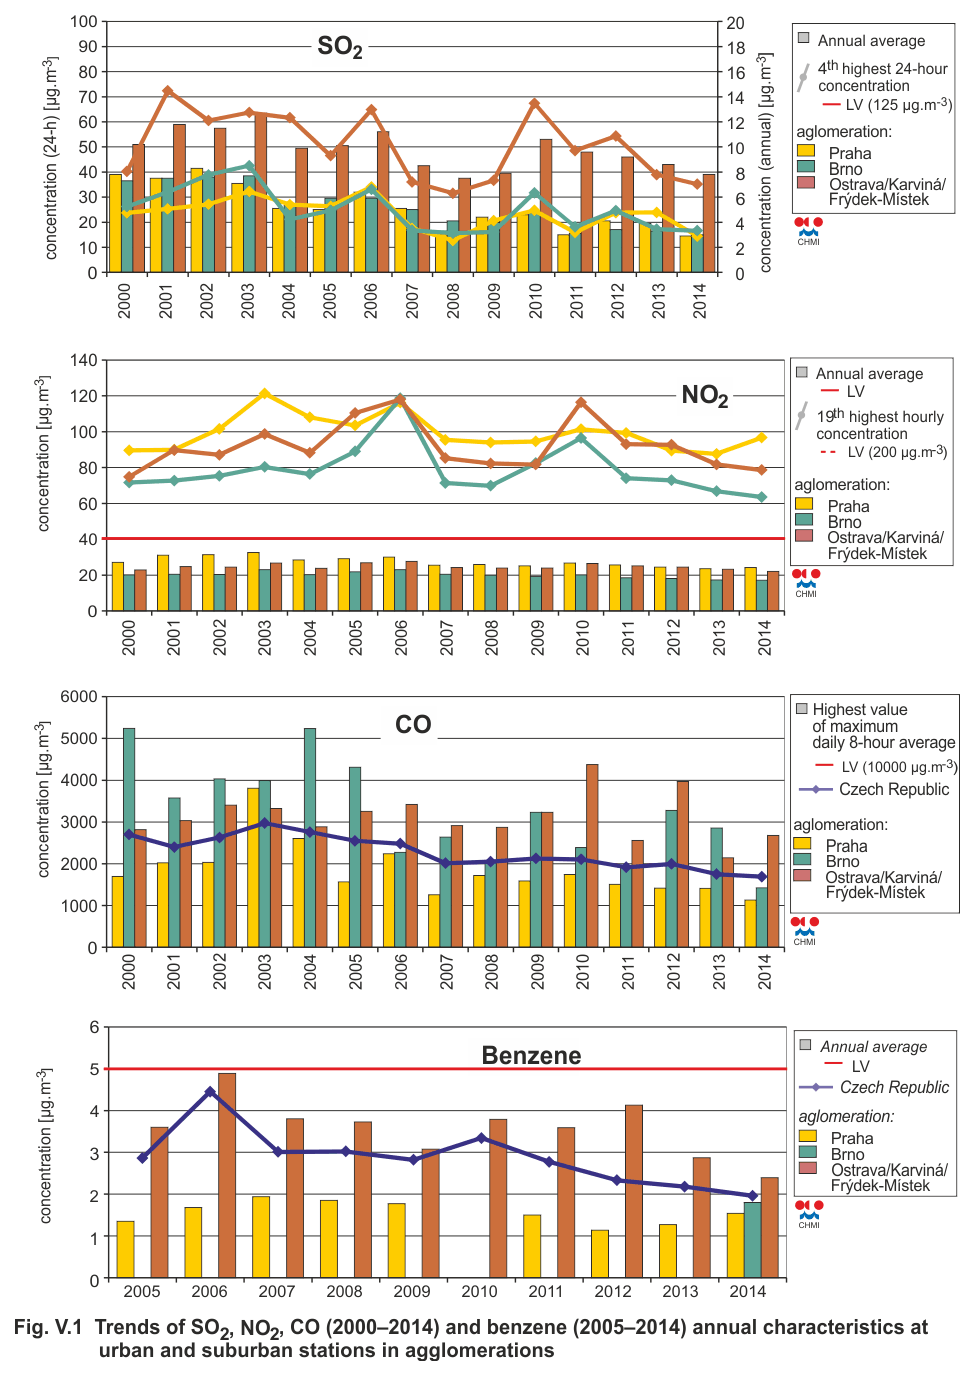
Fig. V.1
|
Trends of SO2, NO2, CO (2000–2014) and benzene
(2005–2014) annual characteristics at urban and suburban
stations in agglomerations |
|
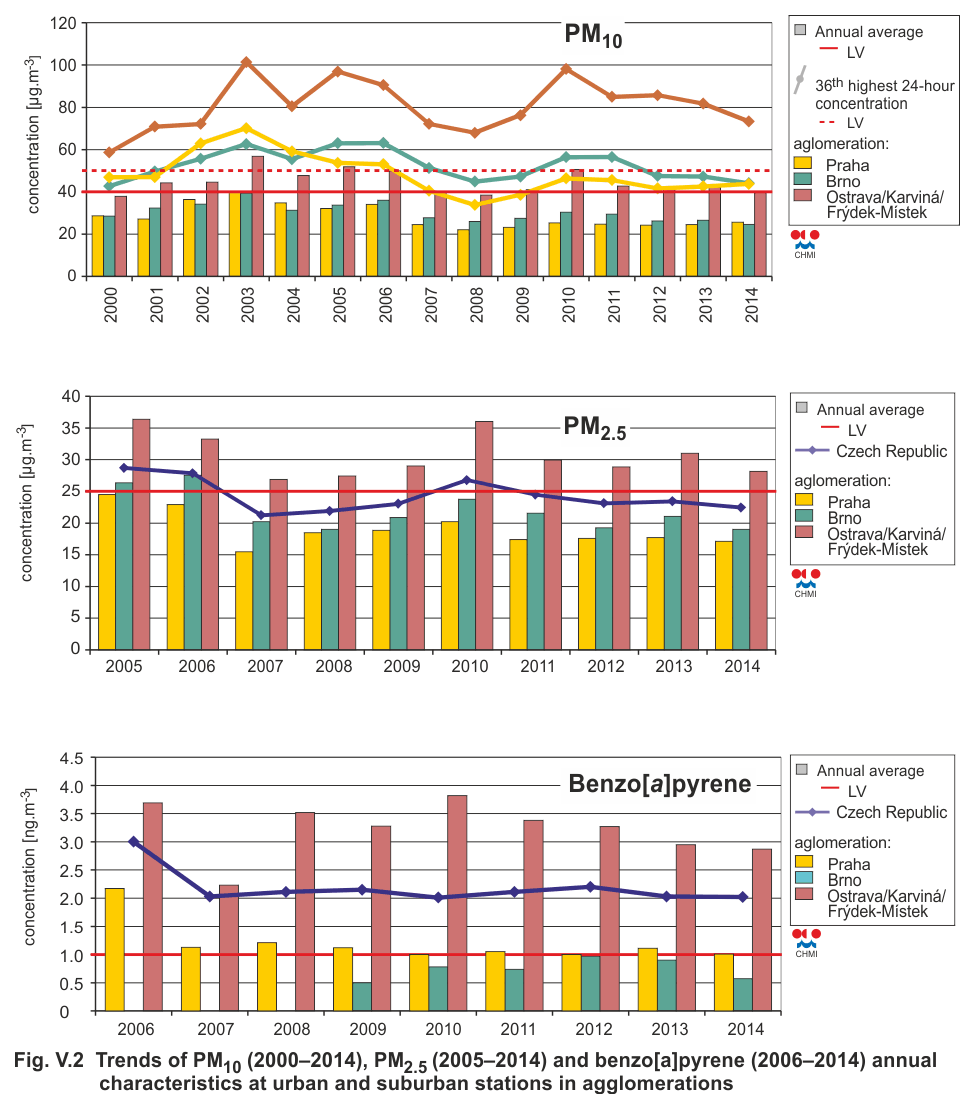
Fig. V.2 |
Trends of PM10 (2000–2014), PM2.5 (2005–2014) and
benzo[a]pyrene (2006–2014) annual characteristics at
urban and suburban stations in agglomerations |
|
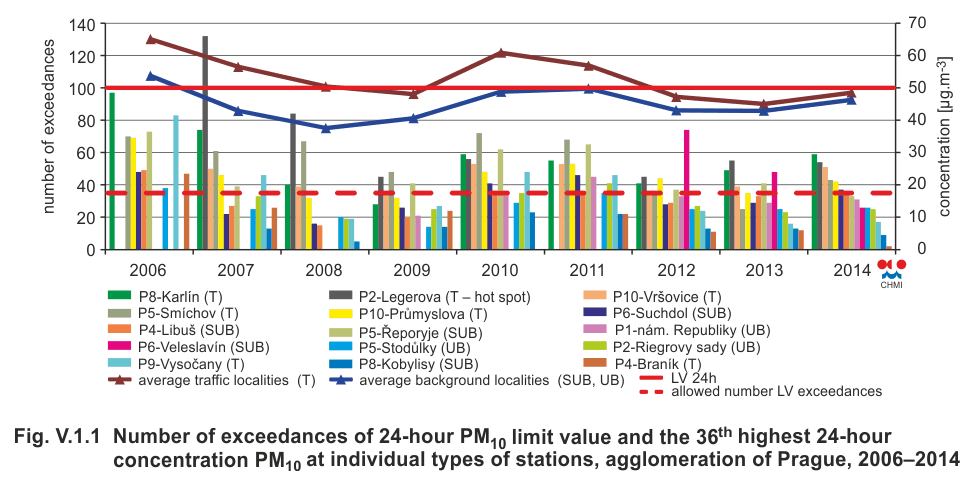
Fig. V.1.1 |
Number of exceedances of 24-hour PM10 limit value
and the 36th highest 24-hour concentration PM10 at
individual types of stations, agglomeration of Prague,
2006–2014 |
|
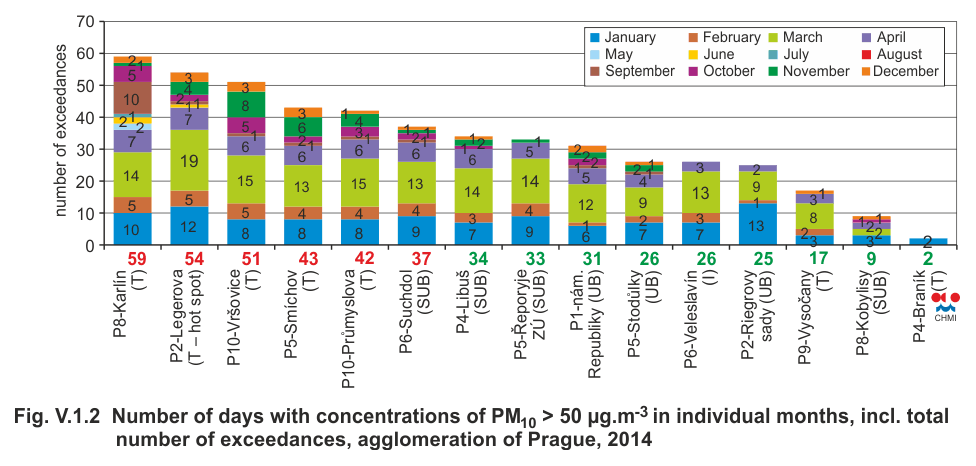
Fig. V.1.2 |
Number of days with concentrations of PM10 > 50
µg.m-3 in individual months, incl. total number of
exceedances, agglomeration of Prague, 2014 |
|
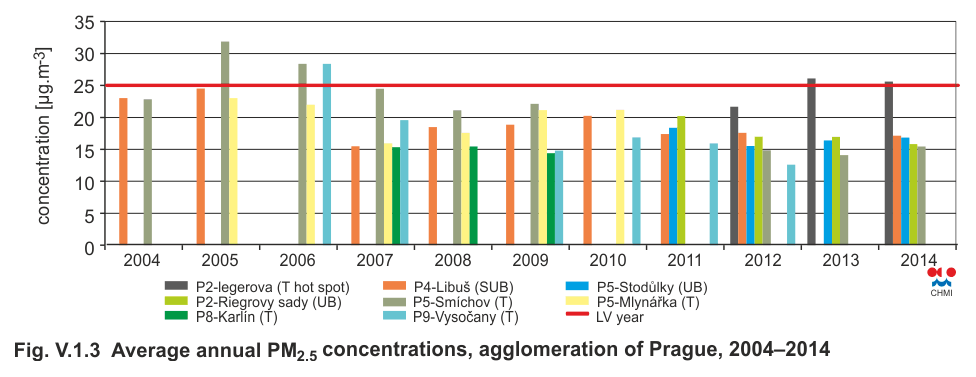
Fig. V.1.3 |
Average annual PM2.5 concentrations, agglomeration
of Prague, 2004–2014 |
|
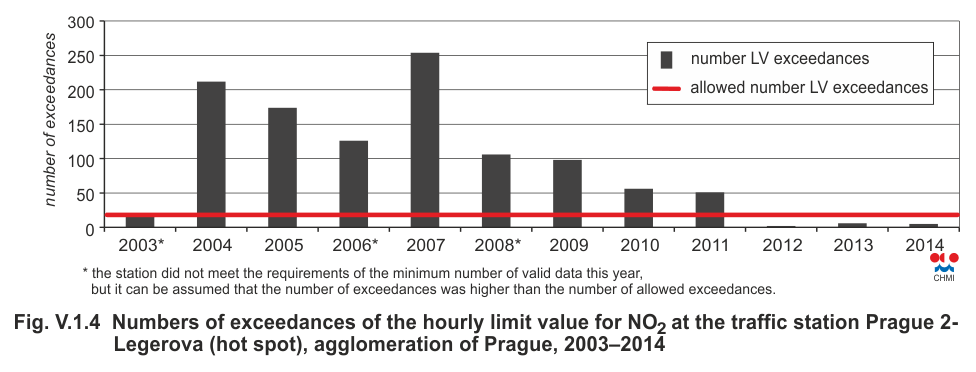
Fig. V.1.4
|
Numbers of exceedances of the hourly limit value for
NO2 at the traffic station Prague 2-Legerova (hot spot),
agglomeration of Prague, 2003–2014 |
|
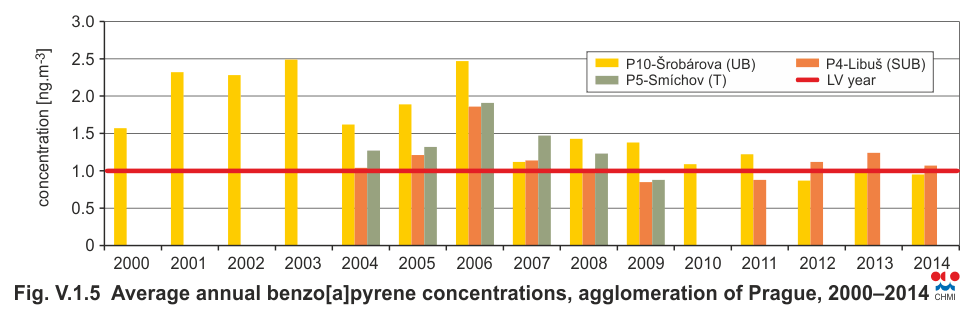
Fig. V.1.5 |
Average annual benzo[a]pyrene concentrations,
agglomeration of Prague, 2000–2014 |
|
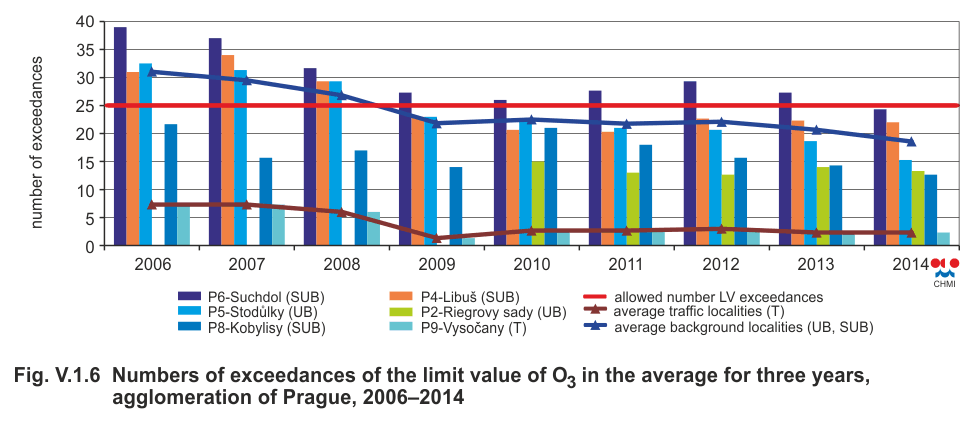
Fig. V.1.6
|
Numbers of exceedances of the limit value of O3 in
the average for three years, agglomeration of Prague,
2006–2014 |
|
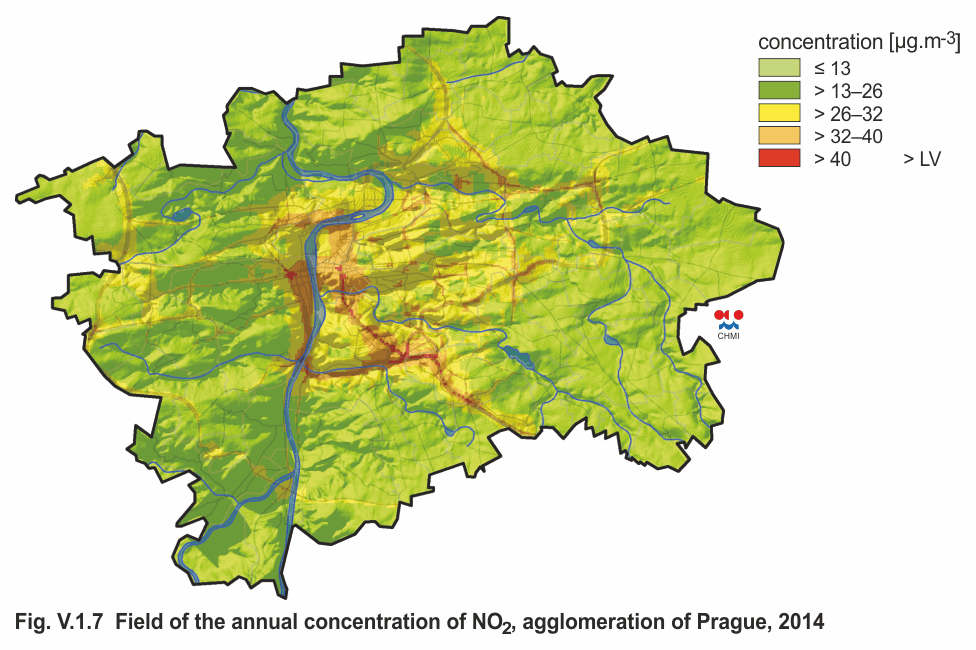
Fig. V.1.7
|
Field of the annual concentration of NO2,
agglomeration of Prague, 2014 |
|
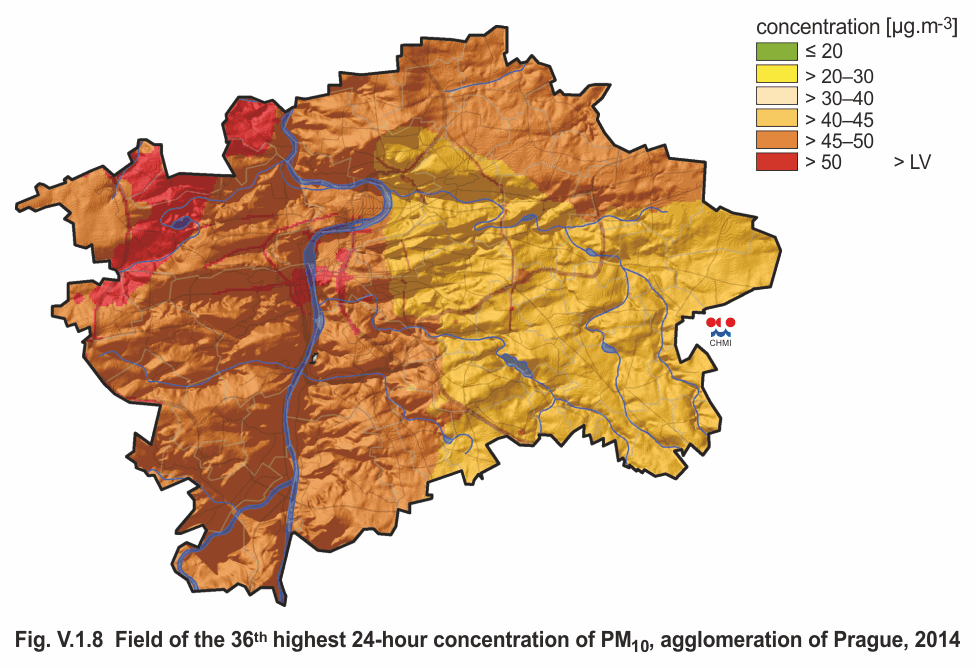
Fig. V.1.8 |
Field of the 36th highest 24-hour concentration of
PM10, agglomeration of Prague, 2014 |
|
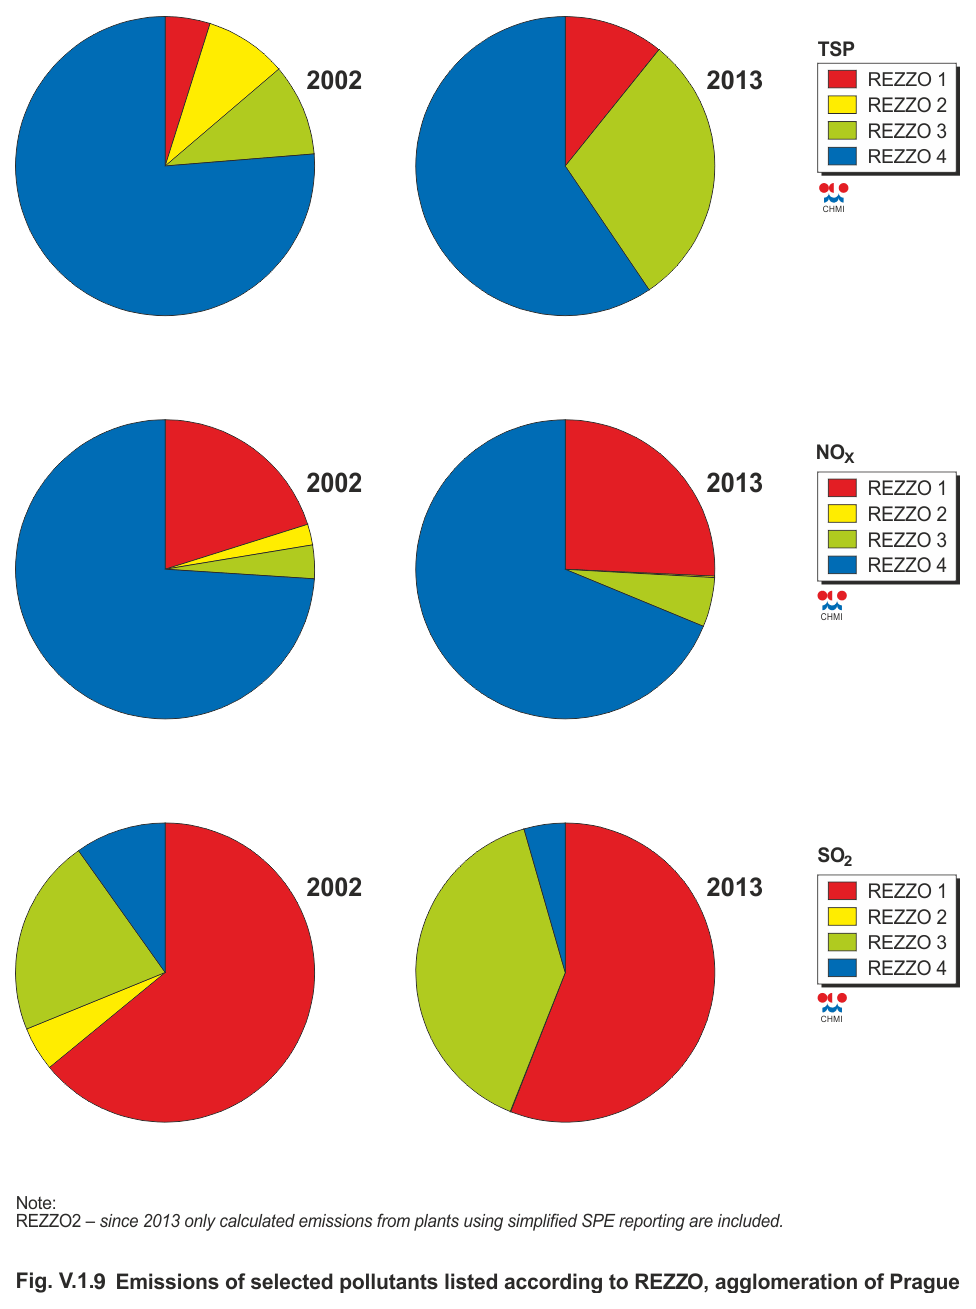
Fig. V.1.9 |
Emissions of selected pollutants listed according to
REZZO, agglomeration of Prague |
|
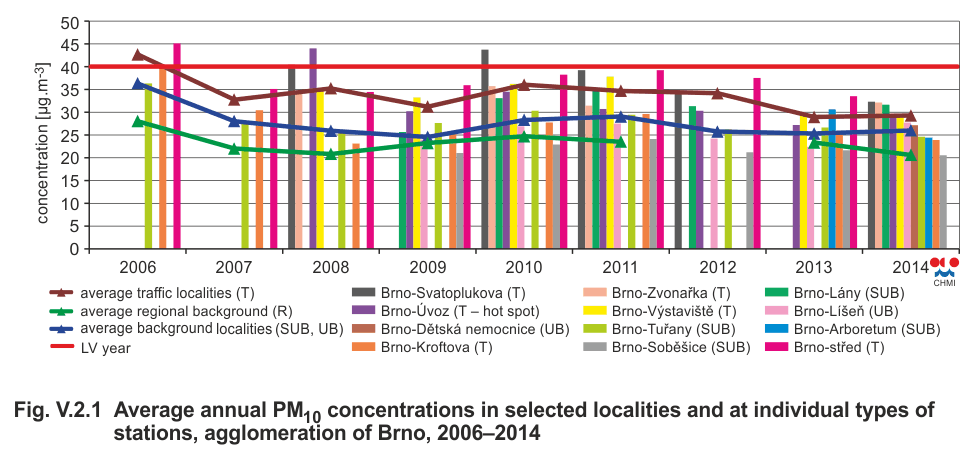
Fig. V.2.1 |
Average annual PM10 concentrations in selected
localities and at individual types of stations,
agglomeration of Brno, 2006–2014 |
|
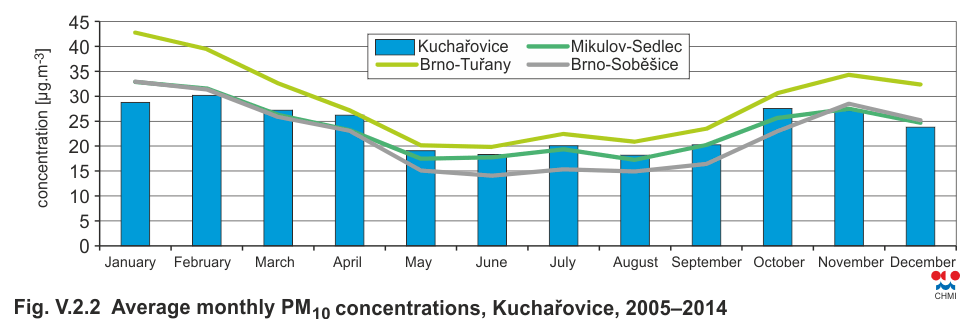
Fig. V.2.2 |
Average monthly PM10 concentrations, Kuchařovice,
2005–2014 |
|
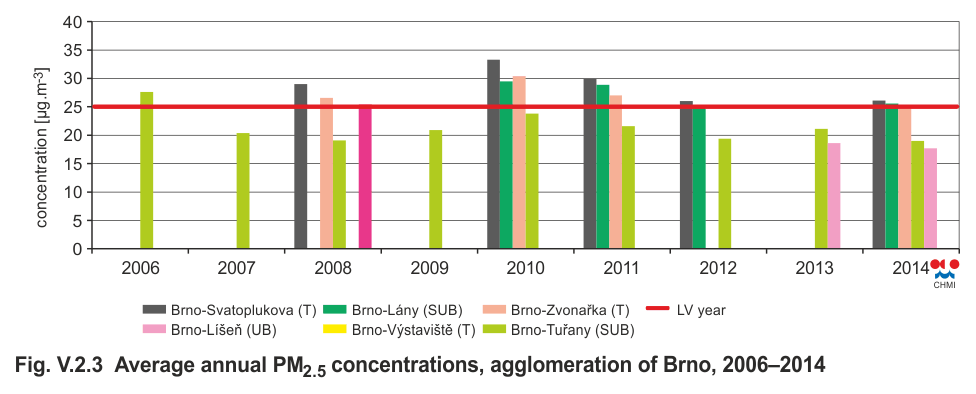
Fig. V.2.3
|
Average annual PM2.5 concentrations, agglomeration
of Brno, 2006–2014 |
|
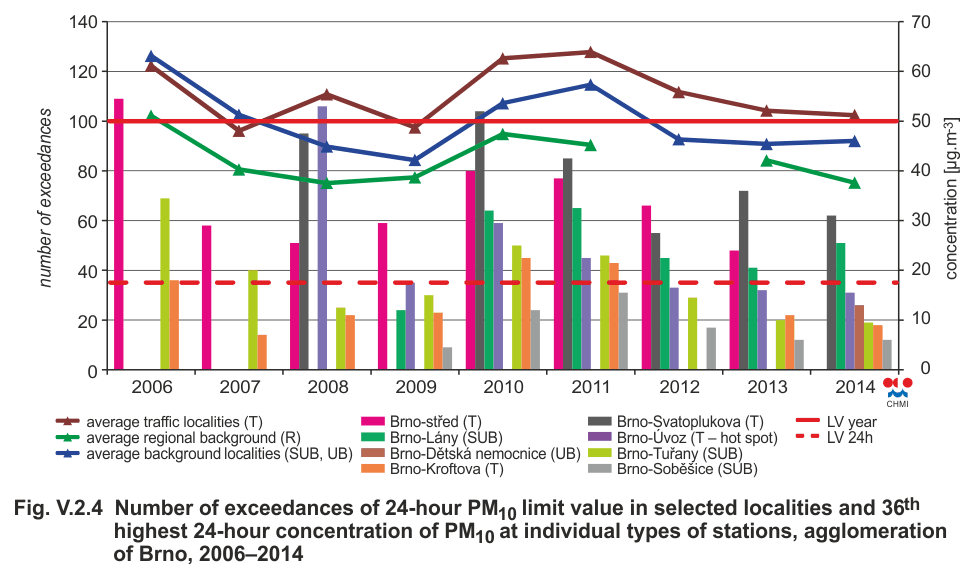
Fig. V.2.4 |
Number of exceedances of 24-hour PM10 limit value in
selected localities and 36th highest 24-hour
concentration of PM10 at individual types of stations,
agglomeration of Brno, 2006–2014 |
|
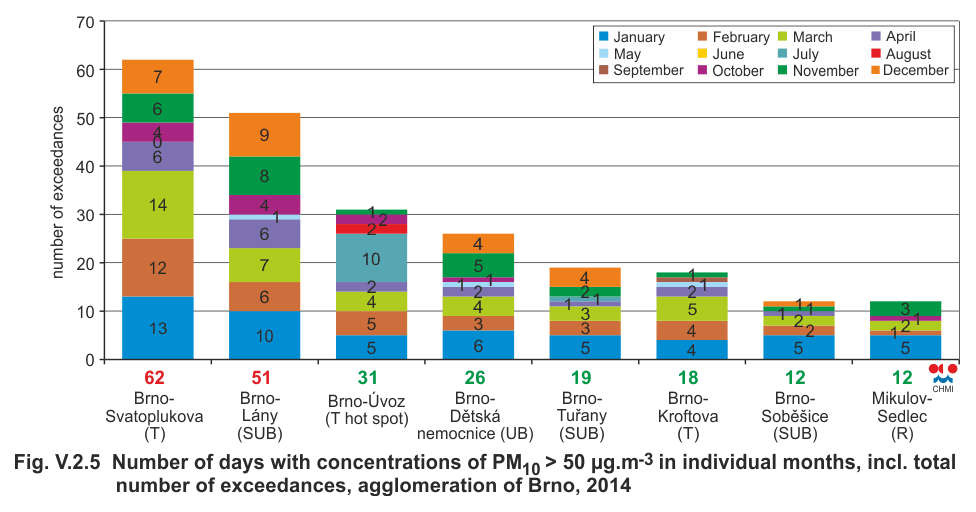
Fig. V.2.5
|
Number of days with concentrations of PM10 > 50
µg.m-3 in individual months, incl. total number of
exceedances, agglomeration of Brno, 2014 |
|
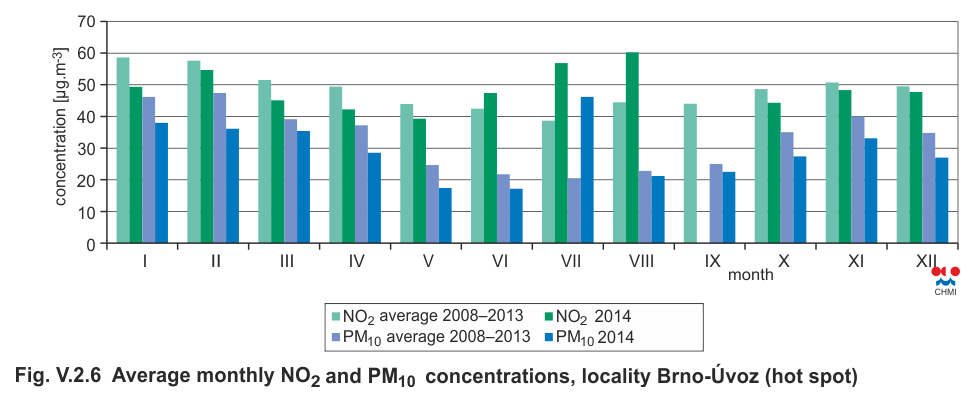
Fig. V.2.6 |
Average monthly NO2 and PM10 concentrations,
locality Brno-Úvoz (hot spot) |
|
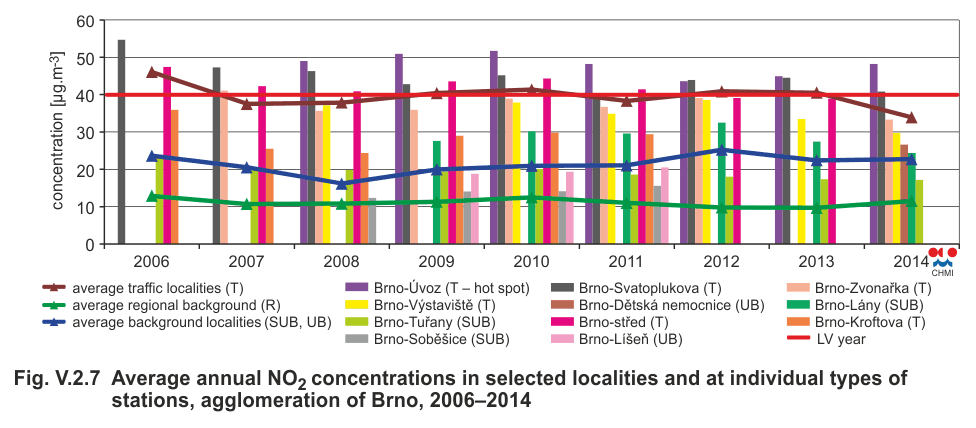
Fig. V.2.7
|
Average annual NO2 concentrations in selected
localities and at individual types of stations,
agglomeration of Brno, 2006–2014 |
|
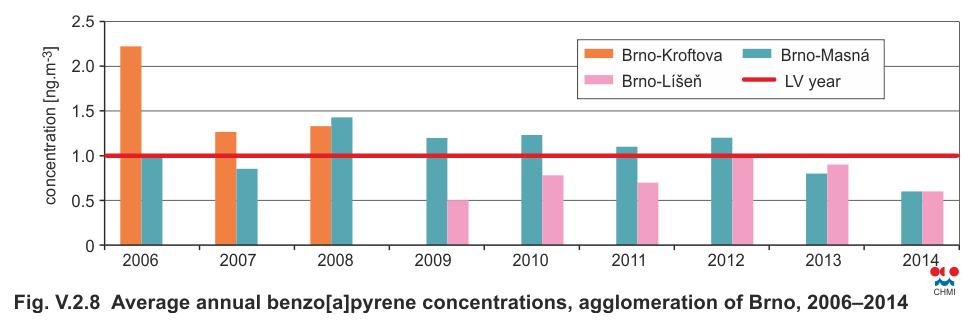
Fig. V.2.8 |
Average annual benzo[a]pyrene concentrations,
agglomeration of Brno, 2006–2014 |
|
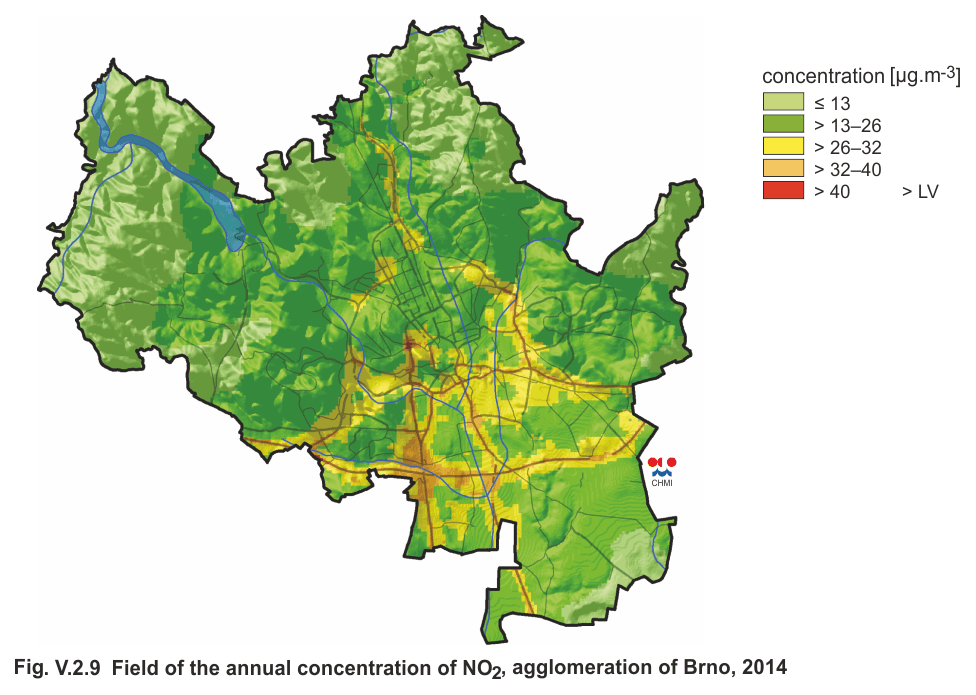
Fig. V.2.9 |
Field of the annual concentration of NO2,
agglomeration of Brno, 2014 |
|
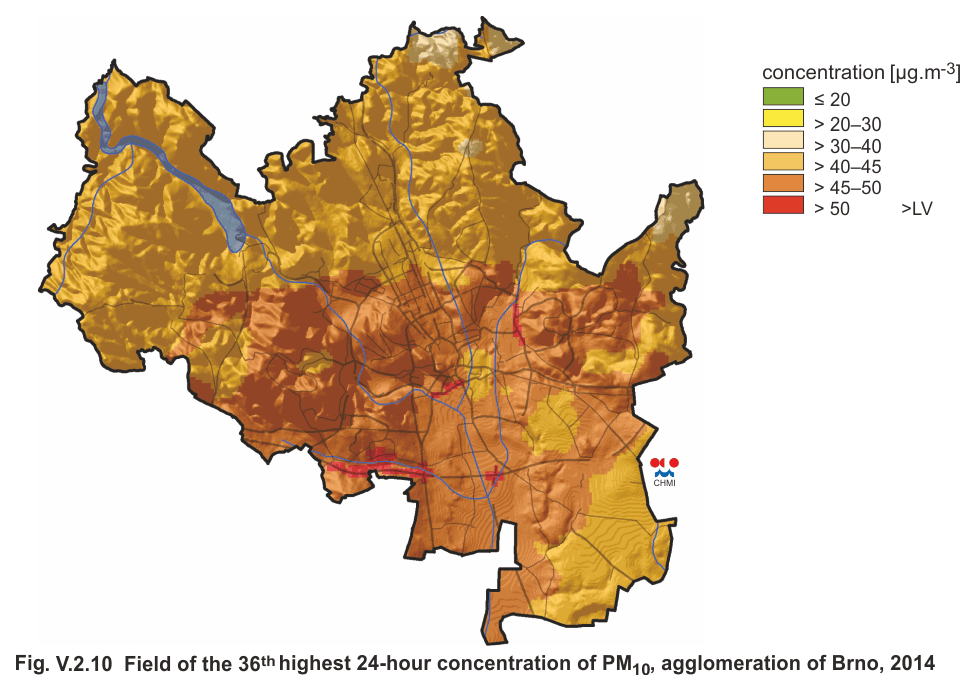
Fig. V.2.10 |
Field of the 36th highest 24-hour concentration of
PM10, agglomeration of Brno, 2014 |
|
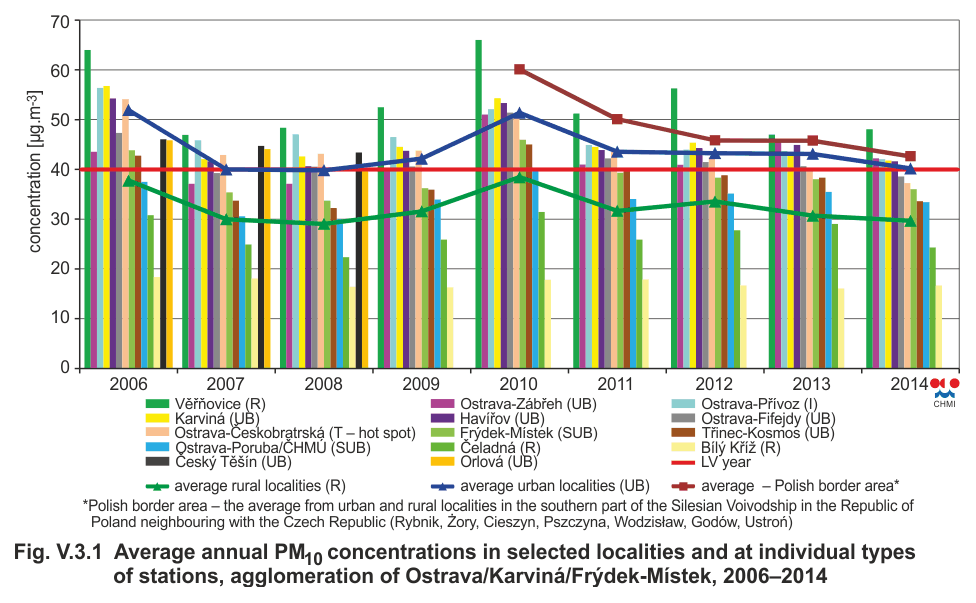
Fig. V.3.1 |
Average annual PM10 concentrations in selected
localities and at individual types of stations,
agglomeration of Ostrava/Karviná/Frýdek-Místek,
2006–2014 |
|
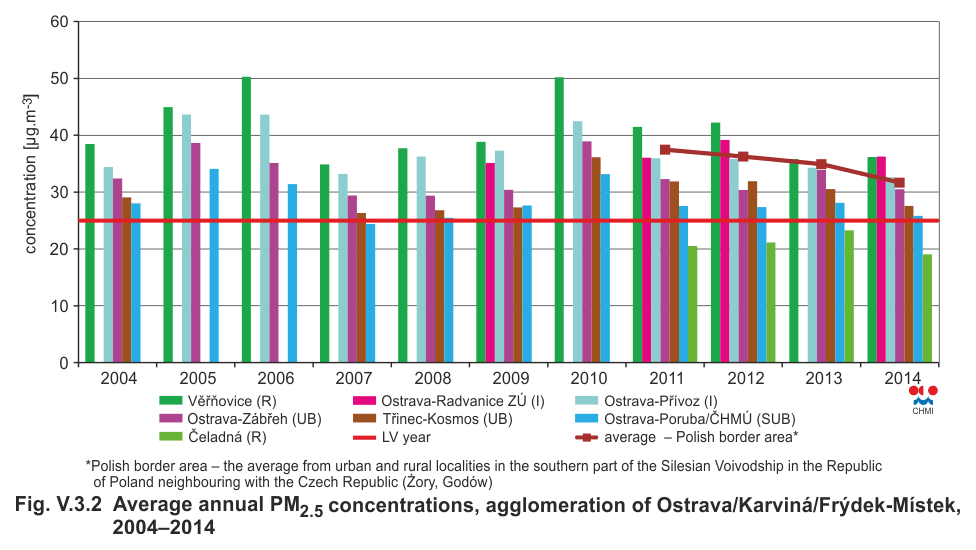
Fig. V.3.2 |
Average annual PM2.5 concentrations, agglomeration
of Ostrava/Karviná/Frýdek-Místek, 2004–2014 |
|
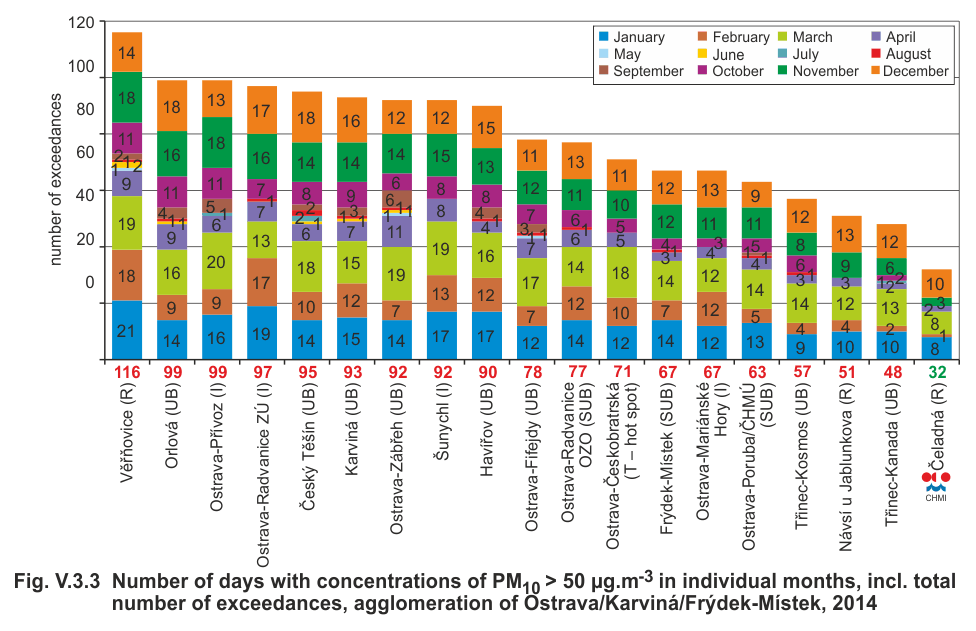
Fig. V.3.3 |
Number of days with concentrations of PM10 > 50
µg.m-3 in individual months, incl. total number of
exceedances, agglomeration of
Ostrava/Karviná/Frýdek-Místek, 2014 |
|
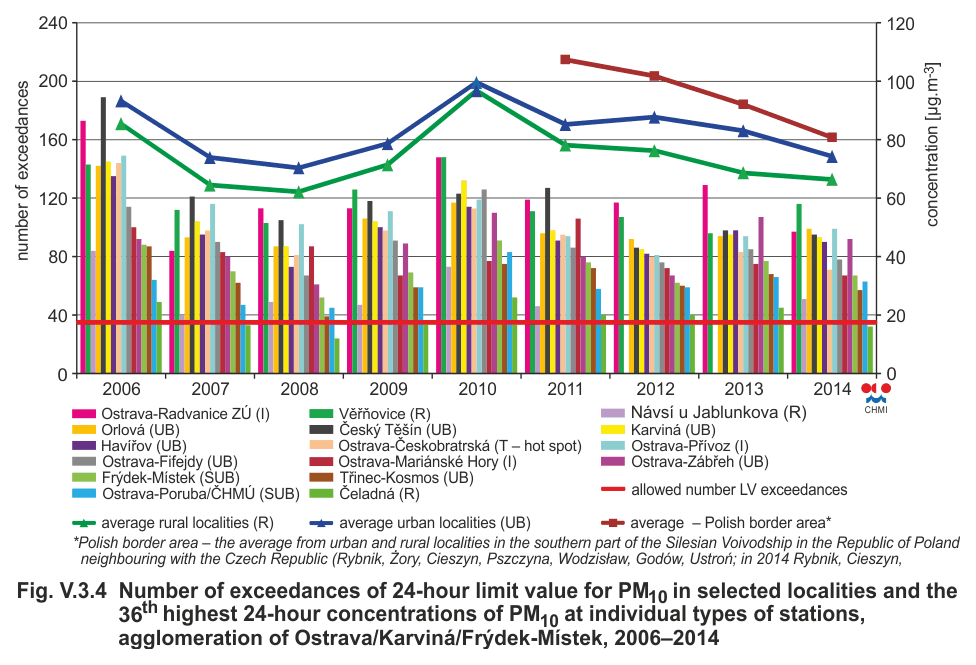
Fig. V.3.4 |
Number of exceedances of 24-hour limit value for
PM10 in selected localities and the 36th highest 24-hour
concentrations of PM10 at individual types of stations,
agglomeration of Ostrava/Karviná/Frýdek-Místek,
2006–2014 |
|
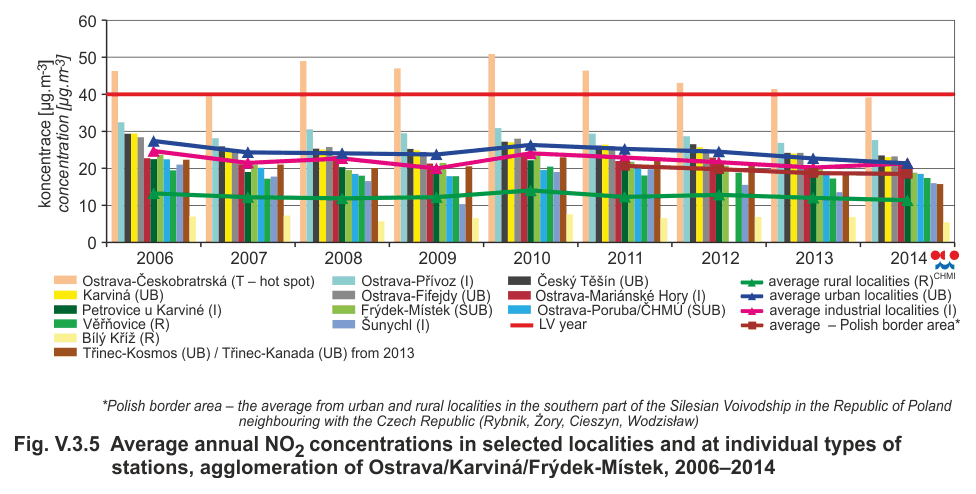
Fig. V.3.5 |
Average annual NO2 concentrations in selected
localities and at individual types of stations,
agglomeration of Ostrava/Karviná/Frýdek-Místek,
2006–2014 |
|
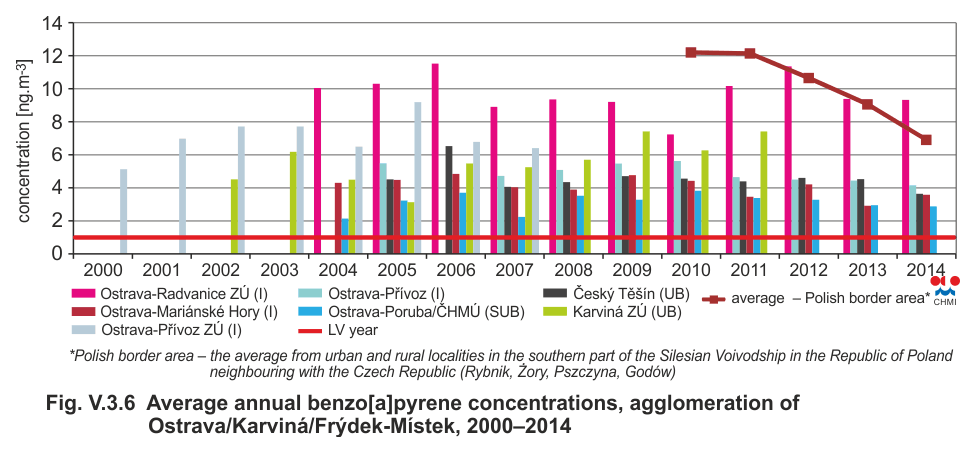
Fig. V.3.6 |
Average annual benzo[a]pyrene concentrations,
agglomeration of Ostrava/Karviná/Frýdek-Místek,
2000–2014 |
|
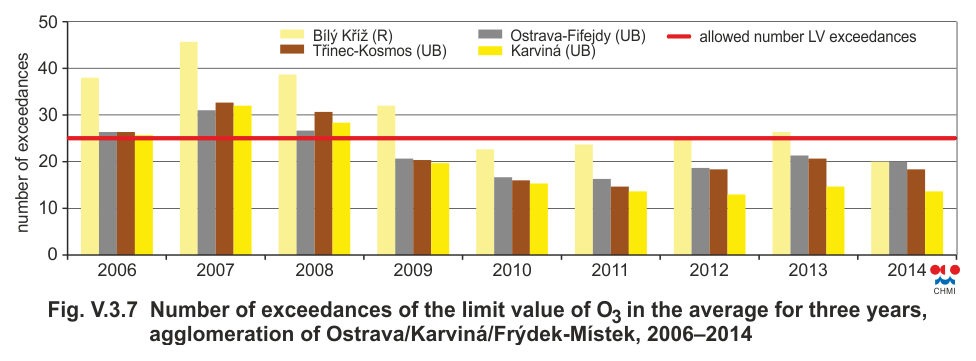
Fig. V.3.7 |
Number of exceedances of the limit value of O3 in
the average for three years, agglomeration of
Ostrava/Karviná/Frýdek-Místek, 2006–2014 |
|
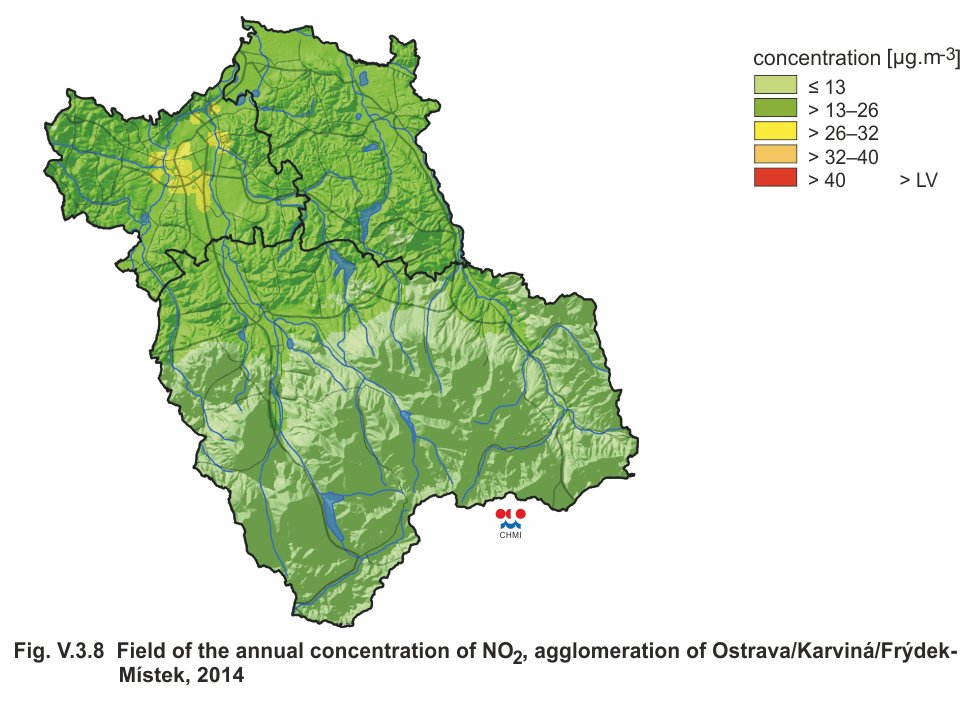
Fig. V.3.8 |
Field of the annual concentration of NO2,
agglomeration of Ostrava/Karviná/Frýdek-Místek, 2014 |
|
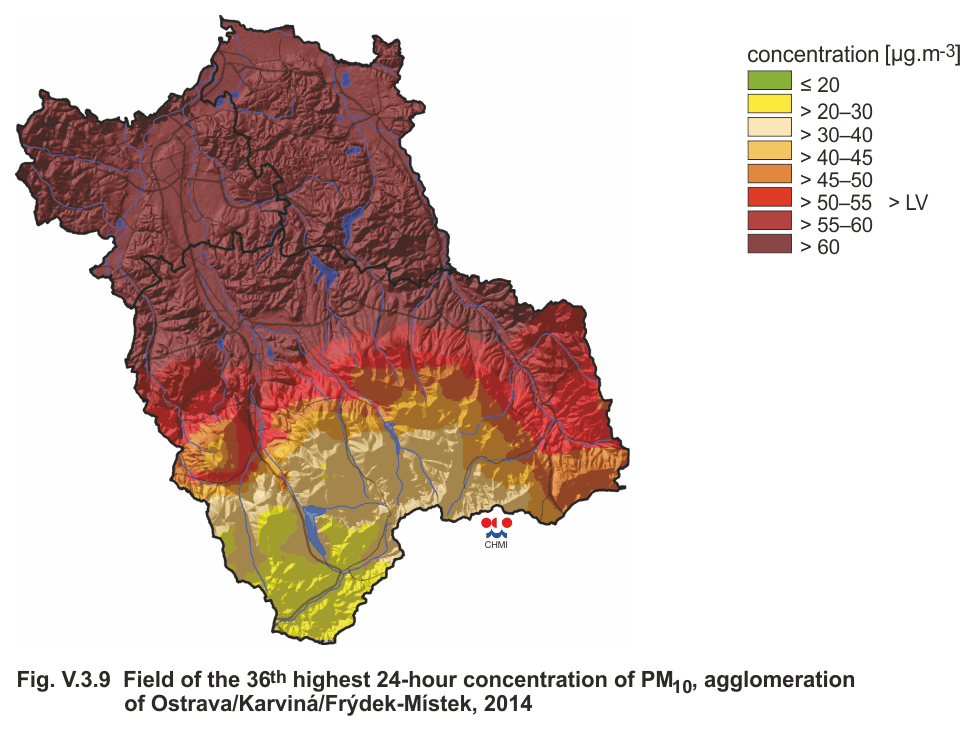
Fig. V.3.9
|
Field of the 36th highest 24-hour concentration of
PM10, agglomeration of Ostrava/Karviná/Frýdek-Místek,
2014 |
|
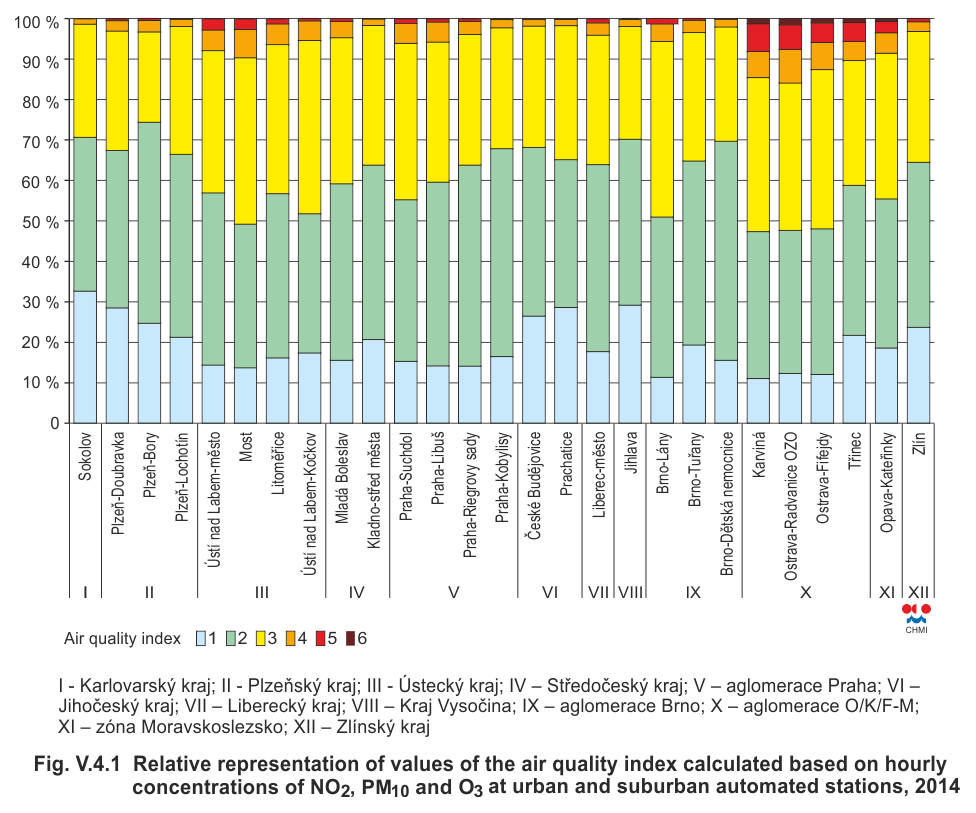
Fig. V.4.1 |
Relative representation of values of the air quality
index calculated based on hourly concentrations of NO2,
PM10 and O3 at urban and suburban automated stations,
2014 |
|
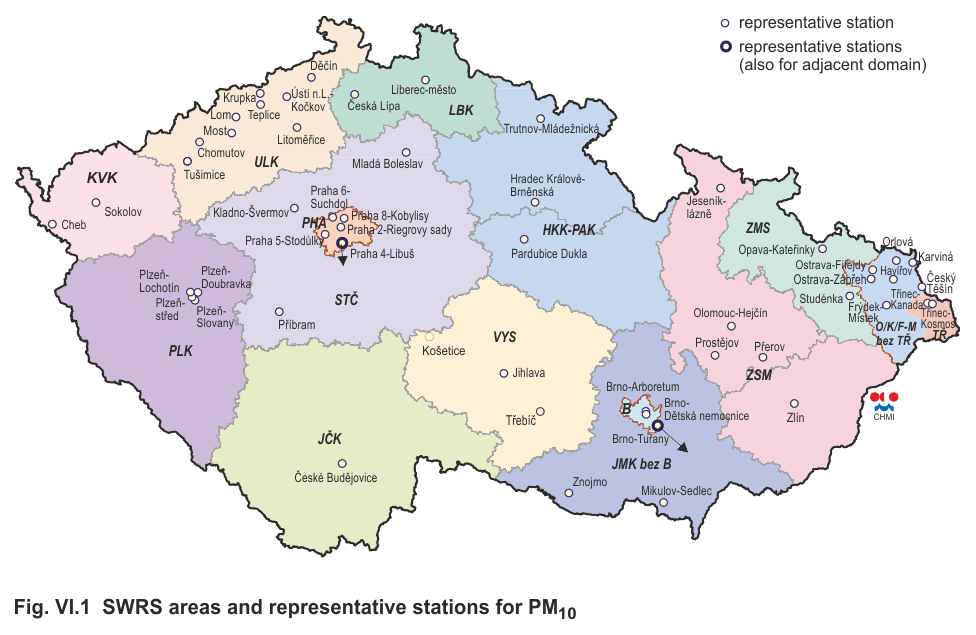
Fig. VI.1 |
SWRS areas and representative stations for PM10 |
|
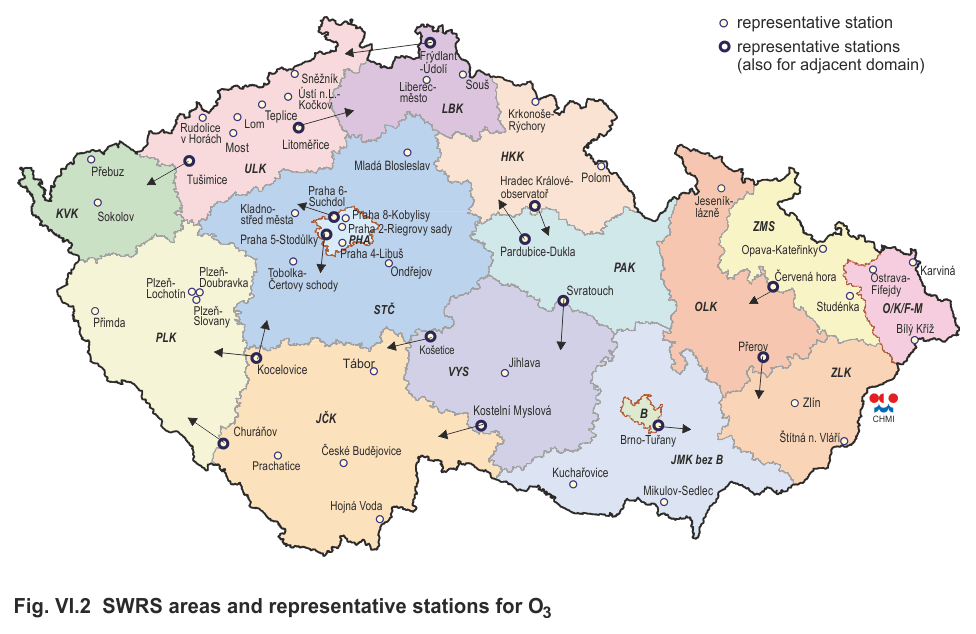
Fig. VI.2 |
SWRS areas and representative stations for O3 |
|
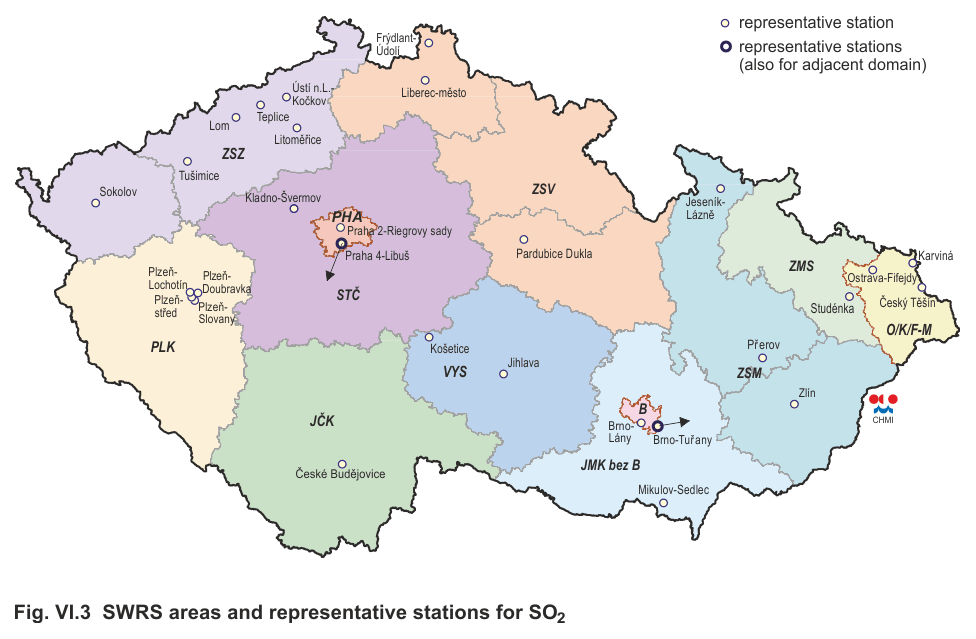
Fig. VI.3 |
SWRS areas and representative stations for SO2 |
|
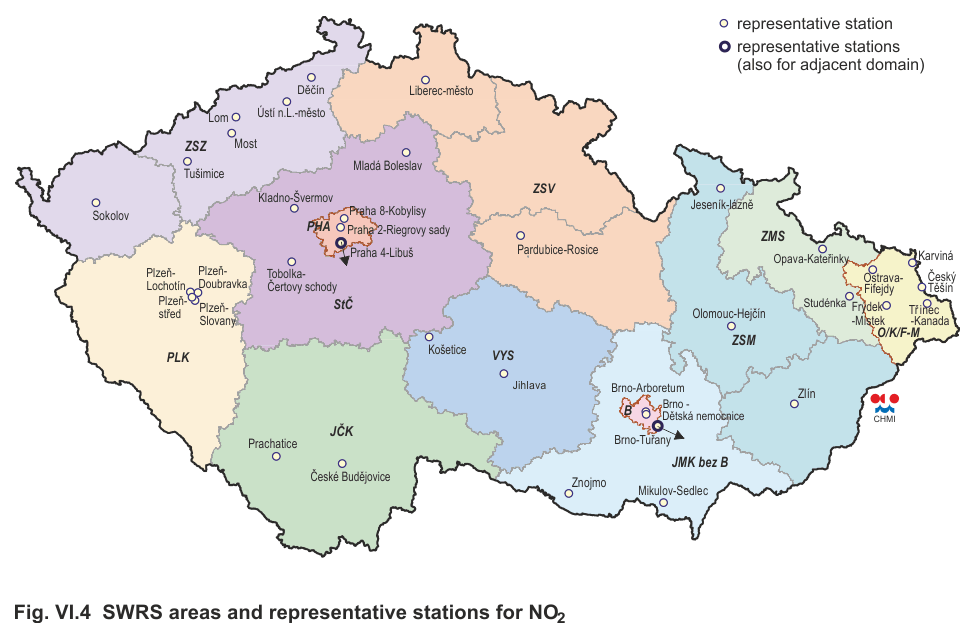
Fig. VI.4 |
SWRS areas and representative stations for NO2 |
|
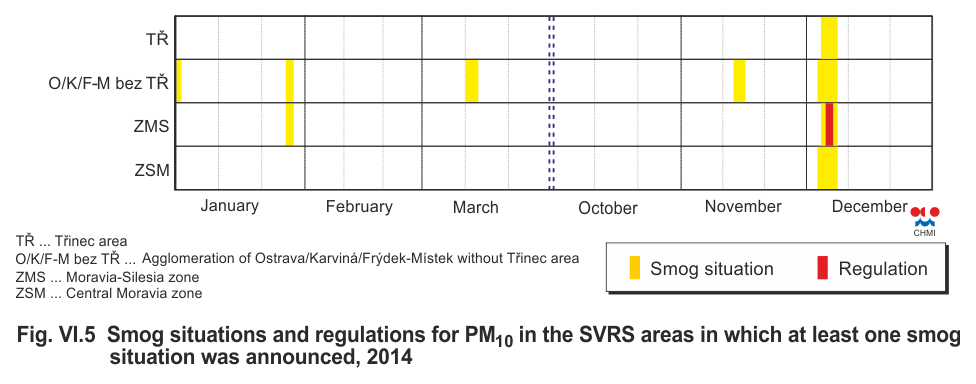
Fig. VI.5
|
Smog situations and regulations for PM10 in the SWRS
areas in which at least one smog situation was
announced, 2014 |
|
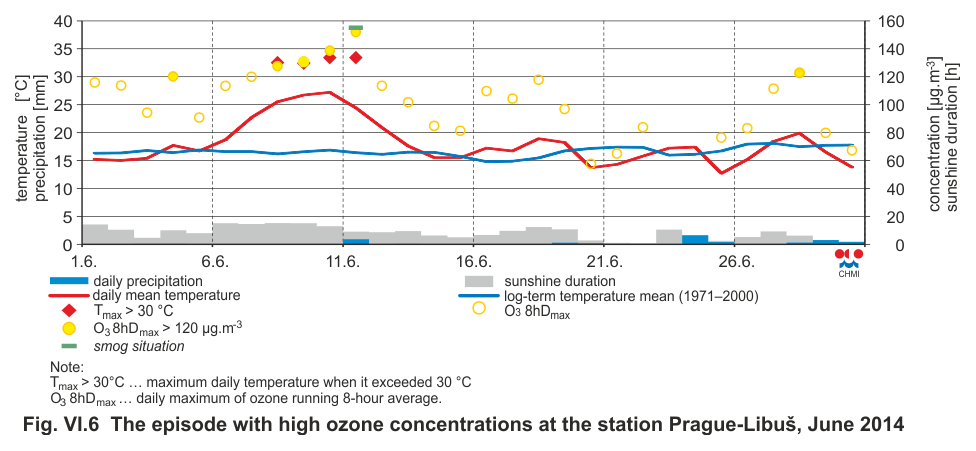
Fig. VI.6 |
The episode with high ozone concentrations at the
station Prague-Libuš, June 2014 |
|
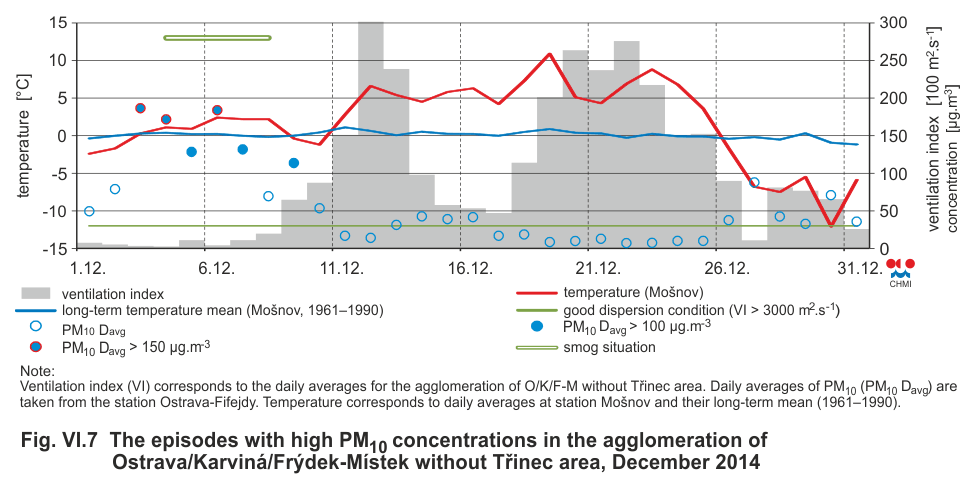
Fig. VI.7 |
The episodes with high PM10 concentrations in the
agglomeration of Ostrava/Karviná/Frýdek-Místek without
Třinec area, December 2014 |
|
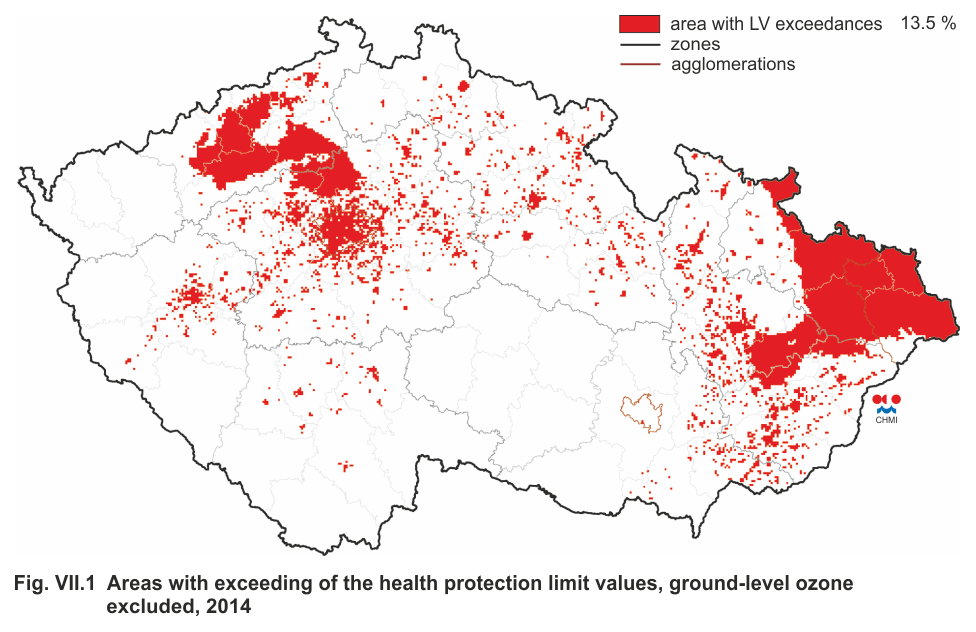
Fig. VII.1 |
Areas with exceeding of the health protection limit
values, ground-level ozone excluded, 2014 |
|
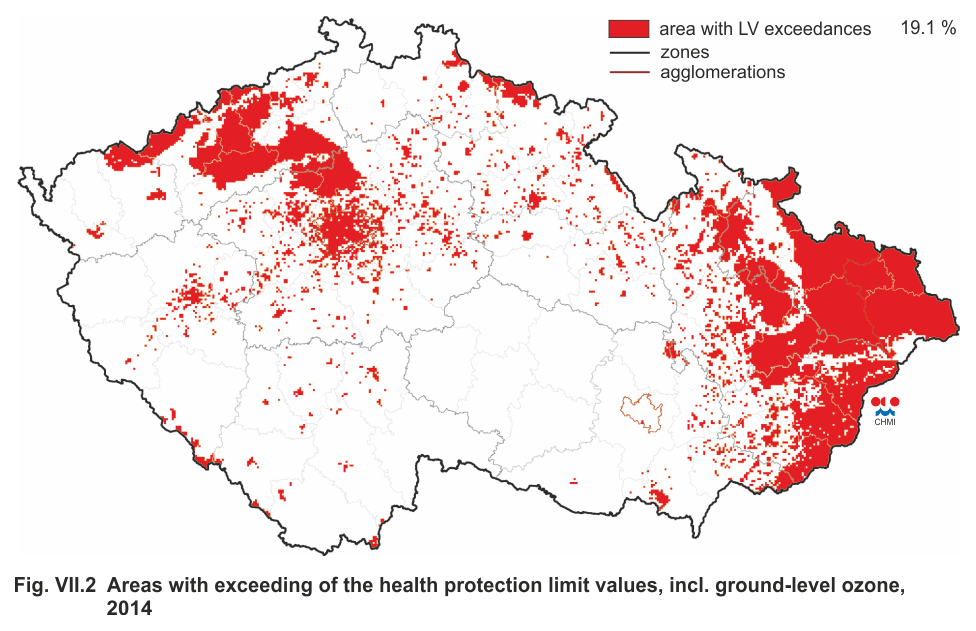
Fig. VII.2 |
Areas with exceeding of the health protection limit
values, incl. ground-level ozone, 2014 |
|
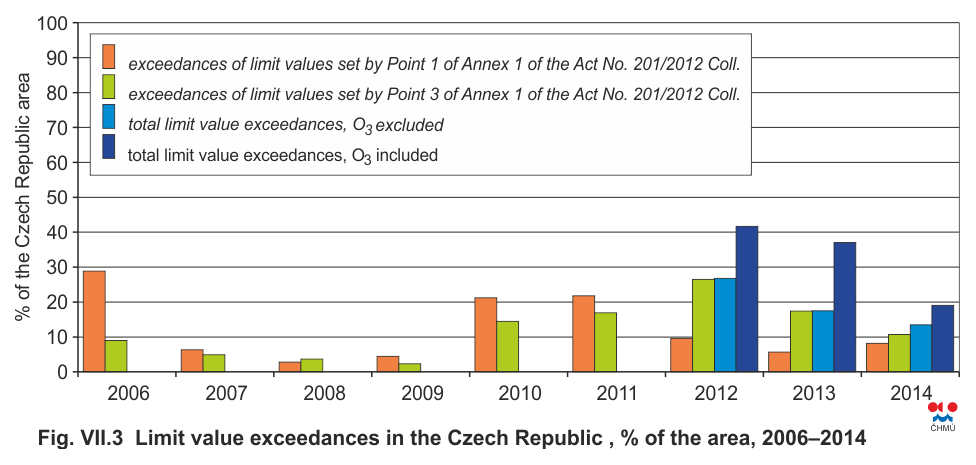
Fig. VII.3 |
Limit value exceedances in the Czech Republic, % of
the area, 2006–2014 |
|
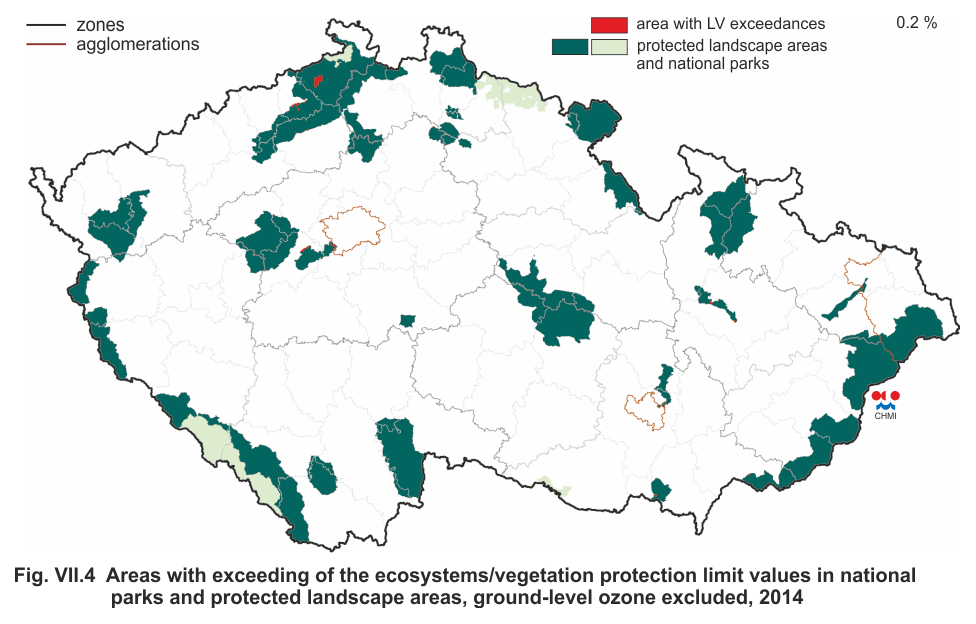
Fig. VII.4 |
Areas with exceeding of the ecosystems/vegetation
protection limit values in national parks and protected
landscape areas, ground-level ozone excluded, 2014 |
|
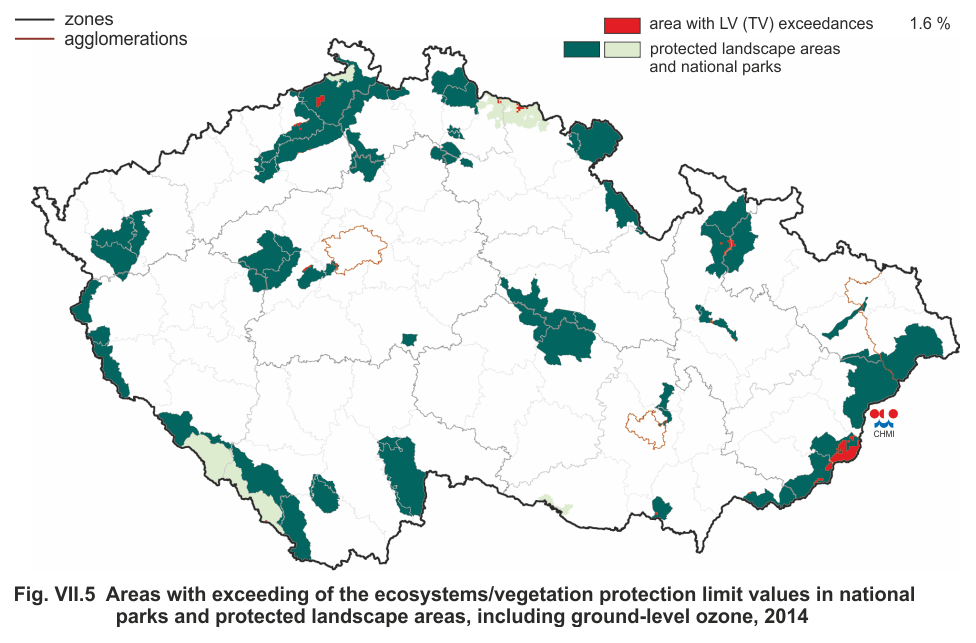
Fig. VII.5 |
Areas with exceeding of the ecosystems/vegetation
protection limit values in national parks and protected
landscape areas, including ground-level ozone, 2014 |
|
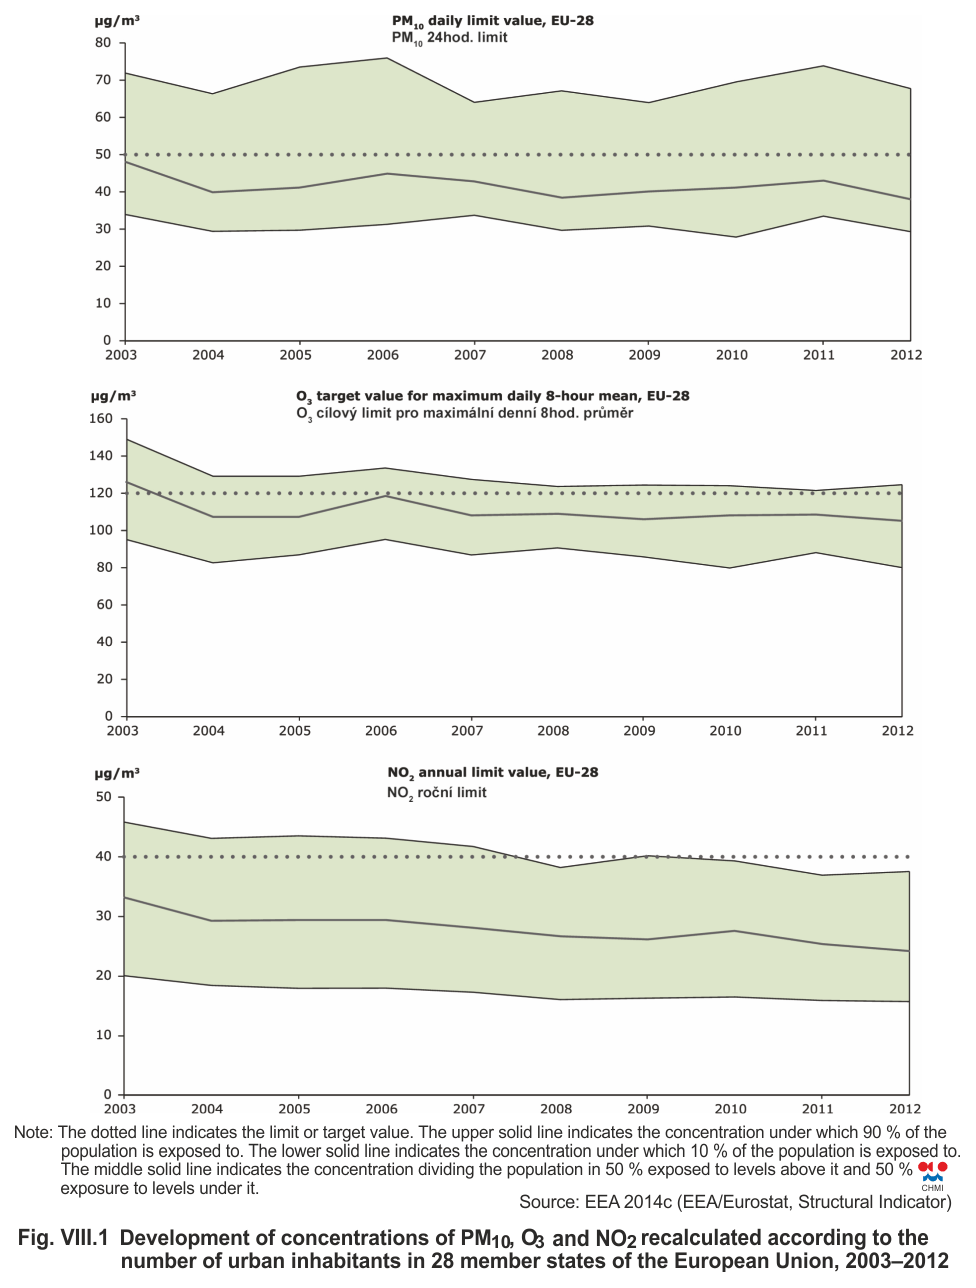
Fig. VIII.1 |
Development of concentrations of PM10, O3 and NO2
recalculated according to the number of urban
inhabitants in 28 member states of the European Union,
2003–2012 |
|
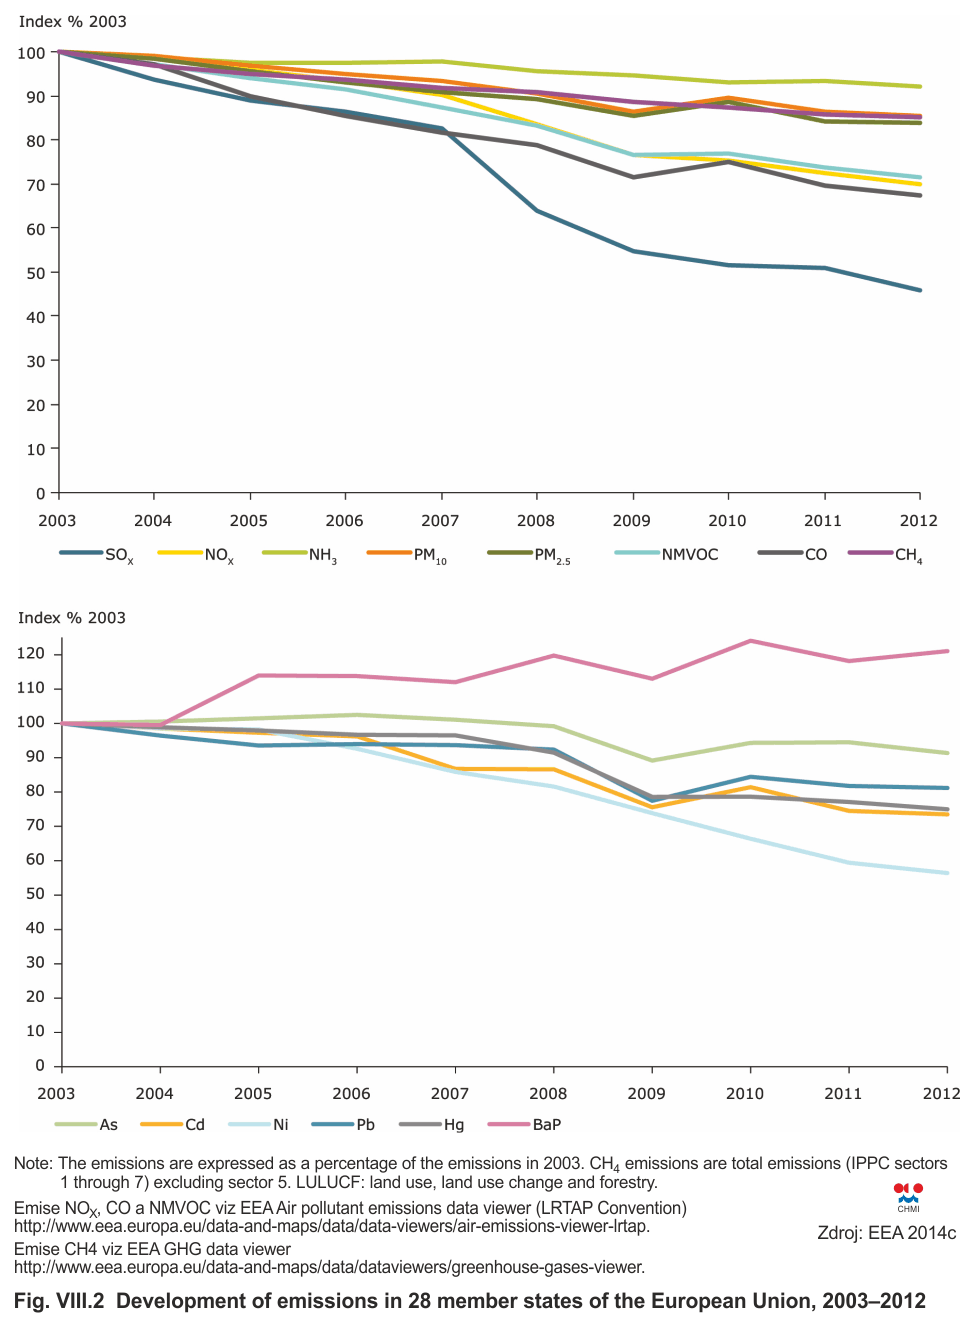
Fig. VIII.2 |
Development of emissions in 28 member states of the
European Union, 2003–2012 |
|
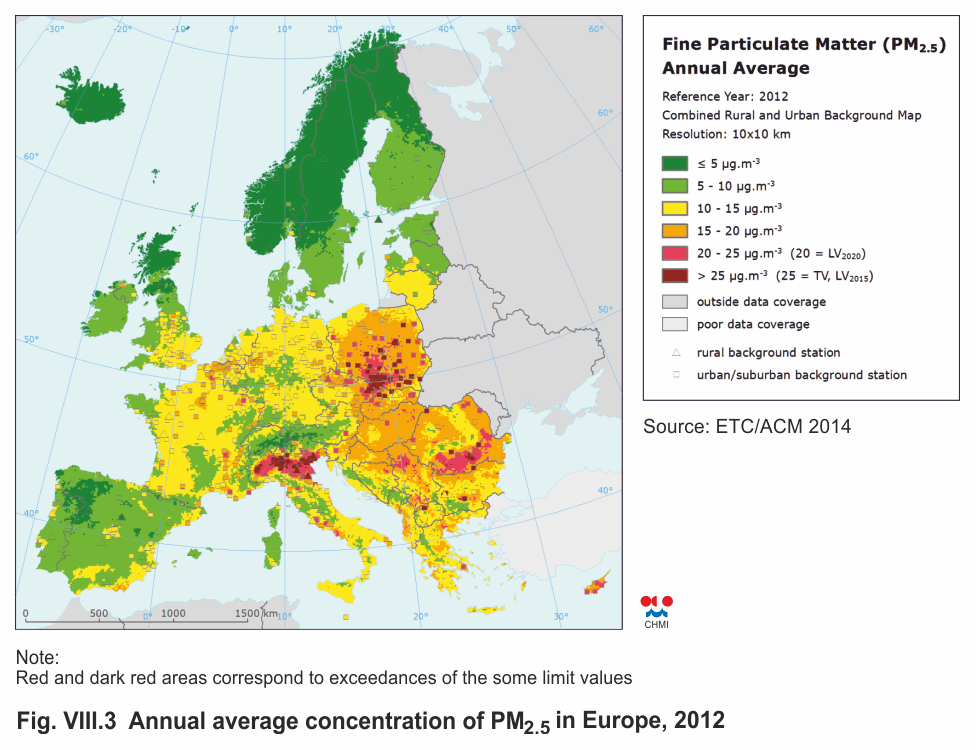
Fig. VIII.3 |
Annual average concentration of PM2.5 in Europe,
2012 |
|
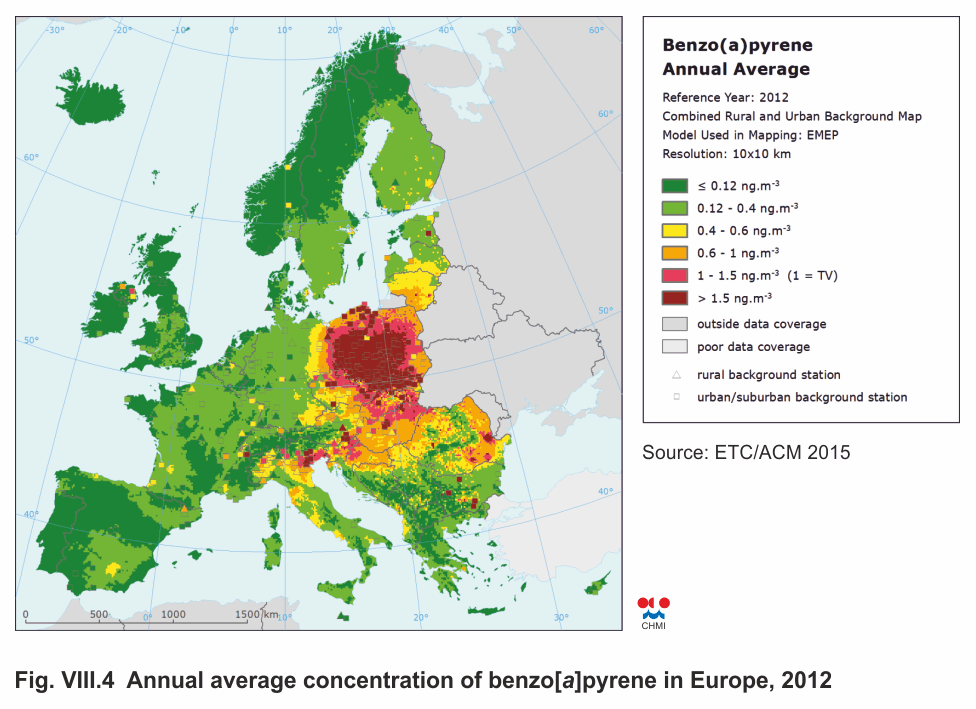
Fig. VIII.4 |
Annual average concentration of benzo[a]pyrene in
Europe, 2012 |
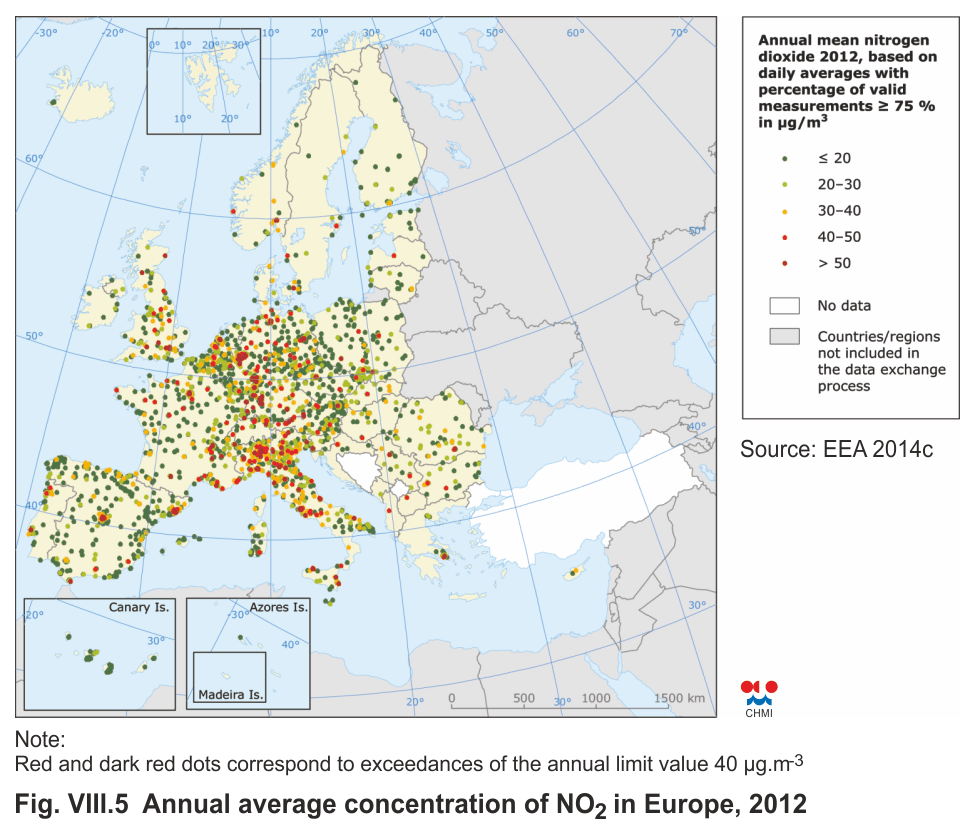
|
Fig. VIII.5 |
Annual average concentration of NO2 in Europe, 2012 |
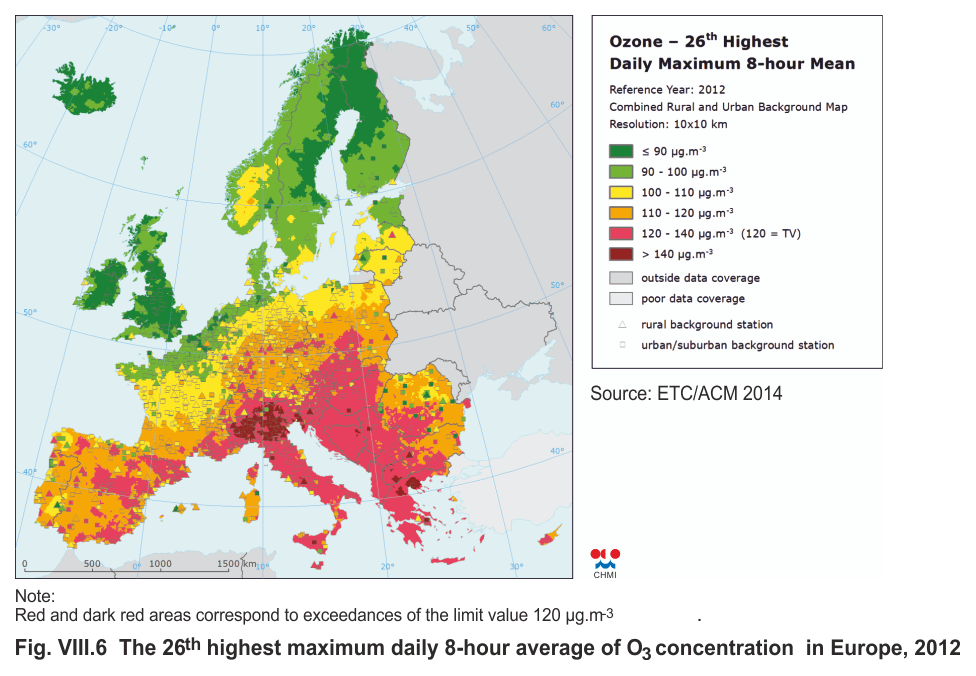
|
Fig. VIII.6 |
The 26th highest maximum daily 8-hour average of O3
concentration in Europe, 2012 |
|
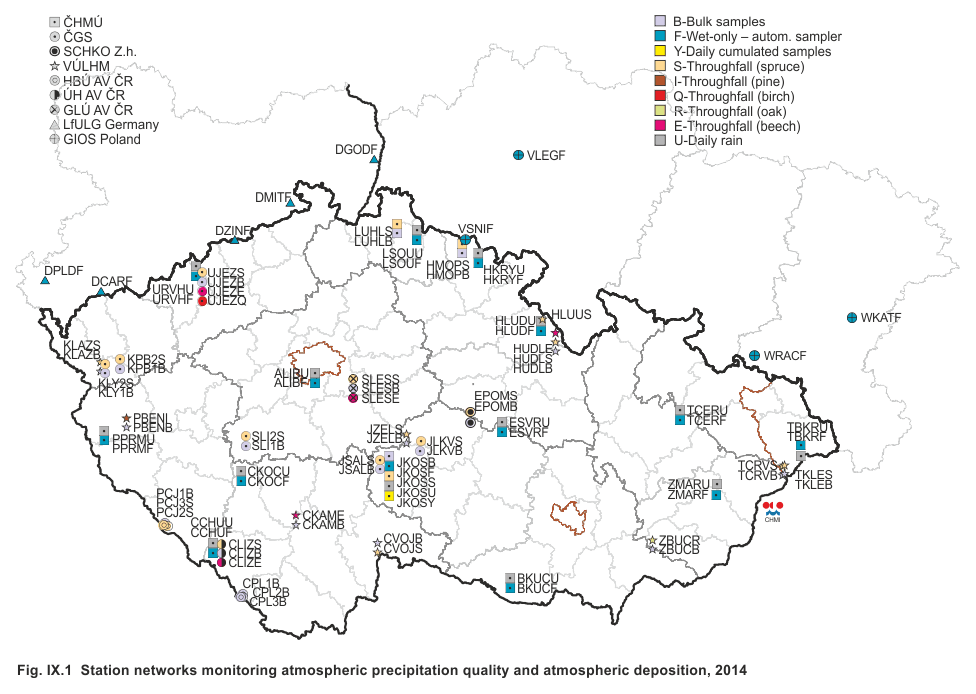
Fig. IX.1 |
Station networks monitoring atmospheric
precipitation quality and atmospheric deposition, 2014 |
|
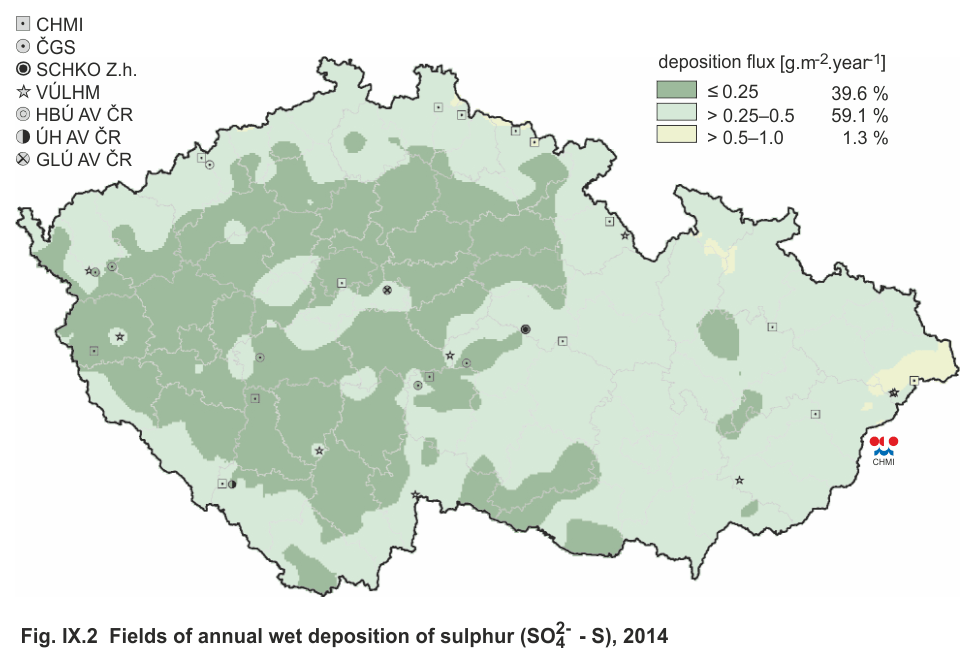
Fig. IX.2
|
Fields of annual wet deposition of sulphur (SO42- -
S), 2014 |
|
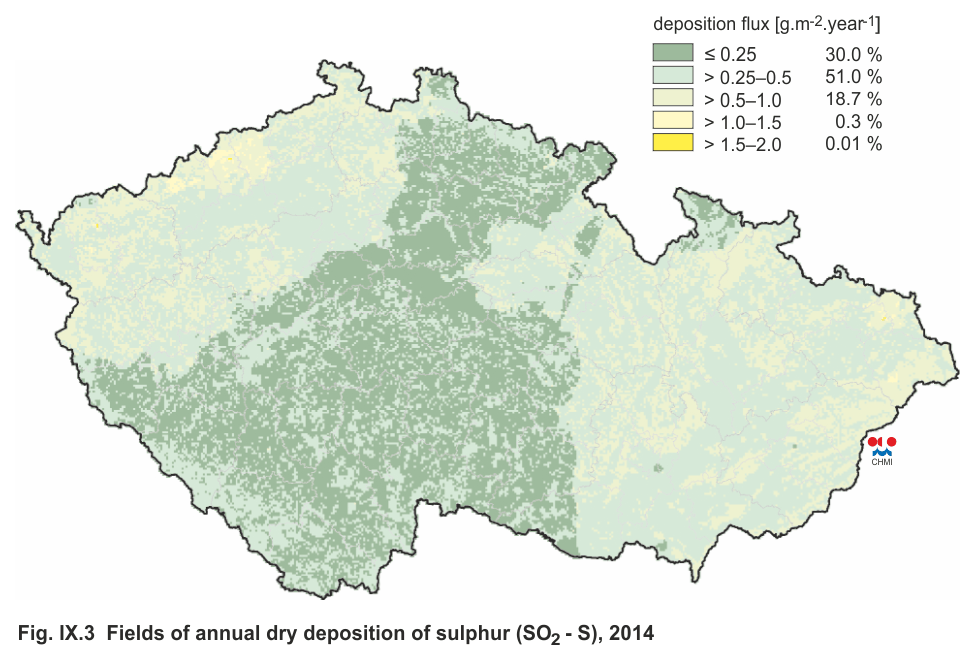
Fig. IX.3 |
Fields of annual dry deposition of sulphur (SO2 -
S), 2014 |
|
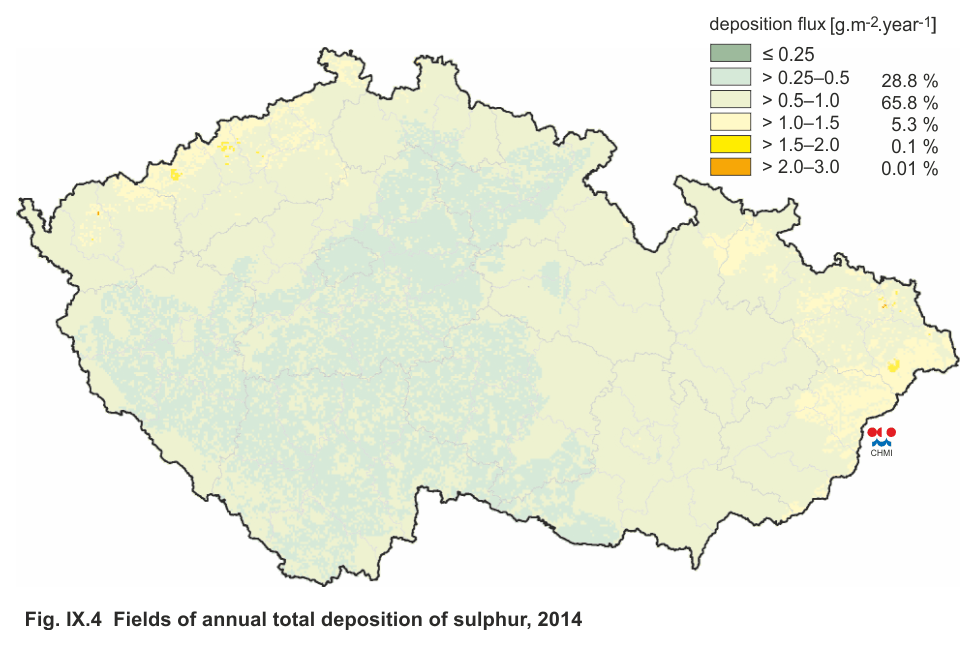
Fig. IX.4
|
Fields of annual total deposition of sulphur, 2014 |
|
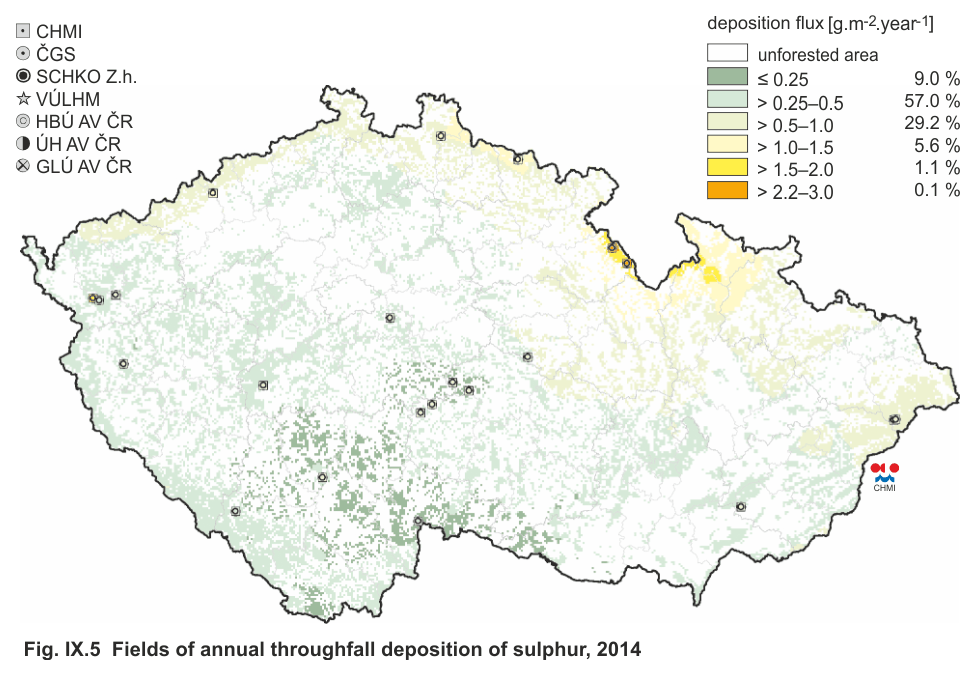
Fig. IX.5 |
Fields of annual throughfall deposition of sulphur,
2014 |
|
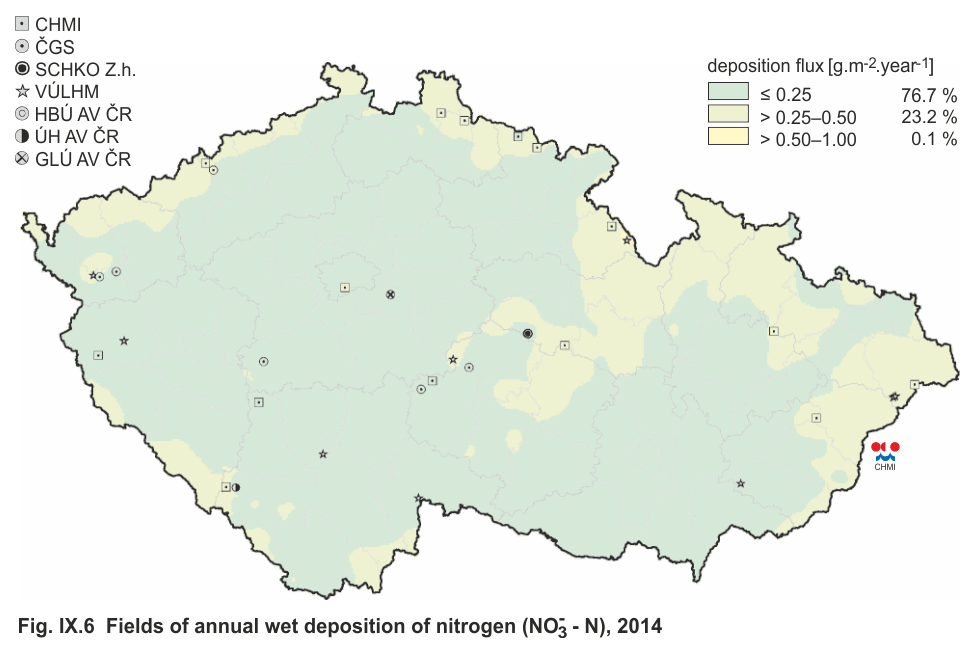
Fig. IX.6 |
Fields of annual wet deposition of nitrogen (NO3- -
N), 2014 |
|
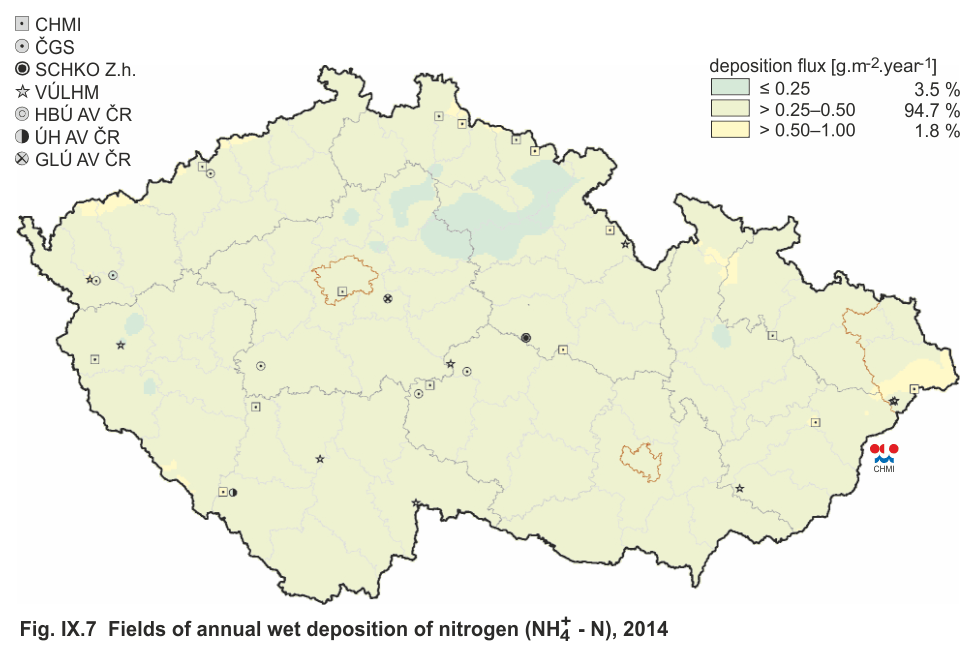
Fig. IX.7 |
Fields of annual wet deposition of nitrogen (NH4+ -
N), 2014 |
|
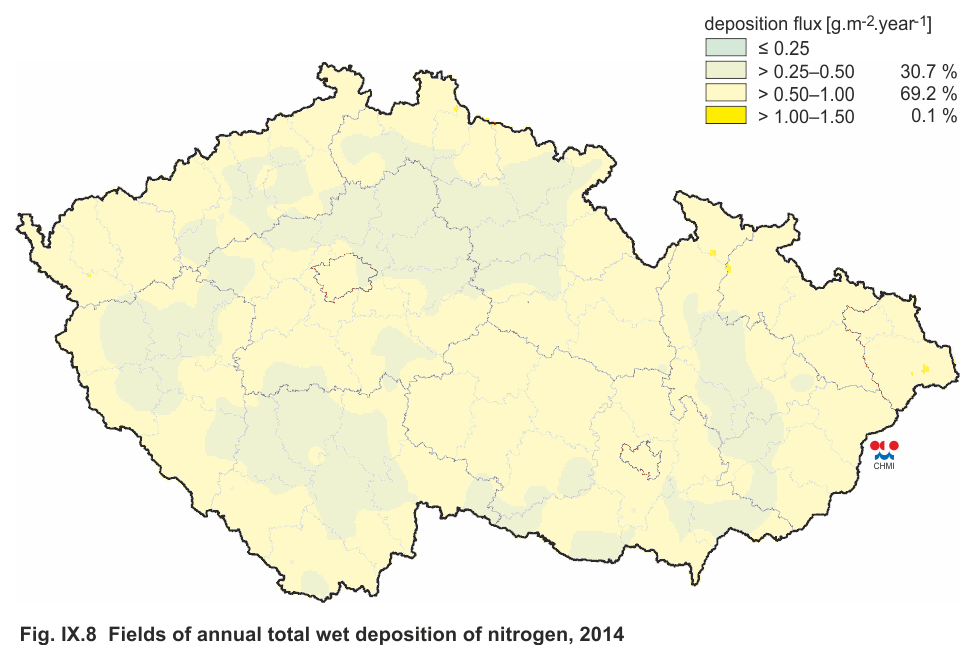
Fig. IX.8 |
Fields of annual total wet deposition of nitrogen,
2014 |
|
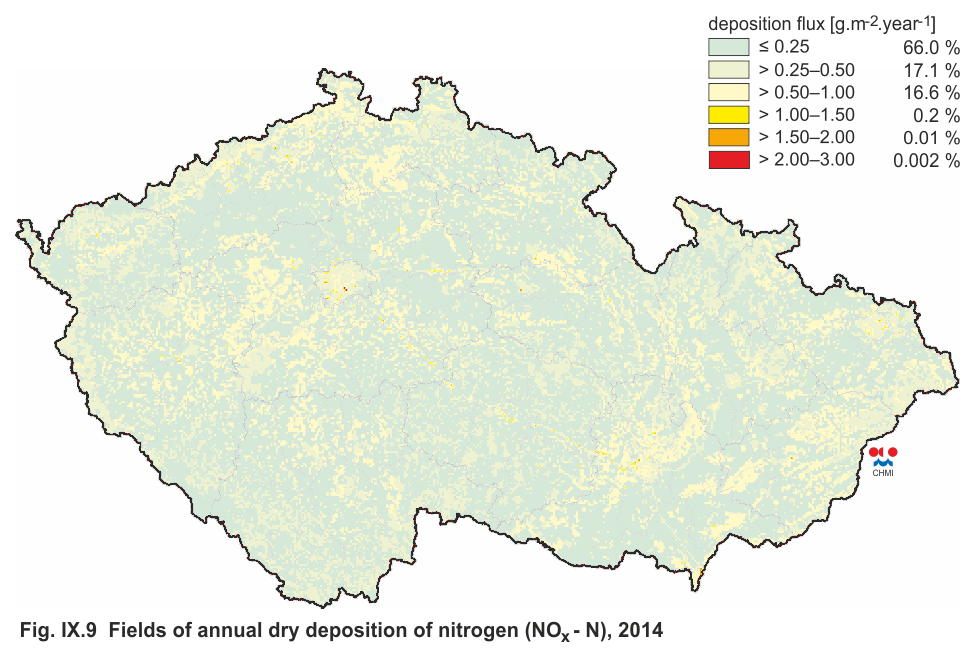
Fig. IX.9 |
Fields of annual dry deposition of nitrogen (NOx -
N), 2014 |
|
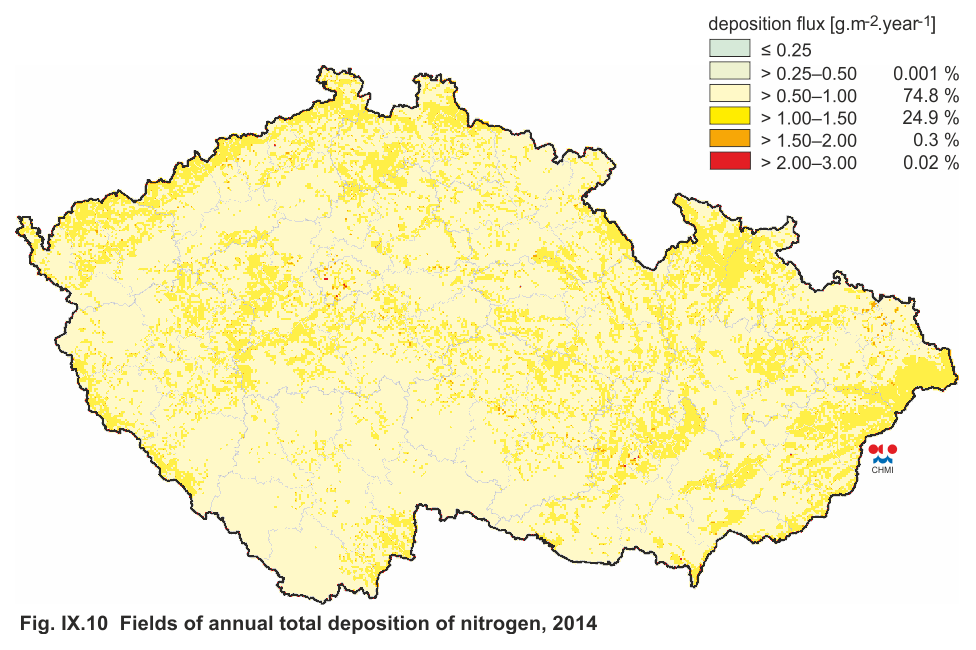
Fig. IX.10 |
Fields of annual total deposition of nitrogen, 2014 |
|
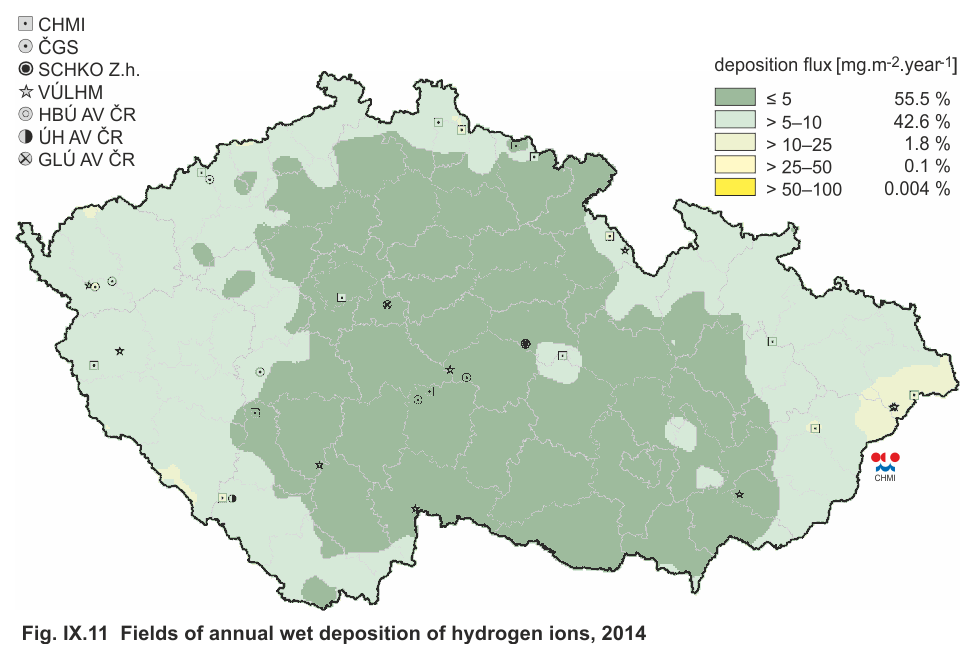
Fig. IX.11 |
Fields of annual wet deposition of hydrogen ions,
2014 |
|
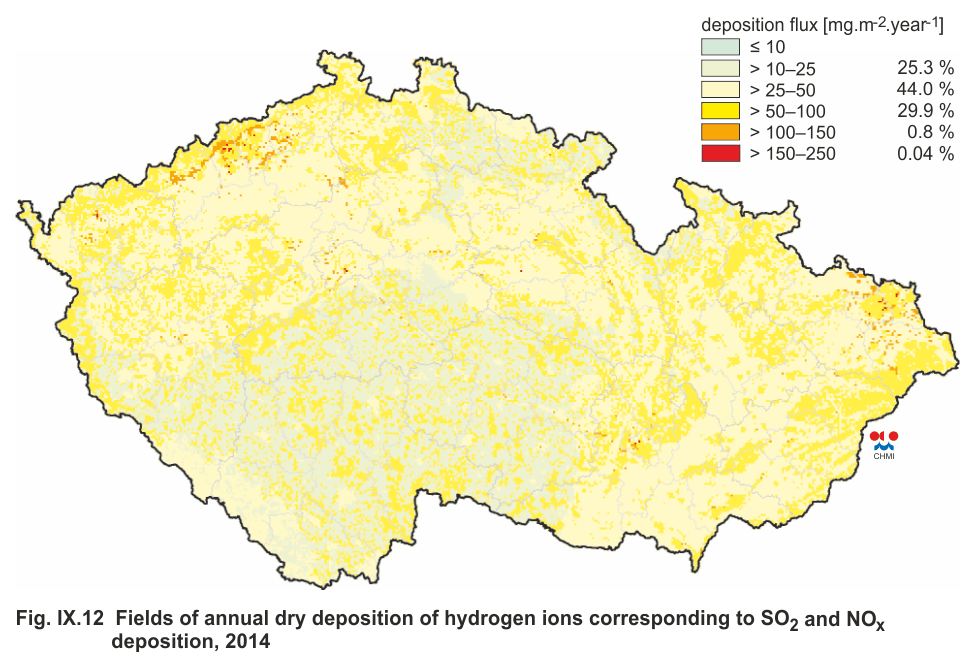
Fig. IX.12 |
Fields of annual dry deposition of hydrogen ions
corresponding to SO2 and NOx deposition, 2014 |
|
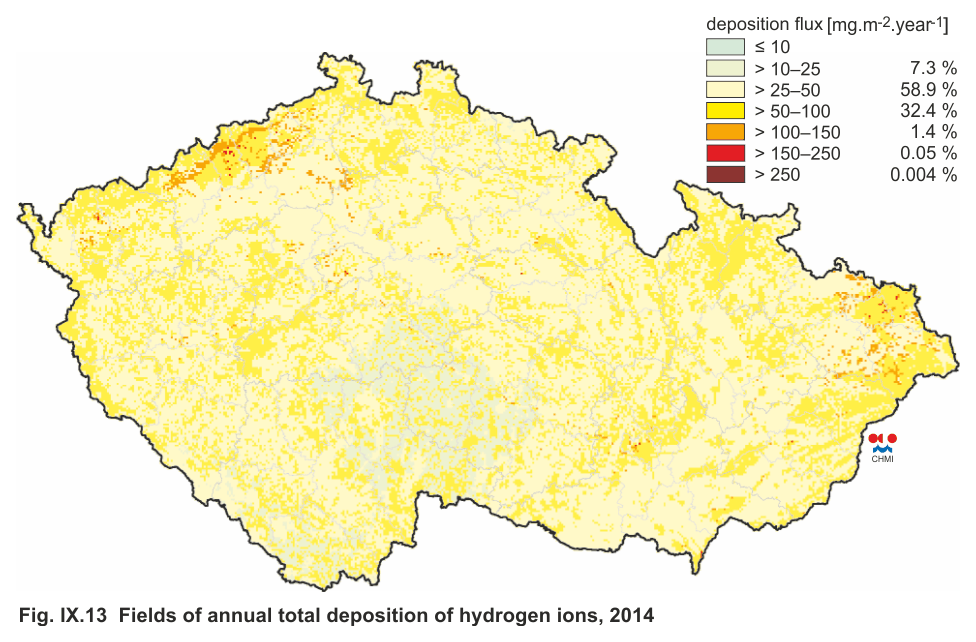
Fig. IX.13 |
Fields of annual total deposition of hydrogen ions,
2014 |
|
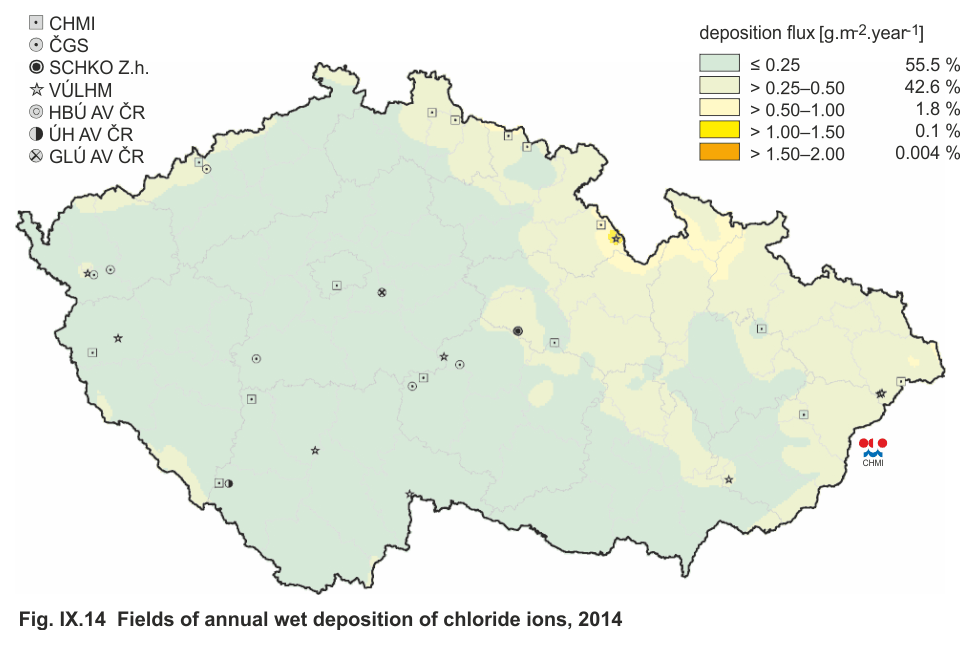
Fig. IX.14 |
Fields of annual wet deposition of chloride ions,
2014 |
|
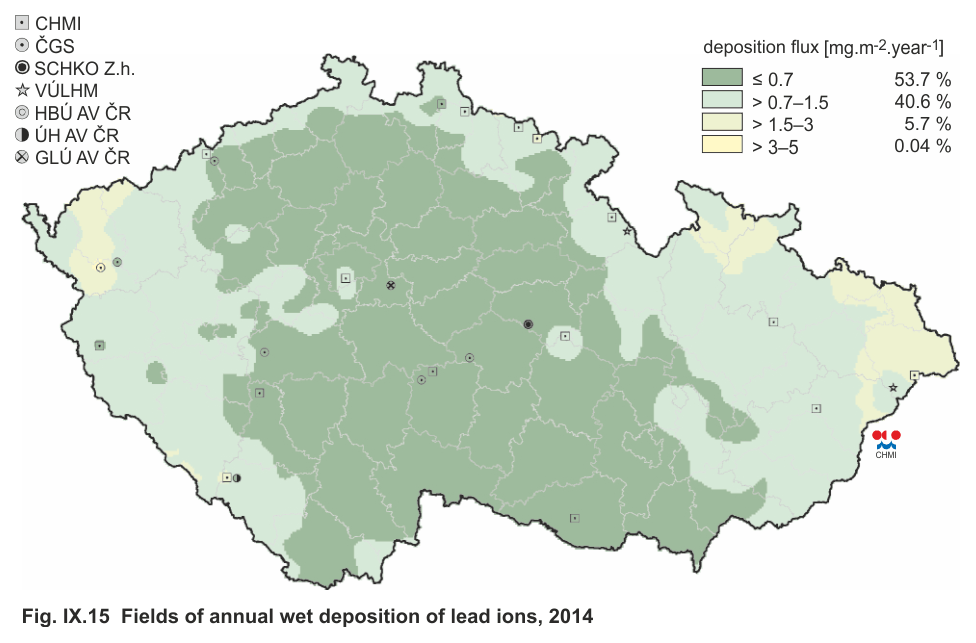
Fig. IX.15 |
Fields of annual wet deposition of lead ions, 2014 |
|
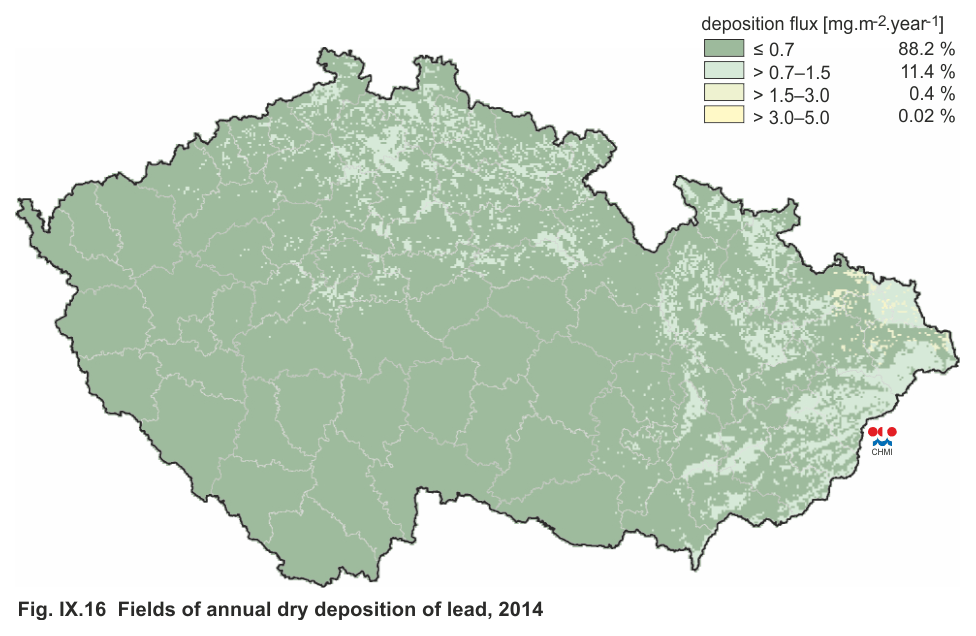
Fig. IX.16
|
Fields of annual dry deposition of lead, 2014 |
|
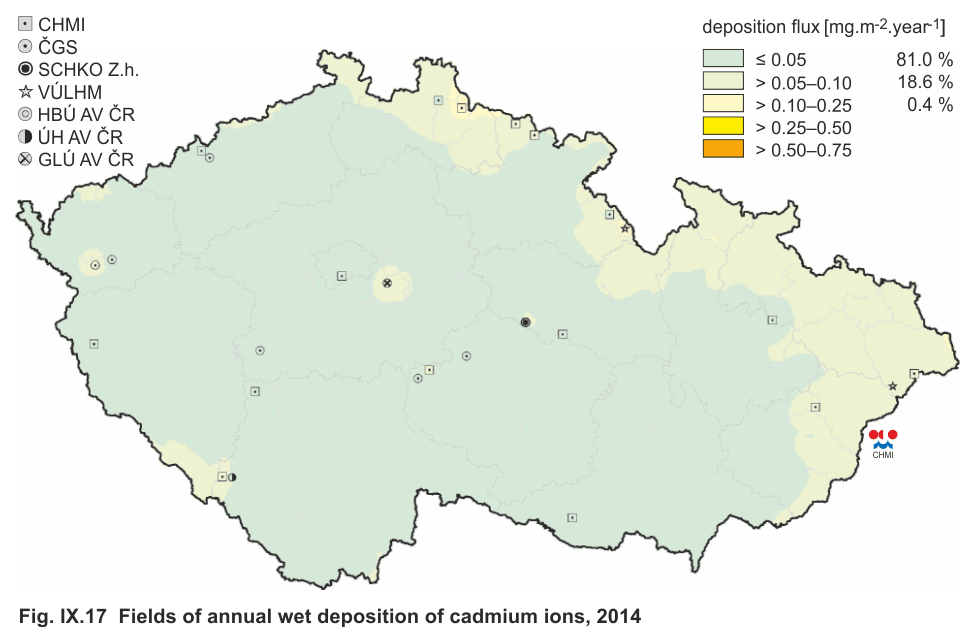
Fig. IX.17 |
Fields of annual wet deposition of cadmium ions,
2014 |
|
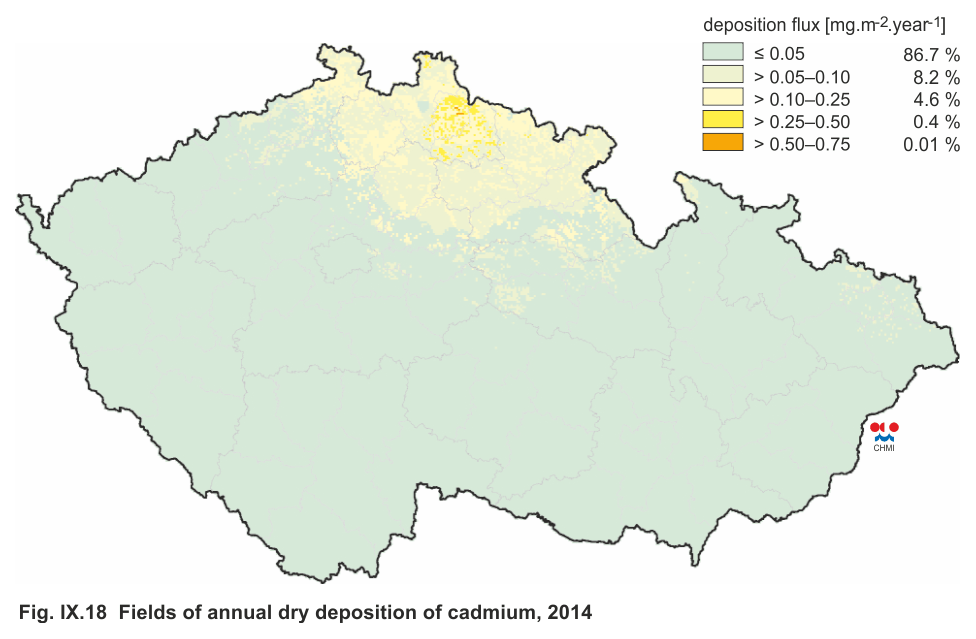
Fig. IX.18 |
Fields of annual dry deposition of cadmium, 2014 |
|
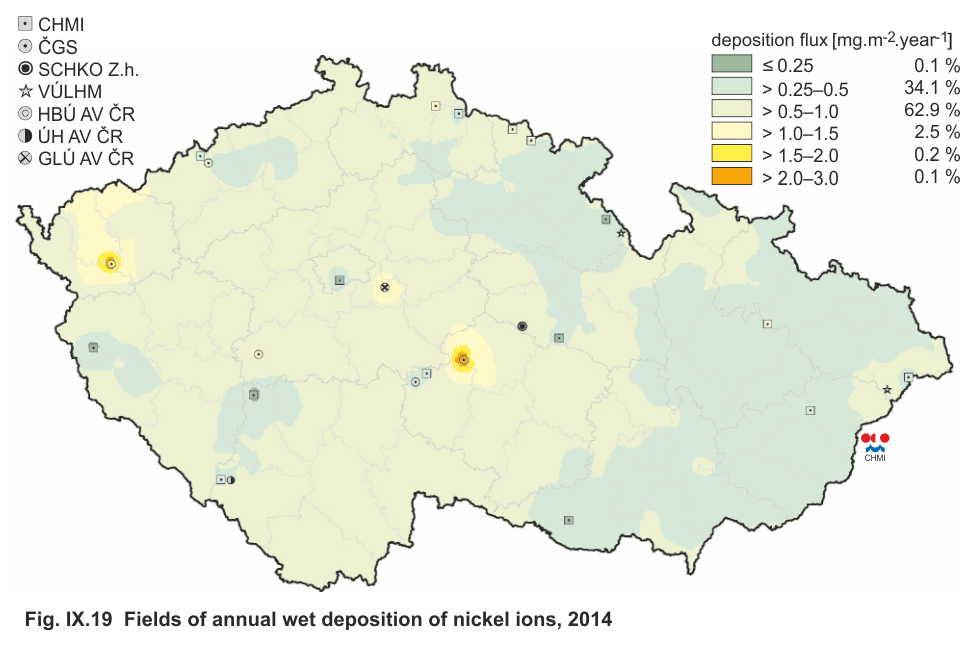
Fig. IX.19 |
Fields of annual wet deposition of nickel ions, 2014 |
|
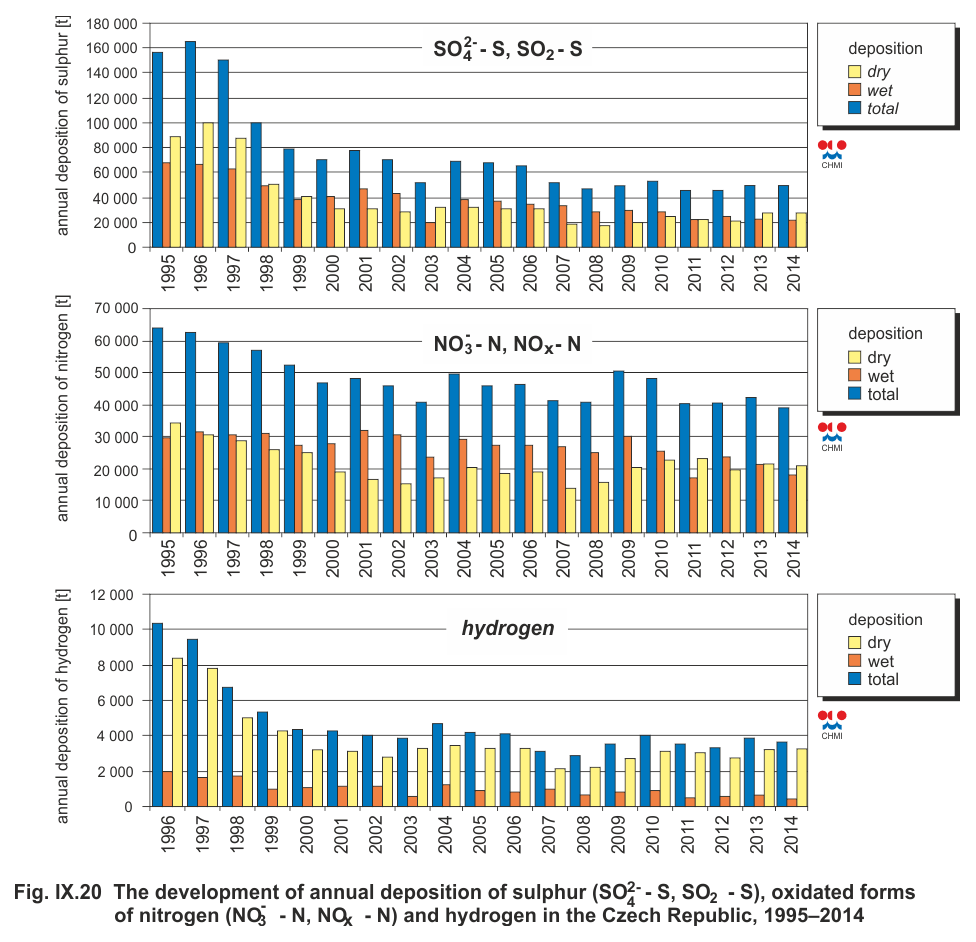
Fig. IX.20
|
The development of annual deposition of sulphur
(SO42- - S, SO2 - S), oxidated forms of nitrogen (NO3- -
N, NOx - N) and hydrogen in the Czech republic,
1995–2014 |
|
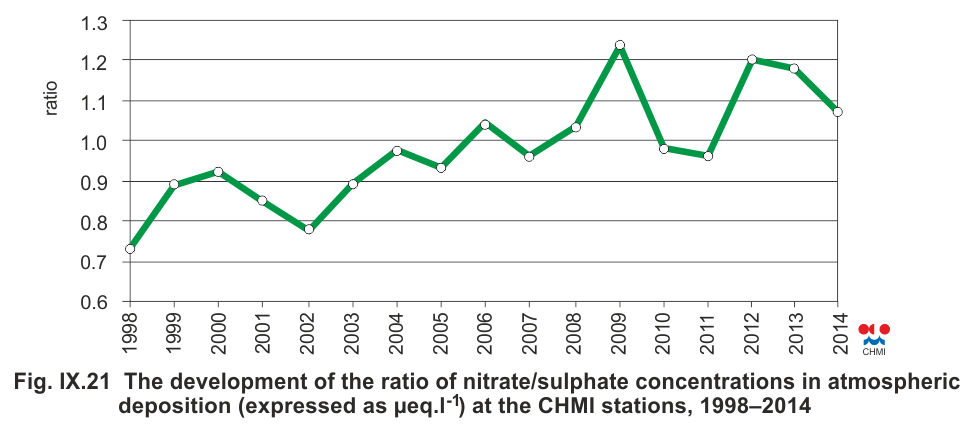
Fig. IX.21 |
The development of the ratio of nitrate/sulphate
concentrations in atmospheric deposition (expressed as µeq.
l-1) at the CHMI stations, 1998–2014 |
|
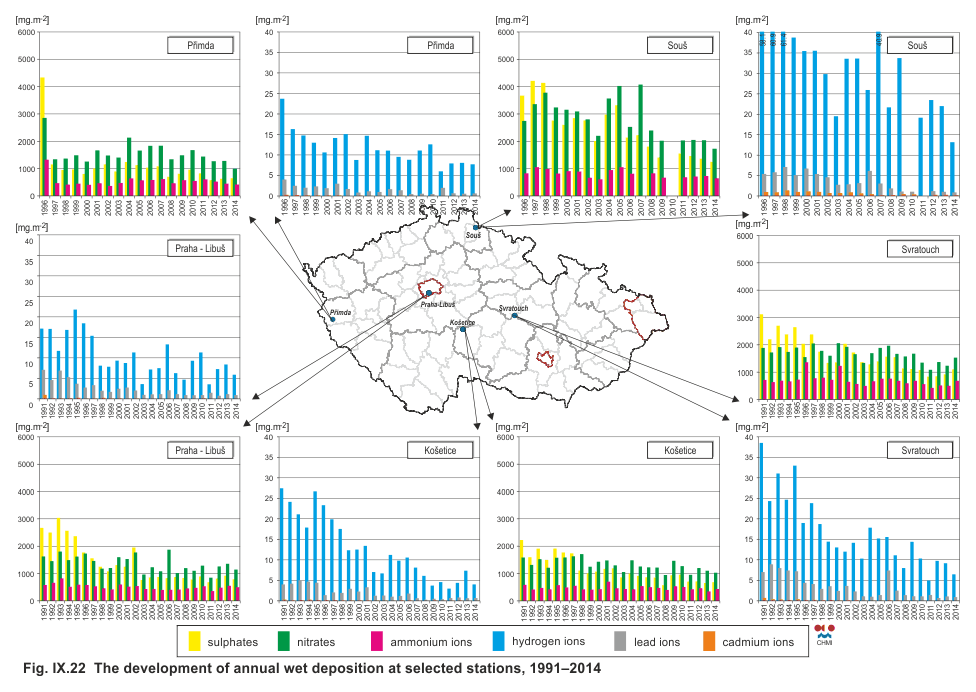
Fig. IX.22 |
The development of annual wet deposition at selected
stations, 1991–2014 |
|
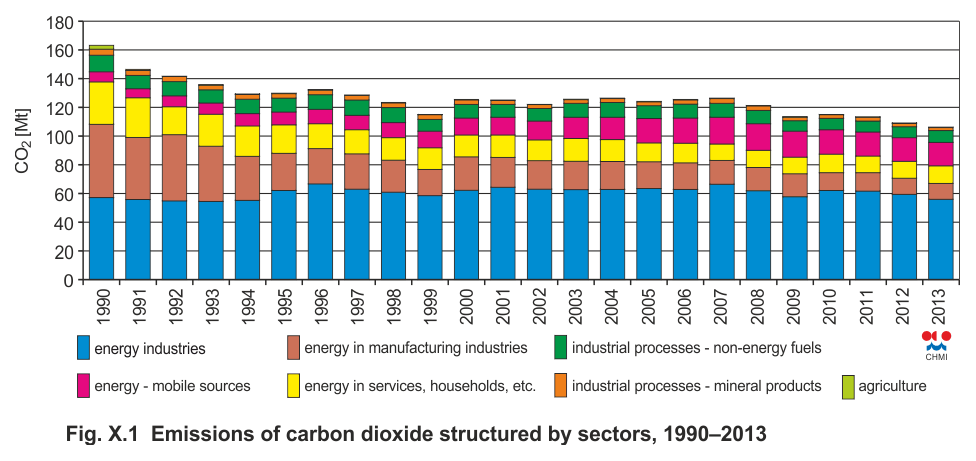
Fig. X.1 |
Emissions of carbon dioxide structured by sectors,
1990–2013 |
|
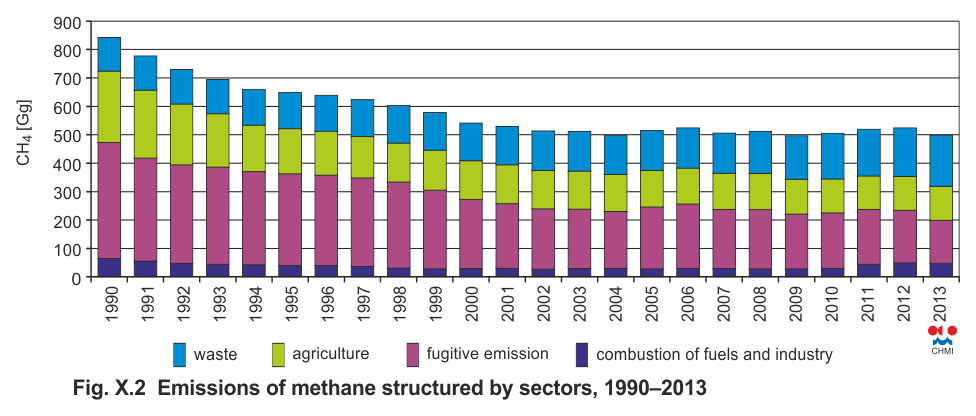
Fig. X.2 |
Emissions of methane structured by sectors,
1990–2013 |
|
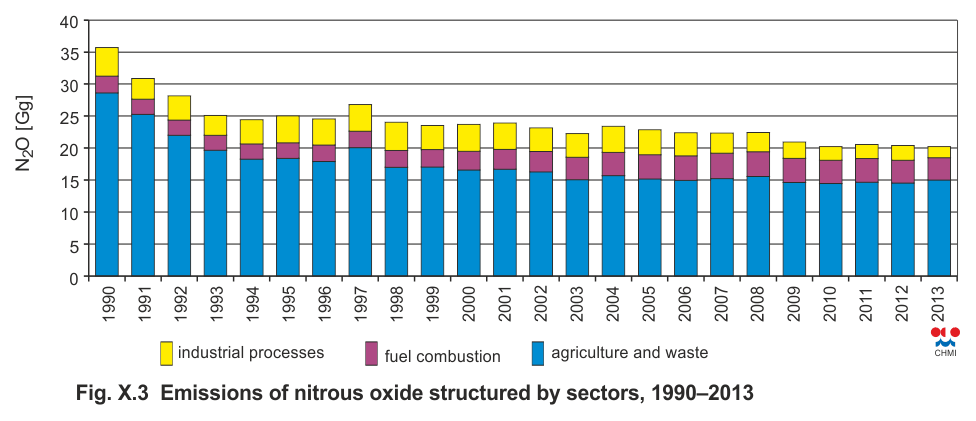
Fig. X.3 |
Emissions of nitrous oxide structured by sectors,
1990–2013 |
|
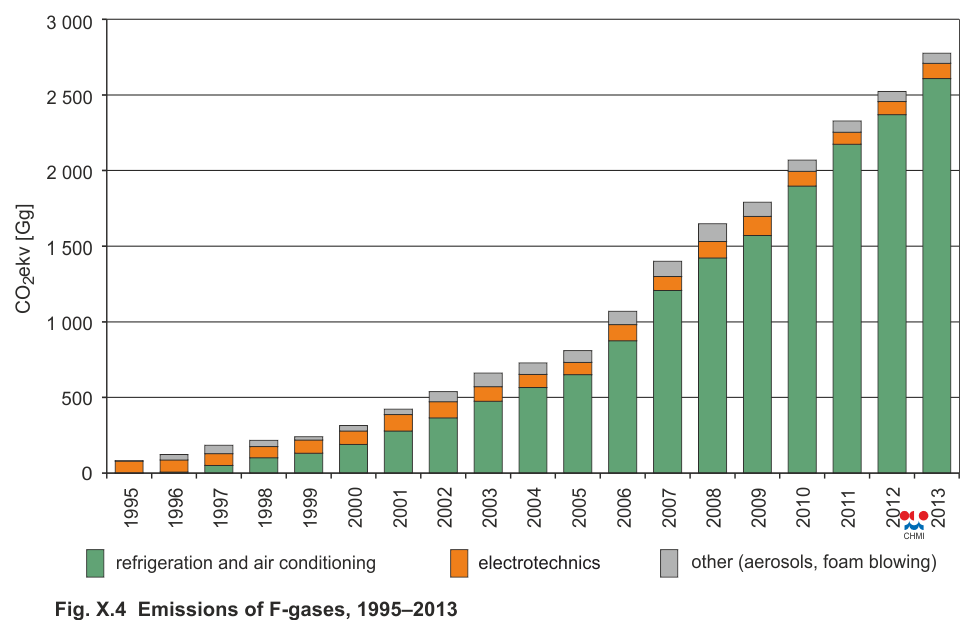
Fig. X.4 |
Emissions of F-gases, 1995–2013 |
|
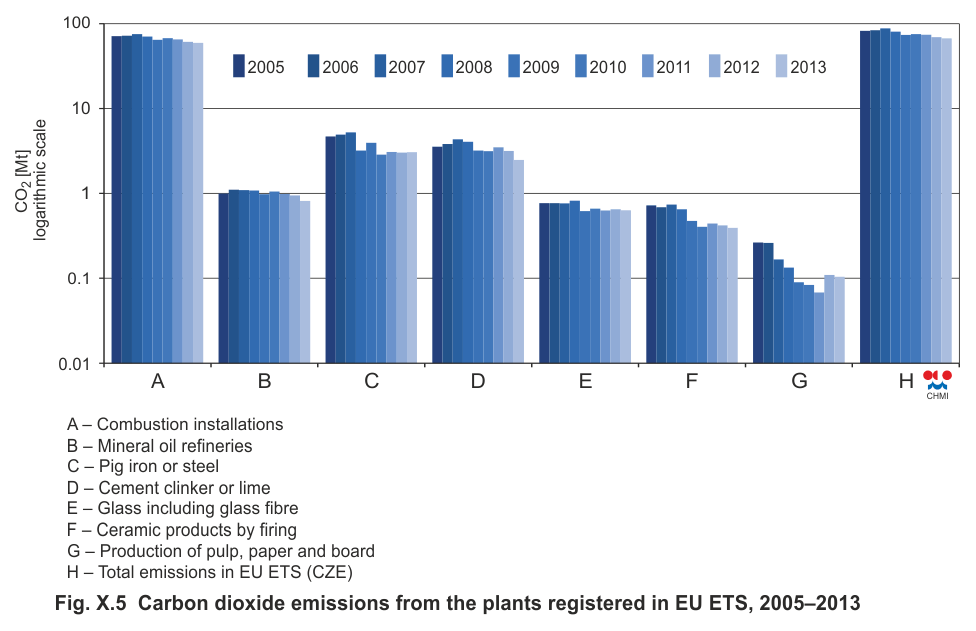
Fig. X.5 |
Carbon dioxide emissions from the plants registered
in EU ETS, 2005–2013 |
|
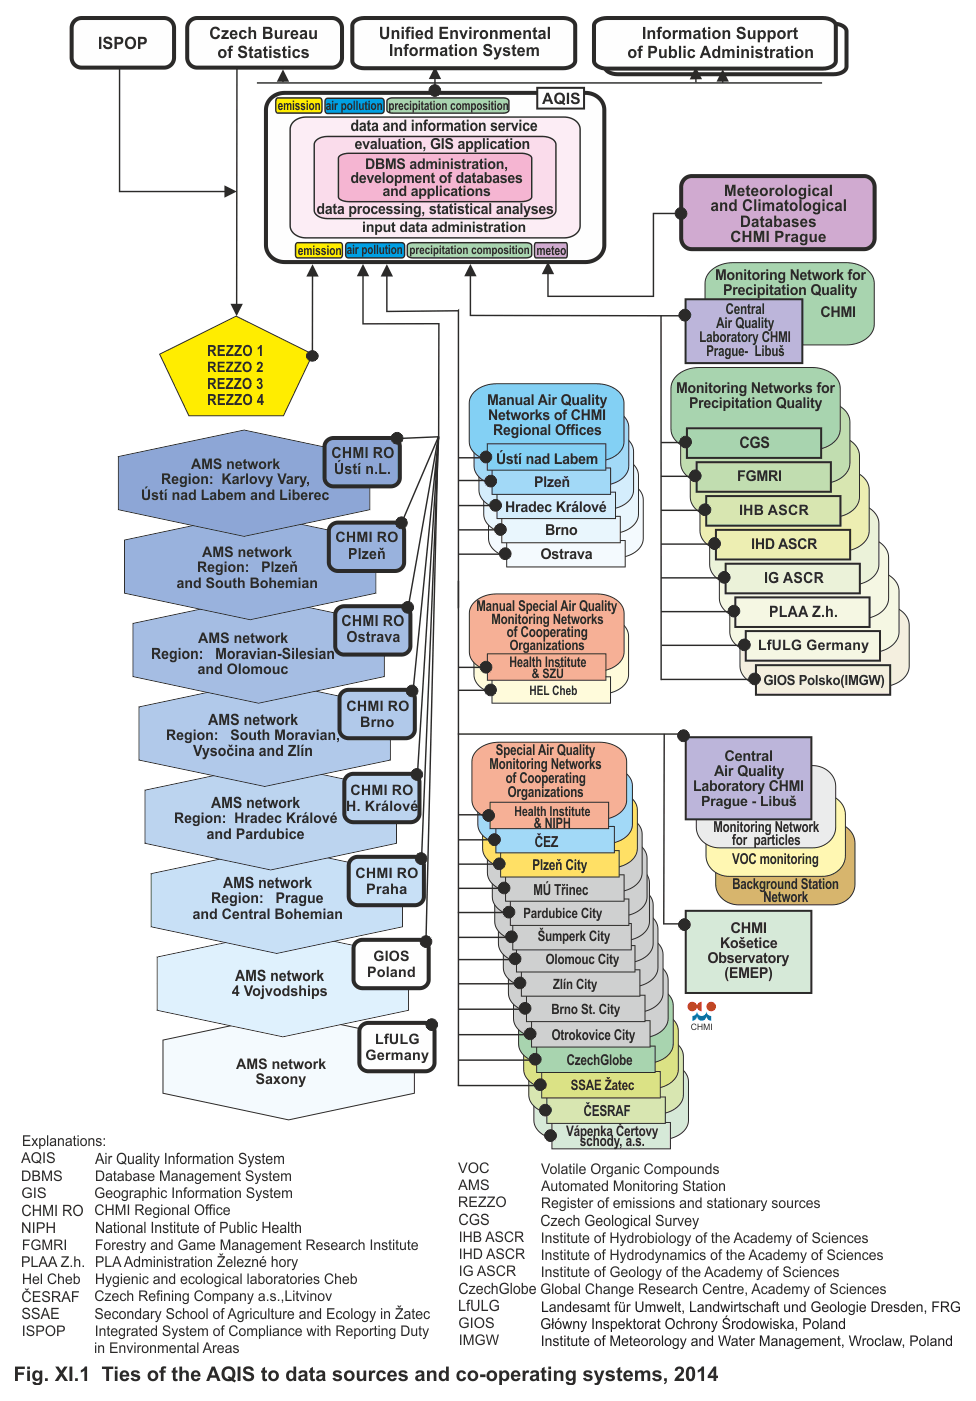
Fig. XI.1
|
Ties of the AQIS to data sources and co-operating
systems, 2014 |
|
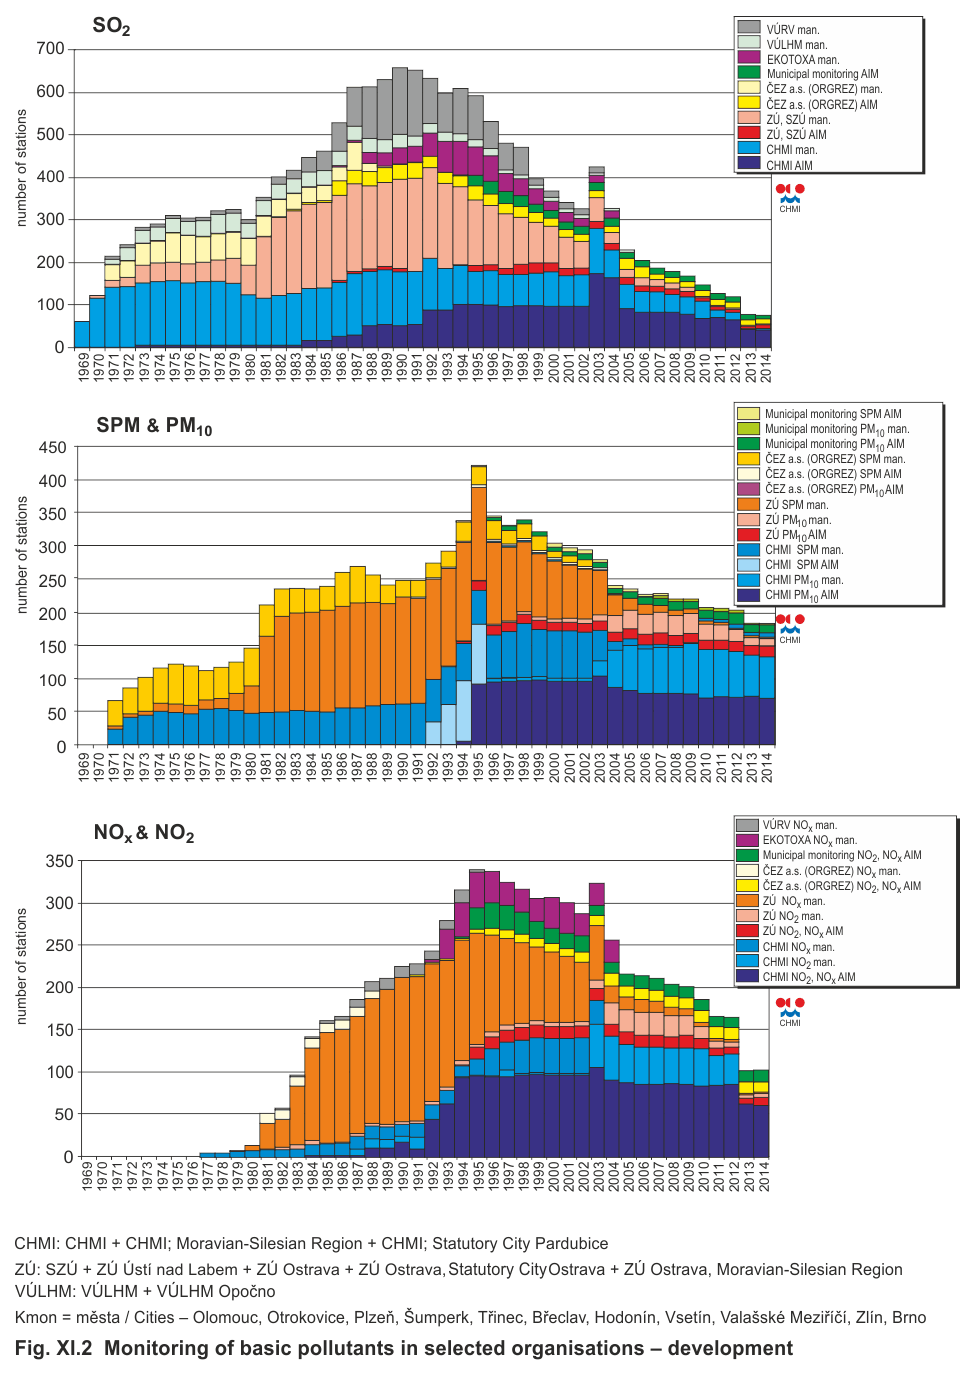
Fig. XI.2 |
Monitoring of basic pollutants in selected
organisations – development |
|
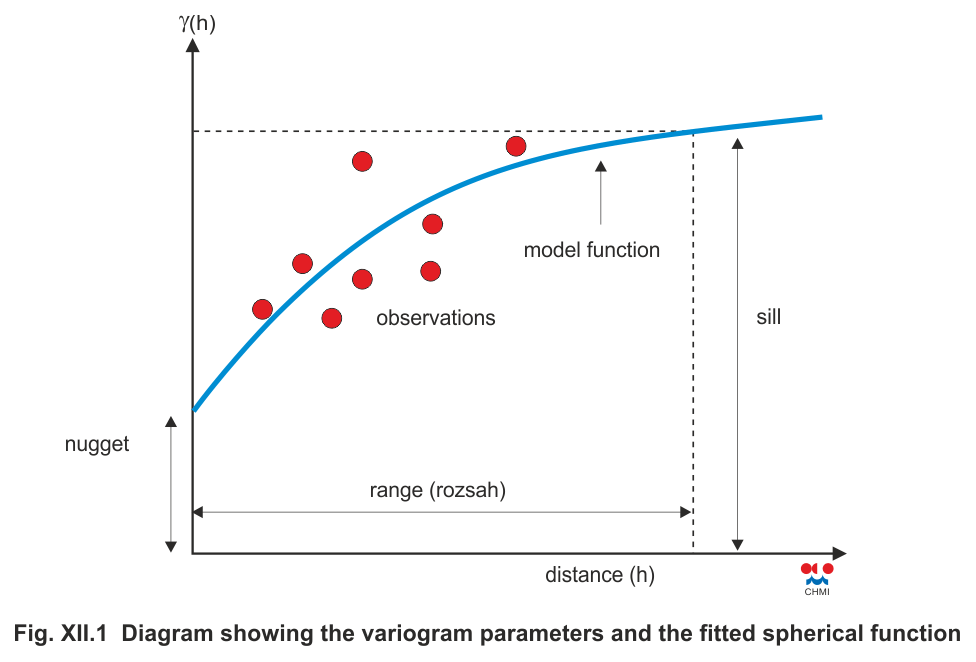
Fig. XII.1 |
Diagram showing the variogram parameters and the
fitted spherical function |
| |
Annex III |
|
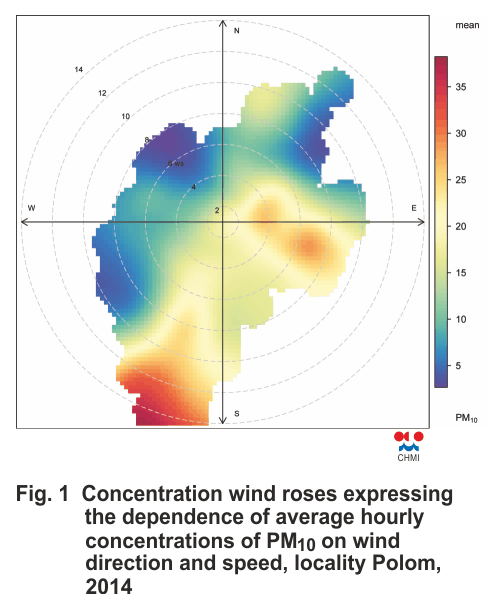
Fig. 1 |
Concentration wind roses expressing the dependence
of average hourly concentrations of PM10 on wind
direction and speed, locality Polom, 2014 |
|
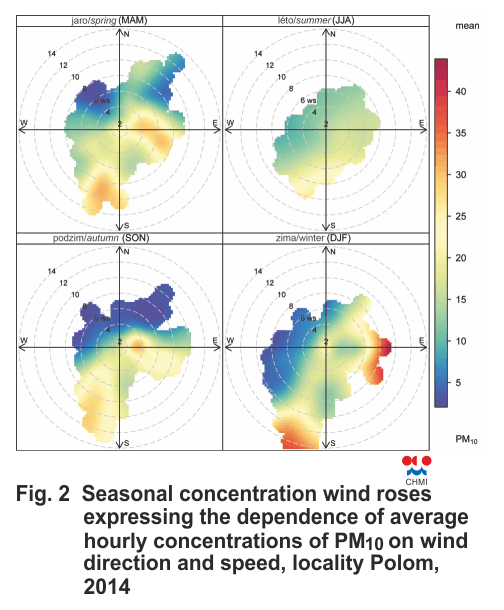
Fig. 2 |
Seasonal concentration wind roses expressing the
dependence of average hourly concentrations of PM10 on
wind direction and speed, locality Polom, 2014 |
|
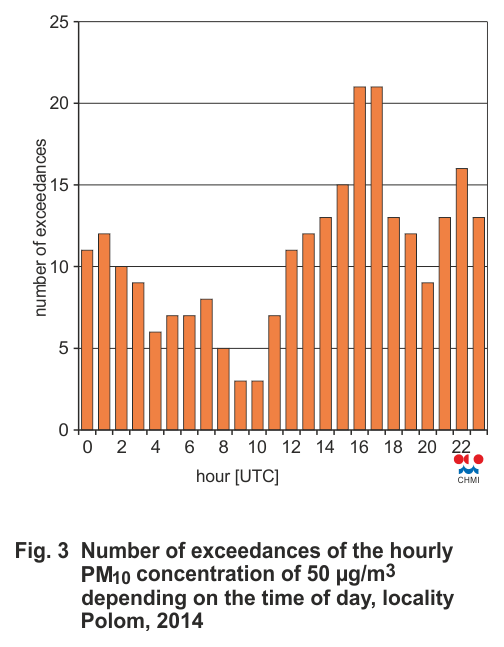
Fig. 3 |
Number of exceedances of the hourly PM10
concentration of 50 µg.m-3 depending on the time of day,
locality Polom, 2014 |
|
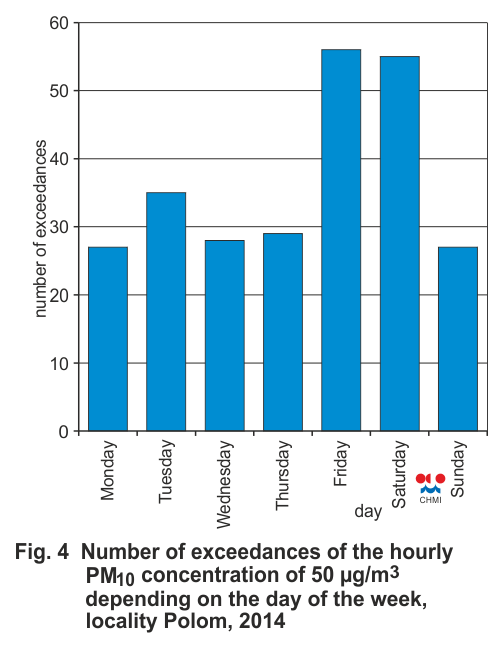
Fig. 4 |
Number of exceedances of the hourly PM10
concentration of 50 µg.m-3 depending on the day of the
week, locality Polom, 2014 |
|
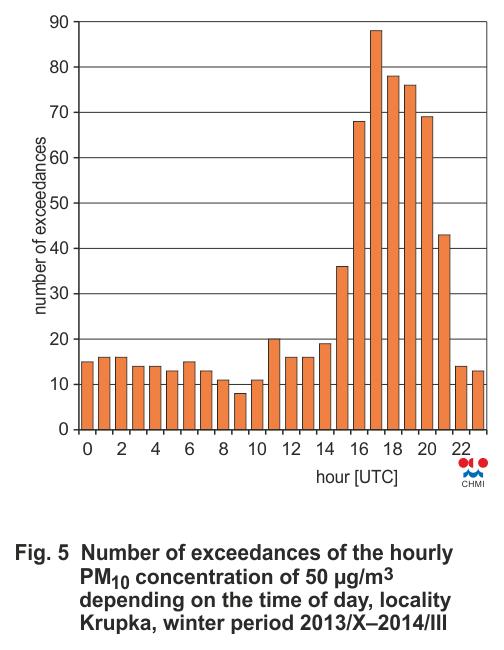
Fig. 5 |
Number of exceedances of the hourly PM10
concentration of 50 µg.m-3 depending on the time of day,
locality Krupka, winter period 2013/X–2014/III |
|
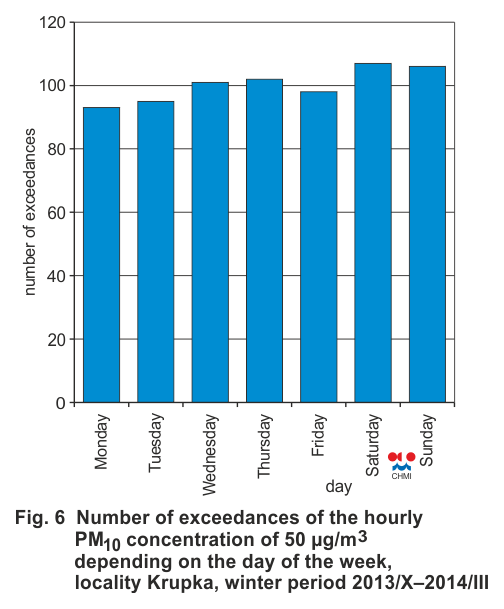
Fig. 6 |
Number of exceedances of the hourly PM10
concentration of 50 µg.m-3 depending on the day of the
week, locality Krupka, winter period 2013/X–2014/III |
|
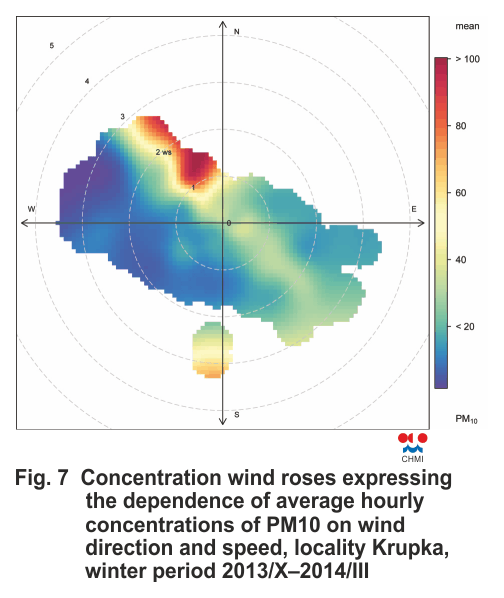
Fig. 7 |
Concentration wind roses expressing the dependence
of average hourly concentrations of PM10 on wind
direction and speed, locality Krupka, winter period
2013/X–2014/III |
|
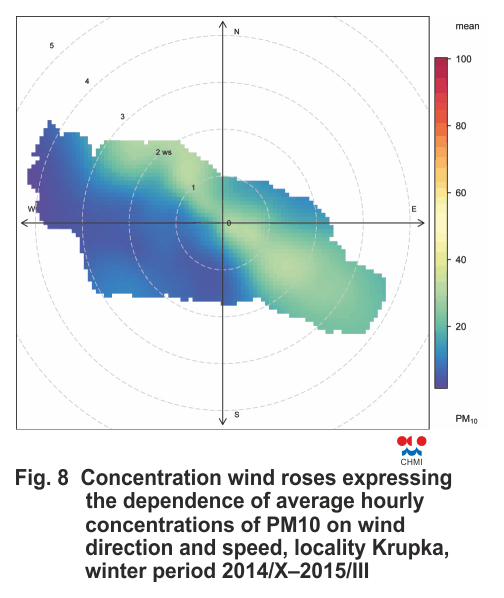
Fig. 8 |
Concentration wind roses expressing the dependence
of average hourly concentrations of PM10 on wind
direction and speed, locality Krupka, winter period
2014/X–2015/III |
| |
Annex IV |
|
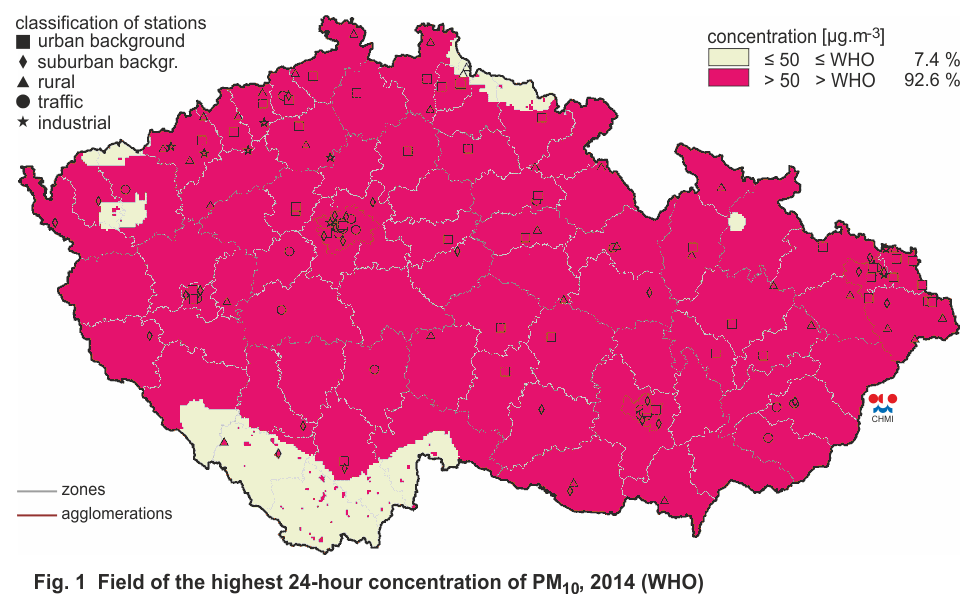
Fig. 1 |
Field of the highest 24-hour concentration of PM10,
2014 (WHO) |
|
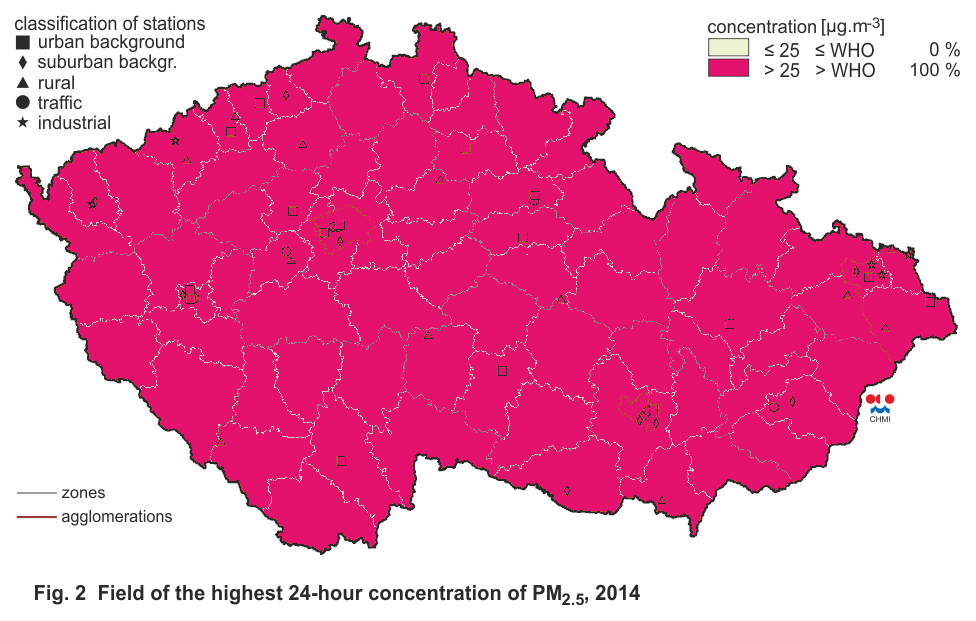
Fig. 2 |
Field of the highest 24-hour concentration of PM2.5,
2014 (WHO) |
|
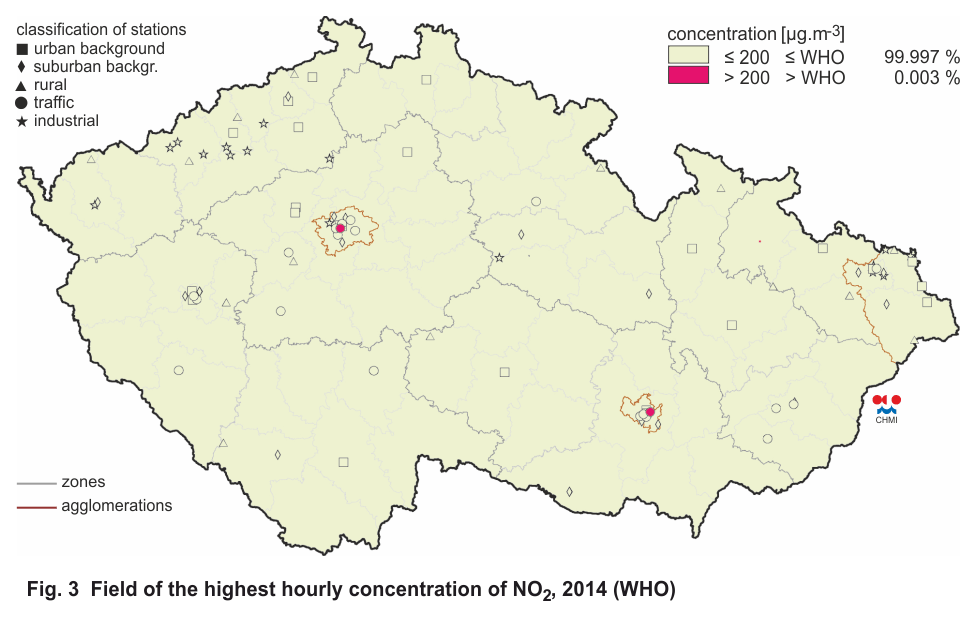
Fig. 3 |
Field of the highest hourly concentration of NO2,
2014 (WHO) |
|
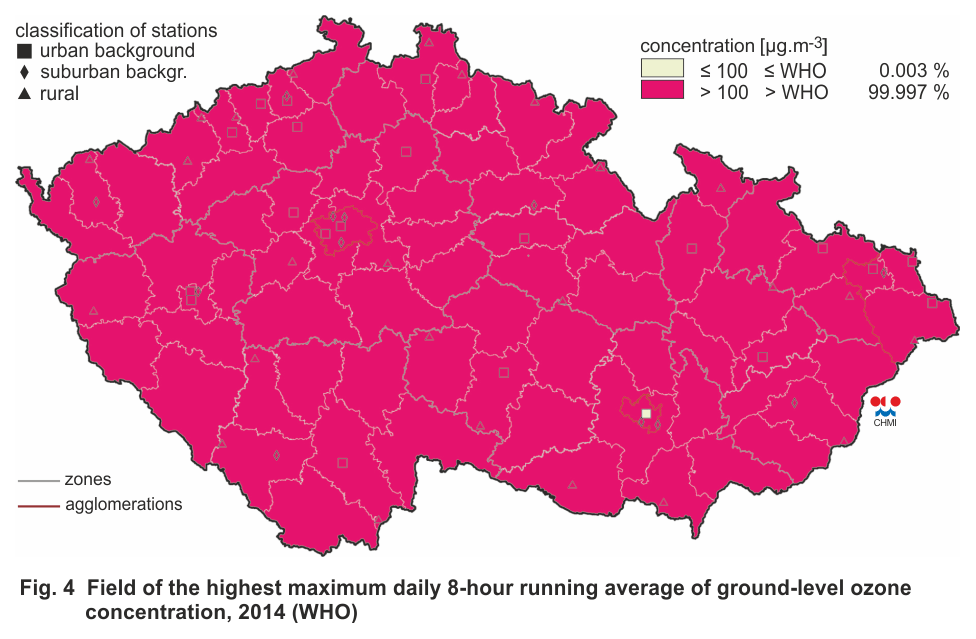
Fig. 4 |
Field of the highest maximum daily 8-hour running
average of ground-level ozone concentration, 2014 (WHO) |
|
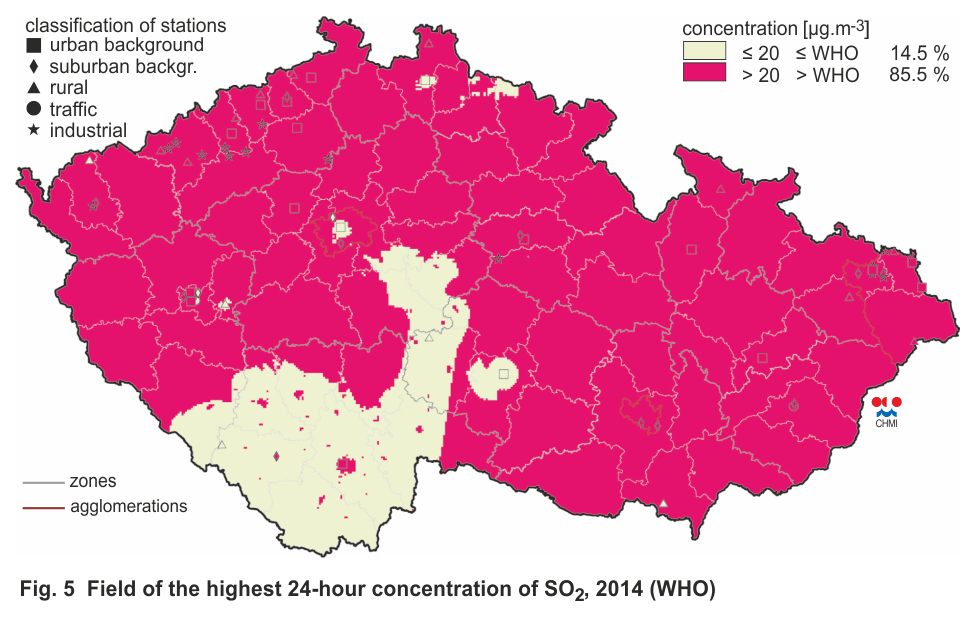
Fig. 5 |
Field of the highest 24-hour concentration of SO2,
2014 (WHO) |