ANNEX IV
MAPS OF POLLUTANT CONCENTRATIONS WITH THE INDICATION OF WHO
GUIDELINE VALUES FOR THE PROTECTION OF HUMEN HEALTH
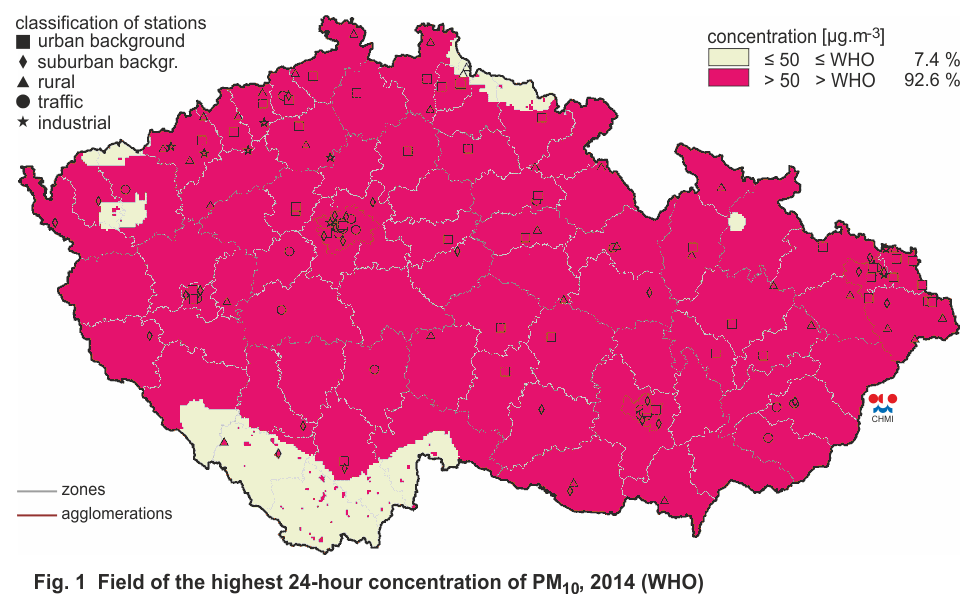
Fig. 1 Field of the highest 24-hour concentration of PM10,
2014 (WHO)
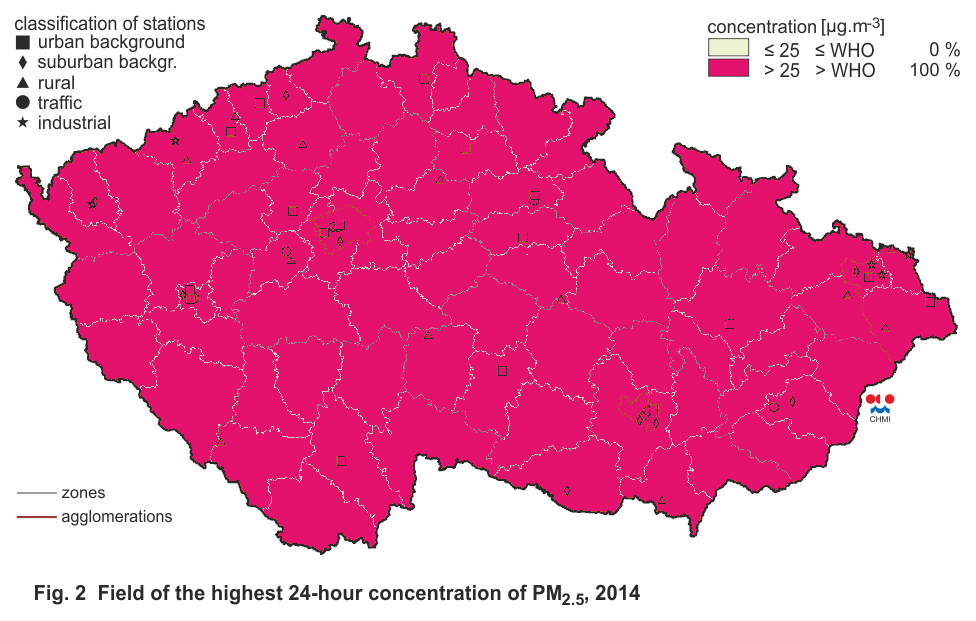
Fig. 2 Field of the highest 24-hour concentration of PM2.5, 2014
(WHO)
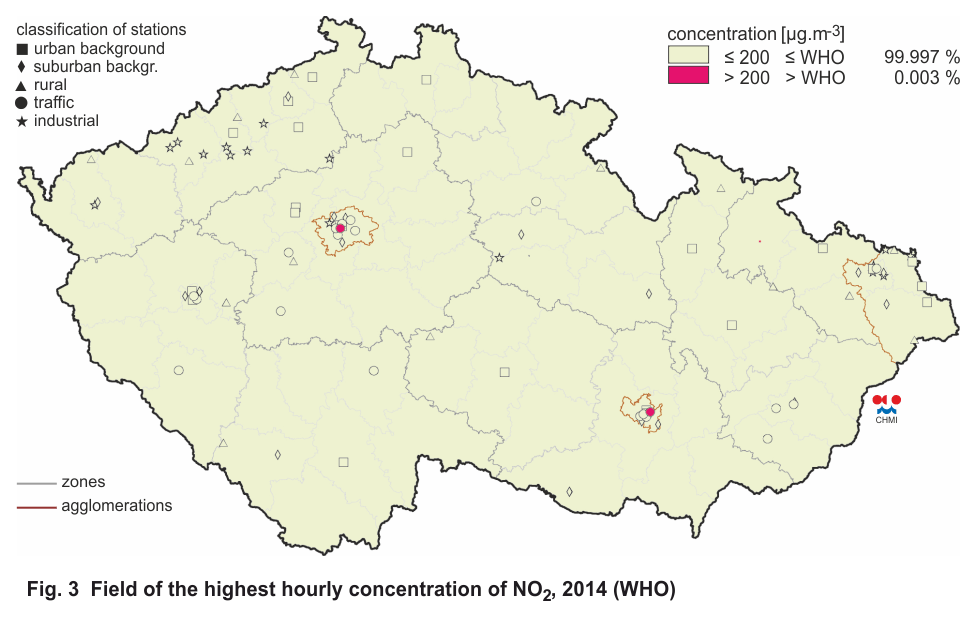
Fig. 3 Field of the highest hourly concentration of NO2, 2014 (WHO)
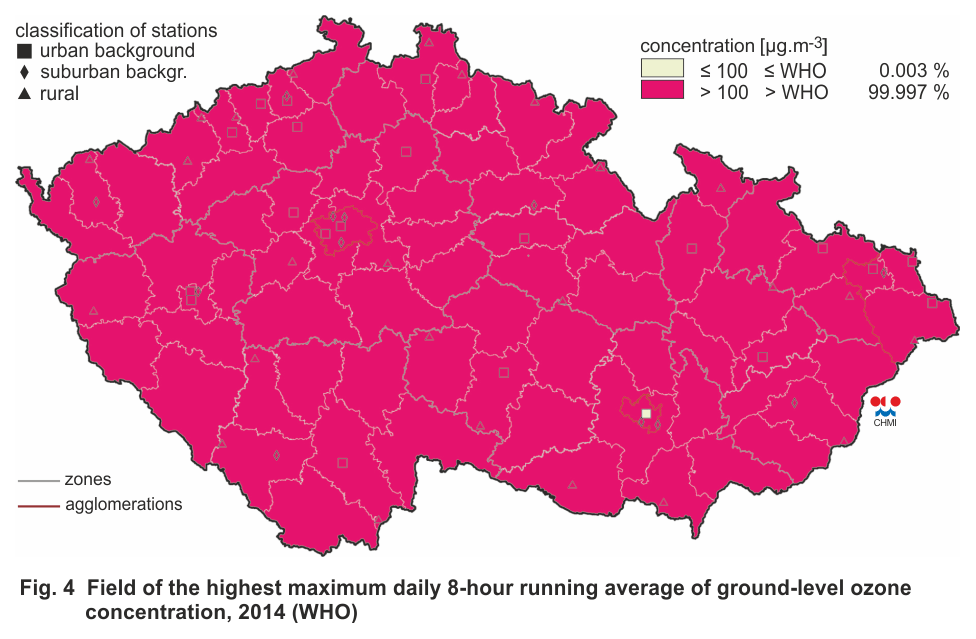
Fig. 4 Field of the highest maximum daily 8-hour running average
of ground-level ozone concentration, 2014 (WHO)
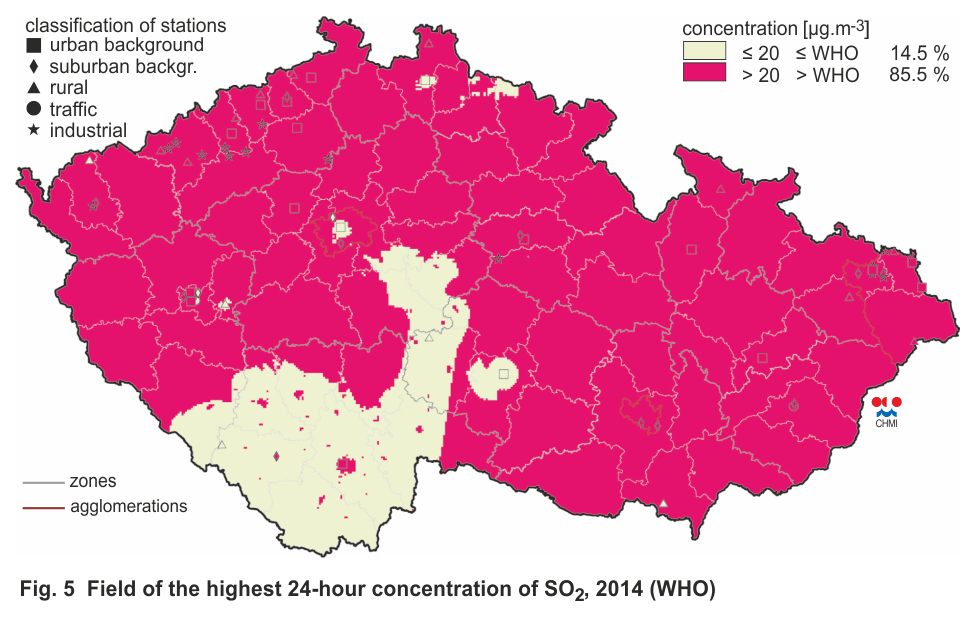
Fig. 5 Field of the highest 24-hour concentration of SO2, 2014
(WHO)