ANNEX III
UTILIZATION OF POLLUTION ROSES
The aim of this annex is to present the benefits of auxiliary meteorological measurements for the interpretation of concentrations measured at automated air pollution monitoring stations (AIM). These measurements can, among other things, be used for improving the accuracy of information about the effects of surrounding pollution sources (e.g. at the station Polom) and to eliminate problems stemming from decreased station representativeness caused by local interference (station Krupka).
One of the tools for interpreting air pollution concentrations measured at AIM stations are pollution roses, which aid analysis of how concentrations depend on the direction and speed of wind. They can be used for localities where meteorological indicators (e.g. wind direction and speed at 10 m above ground level, temperature, relative air humidity, in some cases global solar radiation and precipitations) are measured concurrently with continuous air pollution monitoring. The use of pollution roses is especially suitable for localities where the flow of air is not directly influenced by buildings or other obstacles, and for which it therefore can be assumed that the measured wind direction and speed are representative of a sufficiently large area surrounding a given locality.
Pollution roses are primarily constructed from concentrations of a selected pollutant, wind direction and speed at a given locality over a selected time period (year, season, etc.). Pollution roses split by temperature describe the dependence of measured concentrations not only on wind direction and speed, but also on temperature, thus describing the connection with the intensity of local heating.
Pollution roses can be used for testing hypotheses concerning the transport of a pollutant from a specific direction. They can be used to infer prevailing directions of air flow during periods of elevated concentrations and possibly to estimate more important permanent, seasonal or temporary sources of pollution in the close vicinity of a station. This can be used to verify or increase the representativeness of stations through effective measures for reducing emissions. One useful instrument, supplementing the information obtained from pollution roses, are plots of the number of exceedances of a selected concentration value depending on the time of day or the day of the week. This information is useful, for example, for identifying the sources of regularly occurring high pollutant concentrations.
Locality Polom
The AIM station Polom in the village of Sedloňov commenced its measurements on 23. October 2013 after being moved from the original locality Šerlich in the Orlické Mountains. With regard to the fact that the station is located in an environment that is not exposed to significant anthropogenic pollution, it is classified as a regional rural background station. Resulting measured concentrations of monitored pollutants are regarded as representative of the region within the range of tens to hundreds of kilometres.
The CHMI utilizes the Polom station to monitor concentrations of nitrogen oxides, ground-level ozone and suspended PM10 particles. In the past, concentrations of these pollutants were monitored in the long term also at the station Šerlich. Due to the similar location of both localities and the character of the measuring stations, a certain degree of similarity within the range of measured concentrations was assumed. A comparison of the development of average hourly concentrations of suspended PM10 particles, however, revealed occasional episodes of higher concentrations of PM10, and sudden increases in concentrations of this pollutant were detected at both stations.
For the purpose of analysing the air quality situation in more detail, wind roses were constructed from hourly concentrations of PM10 for the year 2014 (a total of 8,193 valid values were used).
The pollution rose for the year 2014 (Fig. 1) shows that the highest concentrations of PM10 were recorded during air flow from the SSW direction (prevailing direction of air flow) and wind speeds of over 10 m.s-1. The location of the village of Sedloňov, located about 1.3 km away, corresponds to this wind direction. Higher concentrations were also measured during lower air flow speeds (under 8 m.s-1) from the E direction, where lies the building of the Military Geographic and Hydrometeorological Office (ca 25 m away), and then from the SE direction, where lies a seasonally inhabited country house (ca 150 m away).
A closer analysis of seasonal pollution roses (Fig. 2) shows that in summer concentrations are distributed evenly in all wind directions (the SSW direction is slightly prevailing). Significantly higher concentrations during air flow from the SSW and E directions were detected from autumn until spring. A higher number of exceedances in afternoon and evening hours as well as over Friday and Saturday is markedly apparent from auxiliary plots of the number of exceedances of the suspended PM10 particle concentration of 50 µg.m-3 depending on the time of day (Fig. 3) and the number of exceedances of the PM10 value of 50 µg.m-3 depending on the day of the week (Fig. 4). These results indicate a more pronounced effect of local combustion sources in the village of Sedloňov and seasonally utilized nearby country houses significantly influence the concentrations of suspended PM10 particles measured at the Polom station during the course of the heating season.
Locality Krupka
The AIM station Krupka on the SE side of the Krušné hory Mts. has been operated by the CHMI since 12. 6. 1992. It is a rural background station of suburban character, with a regional representativeness on the order of tens of kilometres. Due to its location, it is also included in the Smog Warning and Regulation System (SWRS). Concentrations of SO2 and suspended PM10 particles are continuously monitored at this station.
In cold months (October – March) of seasons 2012/2013 to 2013/2014, numerous high hourly average concentrations of PM10, which during maximum concentrations even exceeded 500 µg.m-3, were proven by measurements made at this locality. Most such episodes occurred in late afternoon or evening hours, which was demonstrated by an analysis of the number of exceedances of the PM10 concentration of 50 µg.m-3 depending on the time of day over the period 2013/X – 2014/III (Fig. 5). The plot of the number of exceedances of the PM10 concentration of 50 µg.m-3 in dependence on the day of the week for the same period (Fig. 6) shows higher concentrations on Saturdays and Sundays, but this difference compared to other days of the week is not crucial. It could therefore be assumed that the local combustion source was operated daily. The increase in average hourly concentrations of PM10 was often accompanied by an increase of average hourly concentrations of SO2. A direct effect of a single local source was confirmed by local investigation. This source was the heating system of a nearby house, located about 80 m to the NW of the station. The house is owned by the town of Krupka.
Because this local interference significantly decreased the representativeness of the Krupka station, a meeting took place between representatives of the local authority and the CHMI. As a measure against this interference, the original solid fuel furnace in the house was replaced by a new furnace belonging to the 3rd emission class at the beginning of the heating season of 2014/2015.
A comparison of pollution roses representing concentrations of suspended PM10 particles in dependence on wind direction and speed for the period 2013/X – 2014/III (Fig. 7) a 2014/X – 2015/III (Fig. 8) shows that the counter-measure has been effective. In the period 2013/X – 2014/III, a marked field of high concentrations of PM10, caused by a local combustion source, is apparent from the NW direction of air flow. For the following season of 2014/X – 2015/III, i.e. after the implementation of the measure, the field of concentrations is distributed more evenly during air flow from all directions, and the maximum concentrations of PM10 measured are markedly lower than in previous periods. Although the house, situated to the NW of the station, remains a significant source, its influence is now comparable to that of other parts of the Krupka town located to the SE of the station. The measure has been effective. The locality Krupka now meets the requirements for representativeness as well as the criteria for stations included in the SWRS. We thank the council of the town of Krupka for the good will with which it approved and ensured the replacement of the furnace and associated modifications to the building.
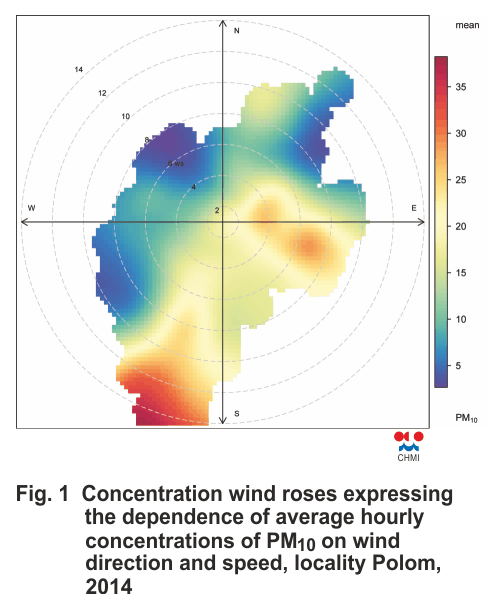
Fig. 1 Concentration wind roses expressing the dependence of
average hourly concentrations of PM10 on wind direction and
speed, locality Polom, 2014
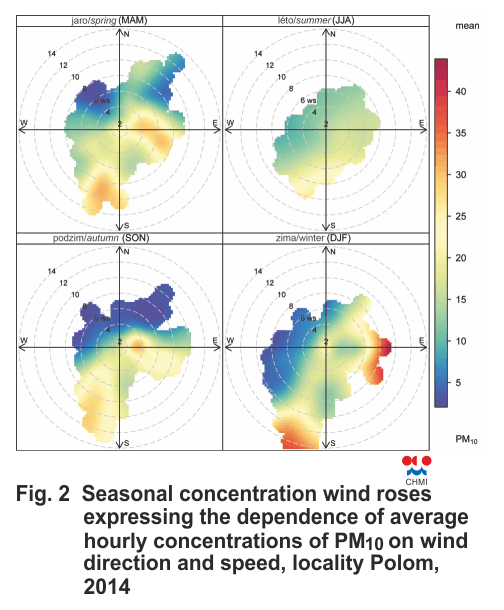
Fig. 2 Seasonal concentration wind roses expressing the
dependence of average hourly concentrations of PM10 on wind
direction and speed, locality Polom, 2014
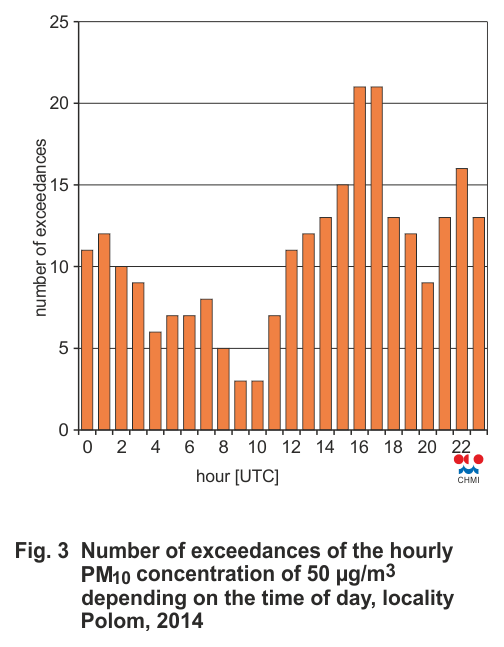
Fig. 3 Number of exceedances of the hourly PM10 concentration of
50 µg.m-3 depending on the time of day, locality Polom, 2014
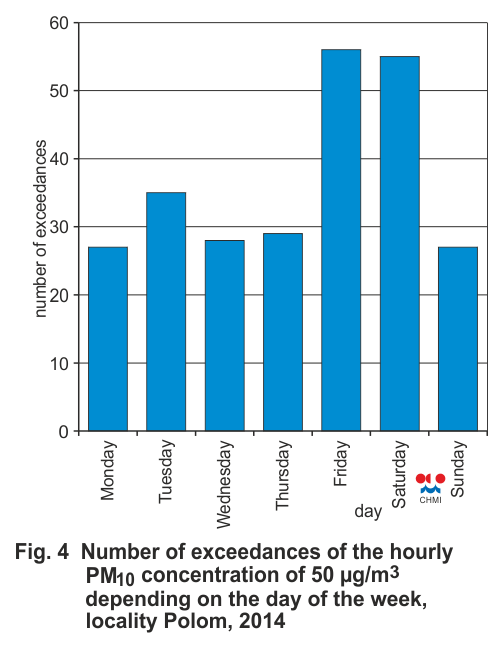
Fig. 4 Number of exceedances of the hourly PM10 concentration of
50 µg.m-3 depending on the day of the week, locality Polom, 2014
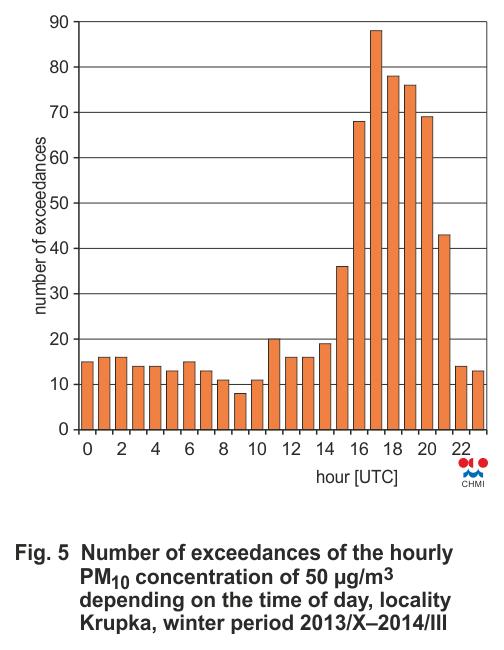
Fig. 5 Number of exceedances of the hourly PM10 concentration of
50 µg.m-3 depending on the time of day, locality Krupka, winter
period 2013/X–2014/III
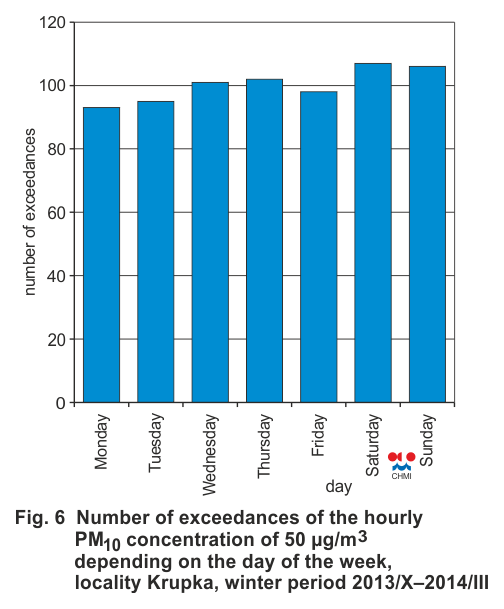
Fig. 6 Number of exceedances of the hourly PM10 concentration of
50 µg.m-3 depending on the day of the week, locality Krupka,
winter period 2013/X–2014/III
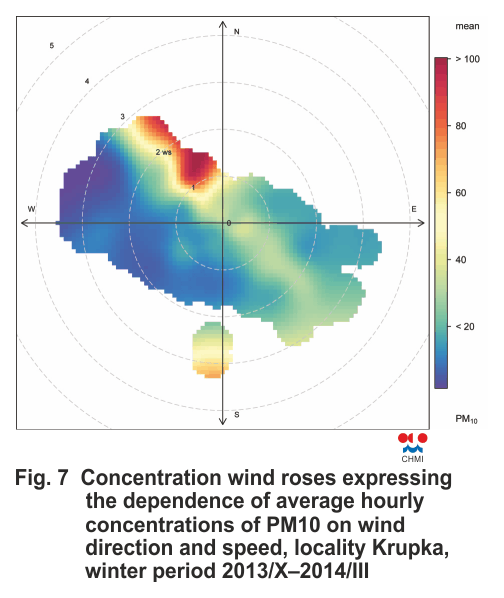
Fig. 7 Concentration wind roses expressing the dependence of
average hourly concentrations of PM10 on wind direction and
speed, locality Krupka, winter period 2013/X–2014/III
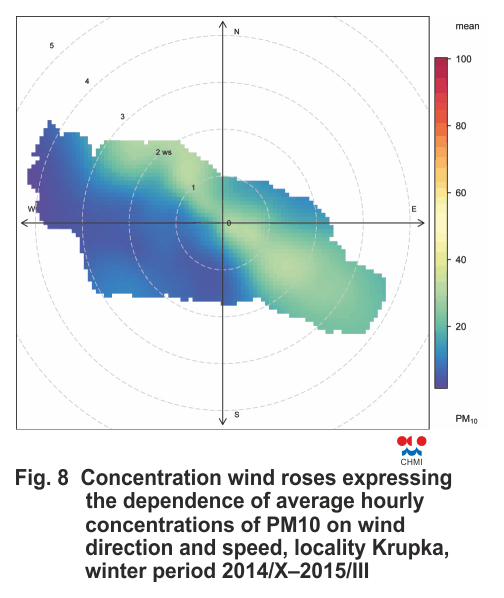
Fig. 8 Concentration wind roses expressing the dependence of
average hourly concentrations of PM10 on wind direction and
speed, locality Krupka, winter period 2014/X–2015/III