IX. ATMOSPHERIC DEPOSITION IN THE CZECH REPUBLIC
Atmospheric deposition is the flow of substances from the atmosphere to the Earth’s surface (Braniš, Hůnová 2009). It is an important process contributing to self-cleaning of air. On the other hand, it enables pollutants to enter other components of the environment. Atmospheric deposition is divided into wet deposition and dry deposition. Wet deposition is connected with the occurrence of atmospheric precipitation (vertical deposition: rain, snow, and horizontal deposition: fog, rime), so it is episodic in character. The dry component represents the deposition of gases and particles through different mechanisms and is a continuous process.
The quantification of total atmospheric deposition is very important for the study of its effects on the environment. There is a significant difference in the quantification of individual components with regard to the level of difficulty of the method and the reliability of the obtained results. Of all the components of atmospheric deposition, wet vertical deposition is relatively the easiest to measure (Krupa 2002), while there is no available method for the direct measurement of dry deposition, and thus it is necessary to estimate it with the use of various, usually relatively complicated, approaches (Wesely, Hicks 2000; Kumar et al. 2008). The most difficult to measure is horizontal deposition (e.g. Krupa 2002; Klemm, Wrzesinsky 2007). It is measured only exceptionally, and actual deposition, with regard to this component, is usually considerably underestimated (Bridges et al. 2002; Hůnová et al. 2011).
Atmospheric deposition in Europe has decreased significantly over the recent twenty years; however, in a number of regions it still continues to be a problem (EEA 2011). Chemical composition of precipitation and atmospheric deposition have been monitored in the long term at a relatively large number of stations in the Czech Republic. Time trends and changes in spatial distribution of major components of deposition, i.e. sulphur and nitrogen, for the whole monitoring period have been published in Hůnová et al. (2004; 2014).
In 2014 the Air Quality Information System (AQIS) database obtained data on precipitation quality from a total of 44 localities (16 CGS, 14 CHMI, 8 VÚLHM and 6 HBI ASCR). Further, data from five German localities in boundary areas were submitted by the LfULG, and data from five Polish localities were submitted by the GIOS organization. CHMI and LfULG stations in most cases measure wet-only samples in weekly intervals (the monthly interval was switched over to the weekly interval in 1996 in line with the EMEP methodology). Further, from 1997 until 2010, the weekly precipitation sampling, ‘bulk’ type (with non-specified content of dustfall), for heavy metals analysis was carried out at these stations. Since 2011 the analyses of heavy metals at CHMI stations have been carried out based on wet-only precipitation sampling, and ‘bulk’-type sampling was abandoned. At the monitoring localities of other organizations, monthly sampling (or irregular sampling) is being used for measuring open-area (or throughfall) concentrations in precipitation (‘bulk’ type). Detailed information on individual localities and sampling types is presented in Table IX.4.
Wet deposition charts were compiled for selected ions on the
basis of all-round chemical analyses of wet only precipitation
samples, specifically for SO42--S, NO3--N,
NH4+-N, H+ (pH), Cl-, Pb2+, Cd2+ and Ni2+.
The above ions were selected to represent deposition fields with
regard to their considerable impact on the various spheres of
the environment. Wet deposition charts for each of the ions were
derived from the field of ion concentrations in precipitation (based
on annual mean concentrations weighted by precipitation totals
calculated from the data observed), and from the field of annual
precipitation totals calculated from data obtained by 750
precipitation gauging stations, taking into account the effect
of altitude on the amount of precipitation. When constructing
wet deposition fields, results of wet-only samples analysis are
preferred to ‘bulk’ samples with dustfall, and weekly samples
are preferred to monthly samples. Data from the network stations
operated by the CGS, VÚLHM and GIOS, which are based on monthly
‘bulk’ sampling with dustfall (Table IX.4) are modified by
empirical coefficients expressing the individual ions’ ratios in
‘wet-only’ and ‘bulk’ samples (values for each of the ions from
0.74 for NH4+ to 1.06 for H+) for the purpose of developing wet
deposition charts. The fact that in the case of H+ cations the
ratio is higher than 1 can be explained as follows: Solid
particles contained in ‘bulk’-type samples react with hydrogen
cations, which results in their decreasing concentration (Ranalli
et al. 1997).
In addition to wet deposition, also dry deposition charts are presented for sulphur, nitrogen, hydrogen ions, lead and cadmium. Maps of total annual deposition are presented for sulphur, nitrogen and hydrogen ions.
Dry sulphur and nitrogen deposition was calculated using fields of annual mean SO2 and NOx concentrations for the Czech Republic, and the deposition rates for SO2 of 0.7 cm.s-1/0.35 cm.s-1 and NOx of 0.4 cm.s-1/0.1 cm.s-1 were calculated for forested/unforested areas (Dvořáková et al. 1995).
Total deposition charts were produced by adding together S and N wet and dry deposition. The wet hydrogen ion deposition chart was compiled on the basis of pH values measured in precipitation. Dry hydrogen ion deposition reflects SO2 and NOx deposition based on stoichiometry, assuming their acidity in the environment. The total hydrogen ion deposition chart was created by the summation of wet and dry deposition charts. Average deposition fluxes of S, N and H are presented in Table IX.1.
The throughfall sulphur deposition chart was generated for forested areas based on the field of sulphur concentrations in throughfall and a verified field of precipitation, which was modified by the percentage of precipitation amounts measured below the canopy at each station (60–95 % of precipitation totals in open areas for the year 2014). Throughfall deposition generally includes wet vertical and horizontal deposition (from fogs, low clouds and rime) and dry deposition of particles and gases in forests. In the case of sulphur, whose circulation within forests is negligible, it should provide a good estimate of total deposition.
The fields of dry deposition of Pb and Cd contained in SPM (dry Pb and Cd deposition) were derived from the fields of these metals’ concentrations in the ambient air (or on the basis of the air pollution field of annual average of PM10 concentrations and values of IDW interpolation of the shares of the respective metal in dust). The deposition rate of Cd contained in SPM was taken as 0.27 cm.s-1 for forested and 0.1 cm.s-1 for unforested terrain; the figures for Pb are 0.25 cm.s-1 for forested and 0.08 cm.s-1 for unforested terrain (Dvořáková et al. 1995).
In 2014 the colour range in the legend to the map of the field of wet annual deposition of hydrogen ions was changed due to low deposition, for which the previous colour range was no longer suitable.
The data on precipitation quality are controlled routinely using the method of ion balance calculation. The difference between the sum of cations and the sum of anions in a sample should meet the allowable criteria, which differ slightly in various organizations.
Further checks are carried out by comparing calculated conductivity and measured conductivity, both of which should also meet the allowable criteria. Analysis of blank laboratory samples is also used, and blank field samples are monitored and assessed continuously. This enables the checking of work during sampling and the control for changes occurring due to transport, manipulation, storage and preparation of samples prior to their chemical analysis.
Results
Precipitation in the year 2014 for the territory of the Czech Republic was slightly below the long-term normal; on average it amounted to 657 mm, which represents 97 % of the long-term normal (for the years 1961–1990). As compared with the year 2013 (727 mm), the total precipitation was lower.
Wet sulphur deposition decreased after 1997 below 50,000 t, and this trend continued up until 1999. In 1999–2005 the values remained more or less at the level of the year 1999, with the exception of lower depositions in 2003, when subnormal total precipitation was recorded (516 mm, i.e. 77 % of the long-term normal). The decreasing trend has continued since 2005. In 2014 the level of wet sulphur deposition in the territory of the Czech Republic amounted to 22,090 t (as compared with 22,136 t in 2013). In 2014 the highest values of wet sulphur deposition were recorded in mountainous areas, namely in the Krušné hory Mts., the Moravskoslezské Beskydy Mts., the Jeseníky Mts. and the Krkonoše Mts. (Fig. IX.2).
Similarly, dry sulphur deposition exhibited its most significant decrease between the years 1997 and 2000. In the following years, the field of dry deposition remained more or less at the same level (Fig. IX.20), which is coherent with SO2 concentrations in the ground-level ambient air. In 2014 dry sulphur deposition in the territory of the Czech Republic reached 28,058 t, and the highest values were recorded in the Krušné hory Mts. (Fig. IX.3).
The field of total sulphur deposition represents the sum of wet and dry deposition, yielding the total sulphur deposition of 50,148 t for the Czech Republic’s territory for the year 2014 (Table IX.2). After the previous decrease from the values markedly above 100,000 t in 2000–2006, sulphur deposition remained within the range of 65,000 to 75,000 t per year, with the exception of the year 2003, which was markedly below normal as far as precipitation is concerned. Since 2007 the value of total sulphur deposition has amounted to around 50,000 t of sulphur for the Czech Republic’s territory (Fig. IX.20). Total sulphur deposition reached its maximum values in the Krušné hory Mts. area and the Ostrava area (Fig. IX.4).
Throughfall sulphur deposition in 2014 reached its maximum values in the mountainous areas (Fig. IX.5). In some parts of the mountains in the Czech Republic, the values of throughfall deposition reach, in the long-term, higher values than the values of total sulphur deposition determined as the sum of wet (only vertical) and dry deposition of SO2. The increased contribution can be attributed to deposition from fog, low clouds and rime (horizontal deposition), which is not included in total summary deposition because of uncertainties. Rime and fog are normally highly concentrated and may significantly contribute to the deposition of sulphur and other elements in mountainous areas and areas with frequent fogs (valley fogs, fogs near water courses and lakes). The problem resides in the very erratic character of this type of deposition from place to place, and certain uncertainties may occur when extrapolating to a wider area. For sulphates, the deposition from fogs and rime in mountain areas is reported to be in the range 50–90 % of the “bulk” type deposition in the average for a longer period lasting several years (Tesař et al. 2000; Tesař et al. 2005). In some individually assessed years, the ratio between the deposition of sulphates from fog and rime to “bulk” type deposition even exceeded 100 %.
Throughfall deposition further includes the contribution from dry deposition of S from SO42- contained in suspended particles. Based on the data on sulphate concentrations in aerosol for the year 2014 from two stations (Churáňov and Košetice) and on the application of the deposition rate of 0.25 cm.s-1 (Dvořáková et al. 1995), dry deposition of S from SO42-reached the average value of 0.04 g.m-2.year-1 for forested areas (Churáňov = 0.026 g.m-2.year-1, Košetice = 0.058 g.m-2.year-1). Due to the limited number of localities monitoring sulphate concentrations in aerosol, this is a very rough estimate.
The map of throughfall deposition can be regarded as an illustration of the values that total sulphur deposition (including horizontal deposition and dry deposition of S from SO42-in suspended particles) can reach, because in sulphur, unlike in other pollutants, internal circulation in vegetation is negligible (Draaijers et al. 1997).
Since 2008 throughfall deposition is calculated with the use of a ZABAGED geodatabase layer, provided by the Czech Office for Surveying, Mapping and Cadastre – COSMC, with a finer grid of 500x500 m, where the total forested area is 26,428 km2. Therefore, also total values of throughfall deposition since 2001 were recalculated with the use of the new layer of forests in order to carry out the comparison with the data after the year 2007 (Table IX.3). Throughfall sulphur deposition on the forested surface of the Czech Republic reached 12,836 t in 2014.
Wet deposition of both reduced (N/NH4+) and oxidized (N/NO3-) forms of nitrogen decreased in comparison with the year 2013. The maximum values of wet deposition of oxidized forms were reached in the territory of the Orlické hory Mts. (Fig. IX.6), while the maximum values of wet deposition of reduced forms were recorded in the territory of the Krušné hory Mts., the Krkonoše Mts. and the Moravskoslezské Beskydy Mts. (Fig. IX.7). The highest values of total wet nitrogen deposition (the sum of wet depositions of N/NH4+ and N/NO3-) were recorded in the Krkonoše Mts., the Hrubý Jeseník Mts. and the Moravskoslezské Beskydy Mts. (Fig. IX.8).
The development of dry deposition of oxidized forms of nitrogen had a declining trend up to the year 2002 (when the value reached 48 % of the value of the average for the years 1995–1997). No such marked trend is apparent in the following years. These fluctuations of annual amounts of deposition are connected with the limit values of NOx in the troposphere. In 2014 dry deposition in the territory of the Czech Republic slightly decreased compared to the year 2013. The highest values were reached in big cities and along major communications (Fig. IX.9).
In 2014 the total nitrogen deposition reached 64,931 t of N. year-1 for the area of the Czech Republic (Table IX.2). It is apparent that in comparison with the year 2013 (69,693 t.year-1) it decreased. The highest values of total nitrogen deposition were reached in the the Krušné hory Mts., in big cities (Prague, Brno, Ostrava) and along the most loaded communications, mainly the D1 highway (Fig. IX.10).
Wet deposition of hydrogen ions has markedly decreased since 1996, the beginning of the monitoring period. The lowest value was reached in 2014. The decrease in wet deposition was probably caused by lower annual total precipitation compared to the year 2013. In 2014 the value of annual wet deposition of hydrogen ions in the territory of the Czech Republic amounted to 409 t.year-1 (as against 680 t in 2013). The highest values were reached in the Šumava Mts., the Jizerské hory Mts., the Krušné hory Mts. and the Moravskoslezské Beskydy Mts. (Fig. IX.11). The map of dry deposition of hydrogen ions is similar in character to maps for previous years. The maximum values were reached in the Krušné hory Mts. and in the territory of the Moravia-Silesia region (Fig. IX.12). There was an overall increase in dry deposition from 2,745 t.year-1 in 2013 to 3,215 t.year-1 in 2014. In the second half of the 90s of the last century, both wet and dry depositions of hydrogen ions decreased by 50 % per the whole area of the Czech Republic, the decrease of dry deposition of hydrogen ions values was in coherence with the decrease of dry deposition of SO2 - S and NOx - N (Fig. IX.20).
After the year 2000, when the distribution of leaded petrol was finished, the values of the deposition of lead ions markedly decreased. Wet deposition of lead remained at the same level as in 2013 in the whole territory of the Czech Republic. The highest values were reached in the Krušné hory Mts., the Krkonoše Mts., the Hrubý Jeseník Mts. and the Moravskoslezské Beskydy Mts. (Fig. IX.15). Dry deposition of lead ions in 2014 decreased compared to the year 2013. The highest values were reached in Ostrava and the Moravskoslezské Beskydy Mts. (Fig. IX.16).
Both wet and dry deposition of cadmium ions decreased as compared with the year 2013 (Figs. IX.17 and IX.18). The most marked decrease of wet deposition values was recorded at the locality U dvou louček in the Orlické hory Mts. Following last year’s five-fold increase, wet deposition at this locality returned to normal values. However, the cause of the relatively marked increase in 2013 so far has not been explained.
The annual wet deposition of nickel ions increased in 2014 in comparison with the year 2013. The highest values were again reached at the locality Pluhův bor. This was probably caused by very specific undersoil (serpentine) with high content of nickel and magnesium (Krám et al. 2009). A large increase was detected at the localities Lesní potok, Litavka and Loukov (Fig. IX.19).
Wet deposition of chloride ions increased as compared with the year 2013. Similarly as in other monitored pollutants, wet deposition of chloride ions within the Czech Republic reaches higher values in the mountainous areas, reaching maximum values in the Orlické hory Mts. and the Hrubý Jeseník Mts. (Fig. IX.14).
The development of annual wet deposition of the main elements as measured at selected stations in the Czech Republic (Fig. IX.22) after the decrease of wet deposition of several components (mainly sulphates, hydrogen ions and lead ions) in the second half of the 90s tends to be stagnating. The decrease of sulphate deposition was apparent both at the relatively exposed suburban stations and at background stations, e.g. Košetice and Svratouch.
With the development of sulphur and nitrogen deposition, the development of the proportion of both elements can be observed in atmospheric precipitation connected with the development of emissions of individual pollutants (Fig. IX.21). Since the second half of the 90s, a slight increase of nitrates and sulphates proportion has been observed at some stations.
Tab. IX.1 Average deposition fluxes S, N and H in the Czech
Republic, 2014
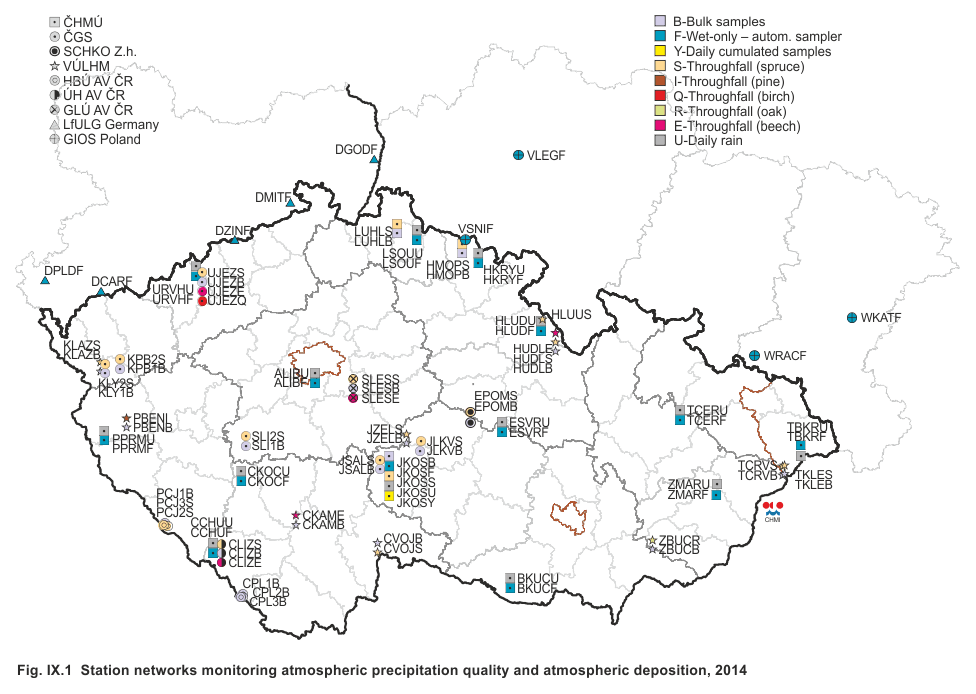
Fig. IX.1 Station networks monitoring atmospheric
precipitation quality and atmospheric deposition, 2014
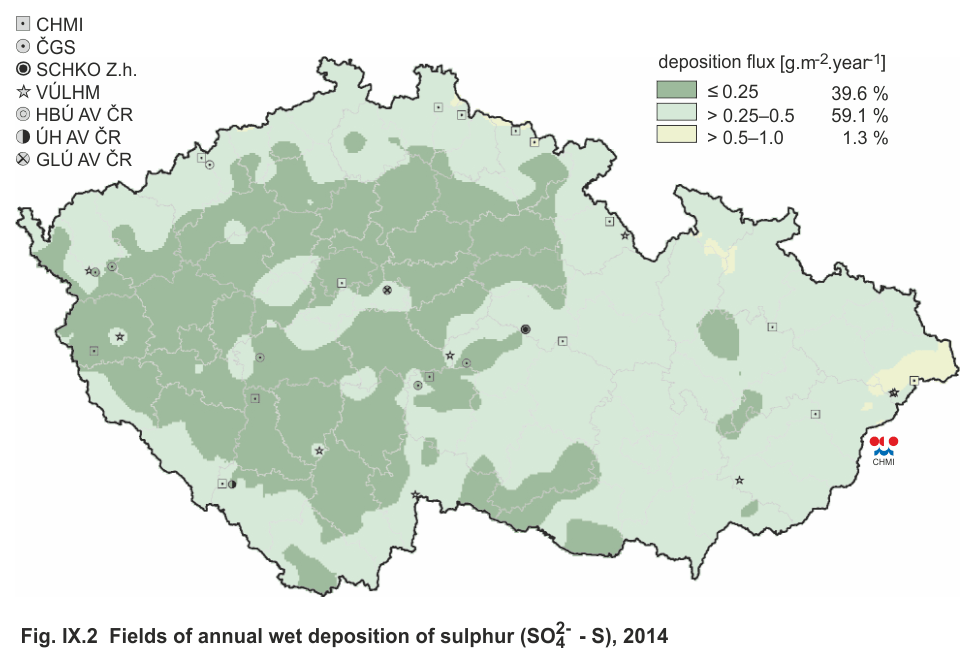
Fig. IX.2 Fields of annual wet deposition of sulphur (SO42- -
S), 2014
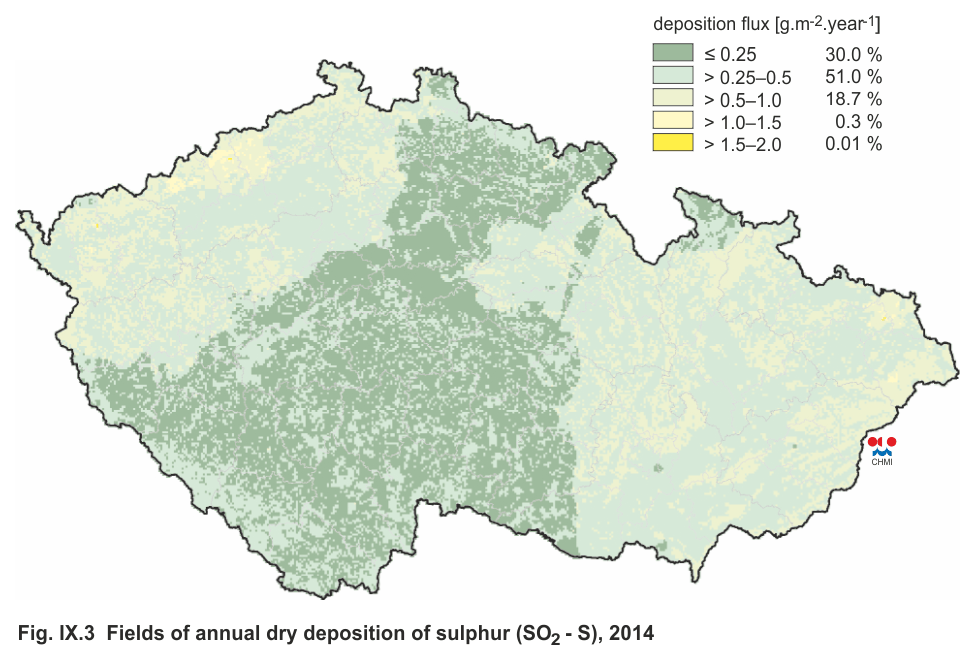
Fig. IX.3 Fields of annual dry deposition of sulphur (SO2 - S),
2014
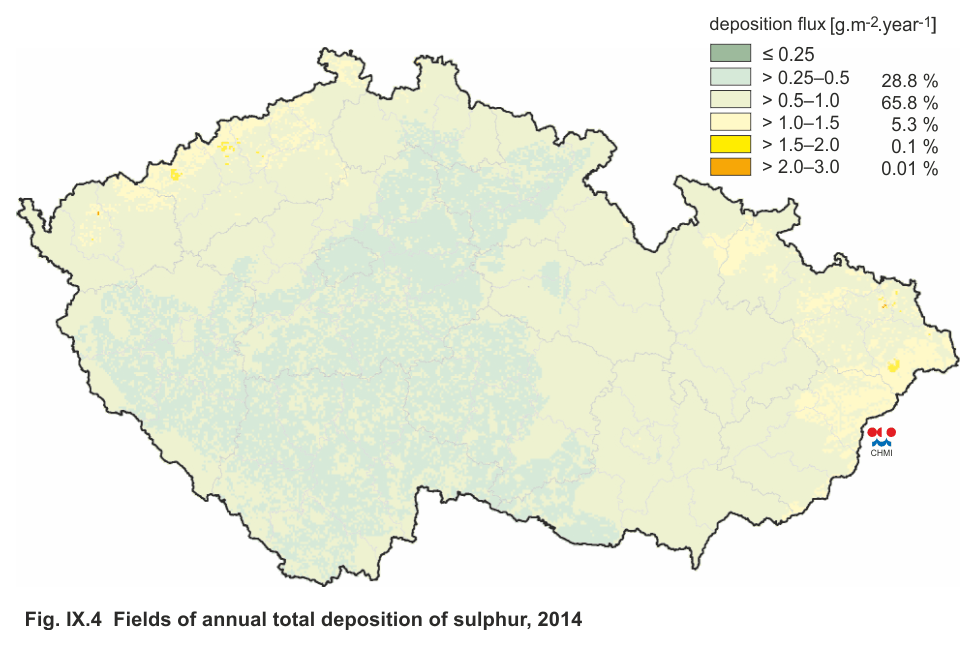
Fig. IX.4 Fields of annual total deposition of sulphur, 2014
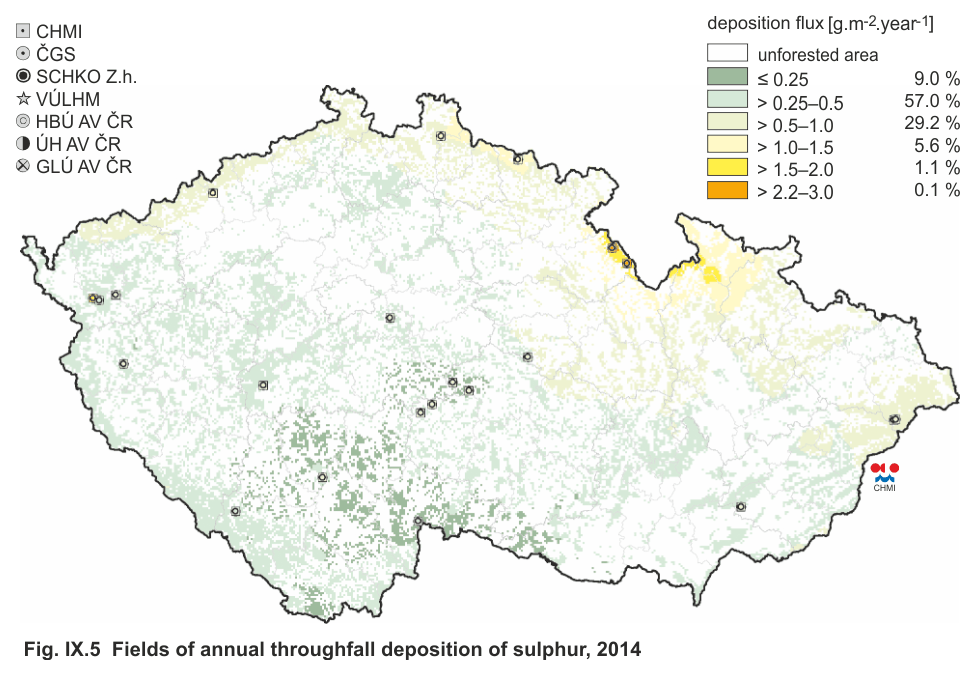
Fig. IX.5 Fields of annual throughfall deposition of sulphur,
2014
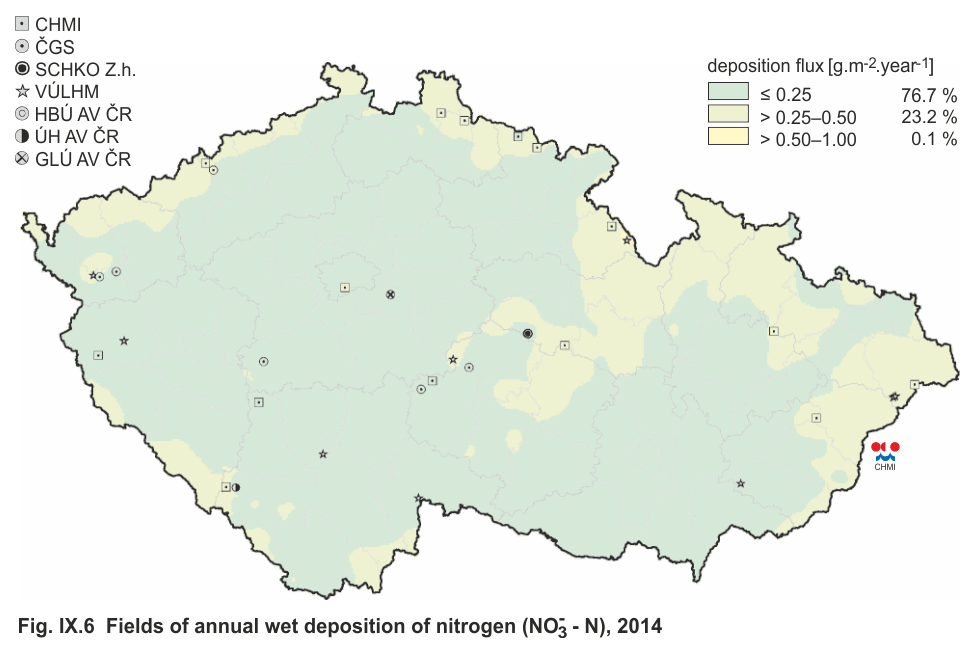
Fig. IX.6 Fields of annual wet deposition of nitrogen (NO3- -
N), 2014
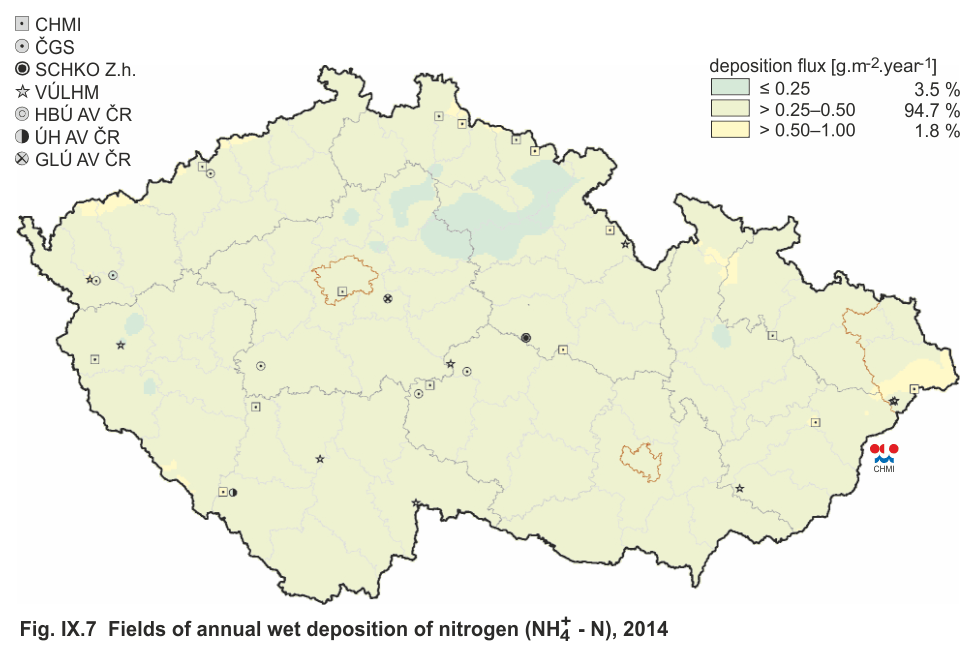
Fig. IX.7 Fields of annual wet deposition of nitrogen (NH4+ -
N), 2014
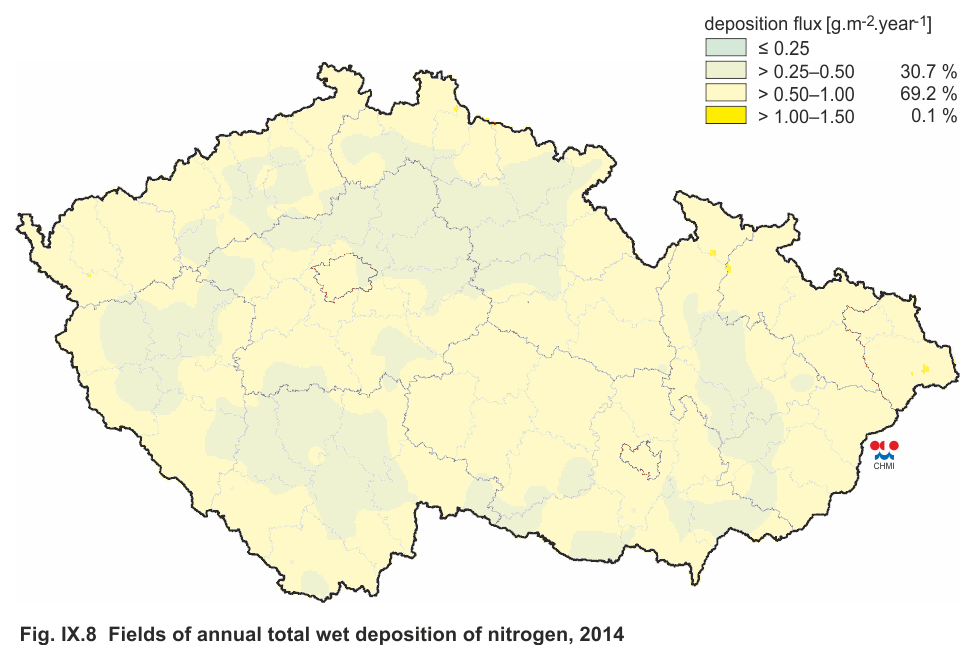
Fig. IX.8 Fields of annual total wet deposition of nitrogen,
2014
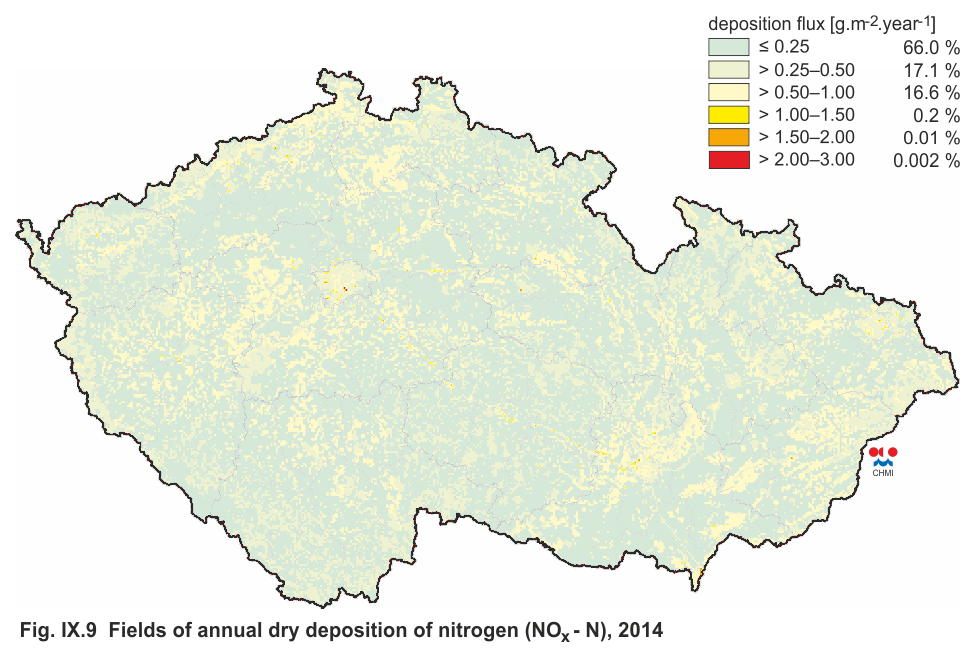
Fig. IX.9 Fields of annual dry deposition of nitrogen (NOx - N),
2014
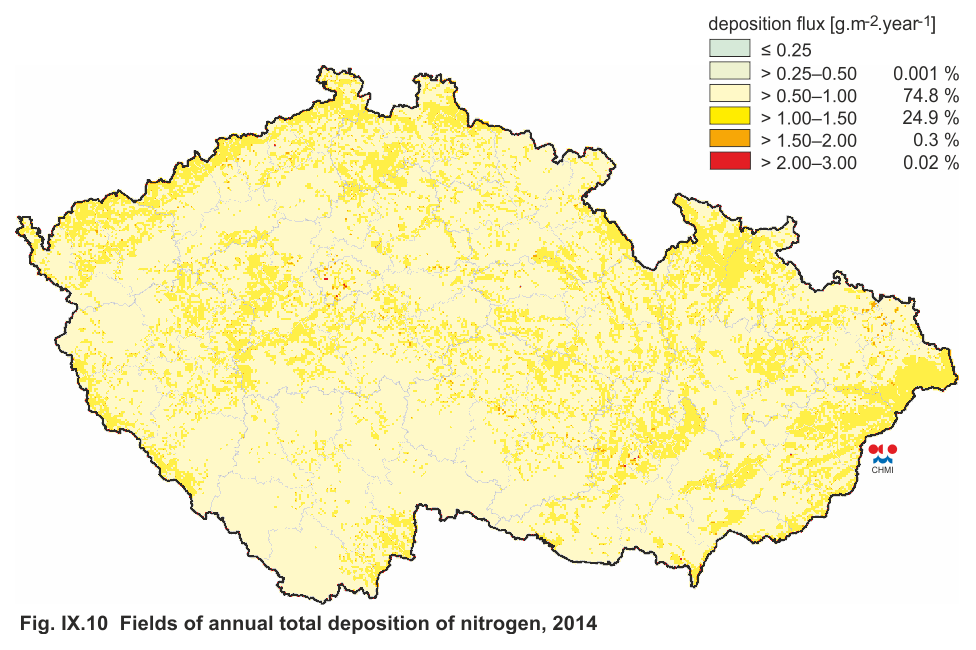
Fig. IX.10 Fields of annual total deposition of nitrogen, 2014
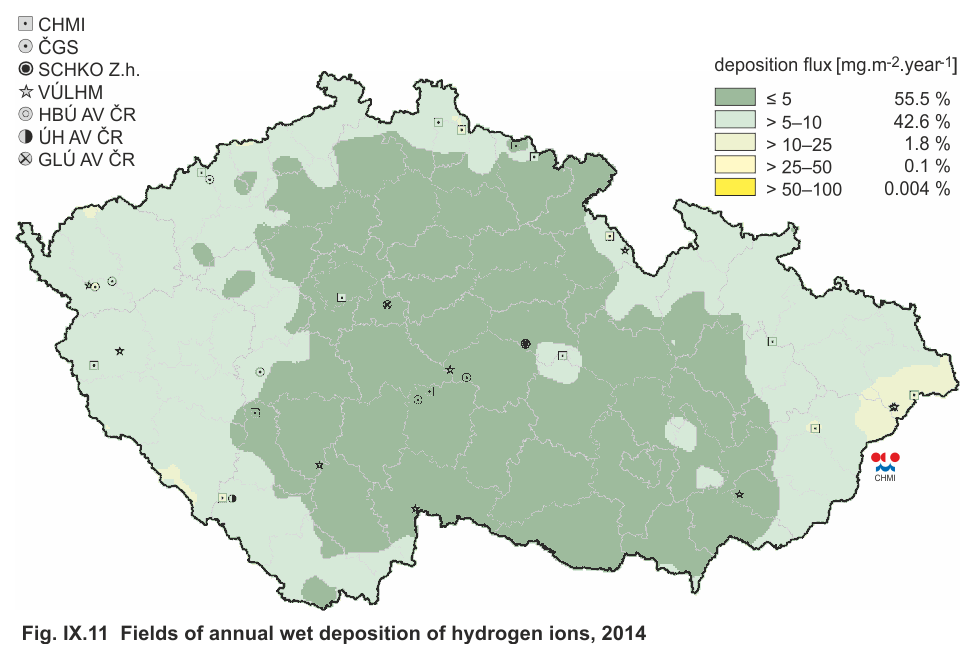
Fig. IX.11 Fields of annual wet deposition of hydrogen ions,
2014
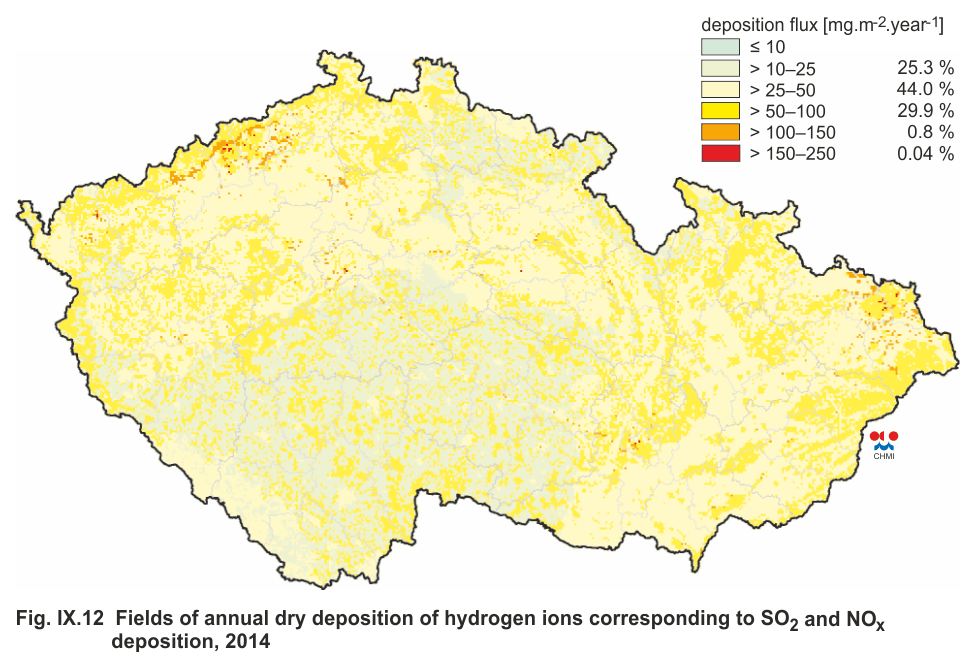
Fig. IX.12 Fields of annual dry deposition of hydrogen ions
corresponding to SO2 and NOx deposition, 2014
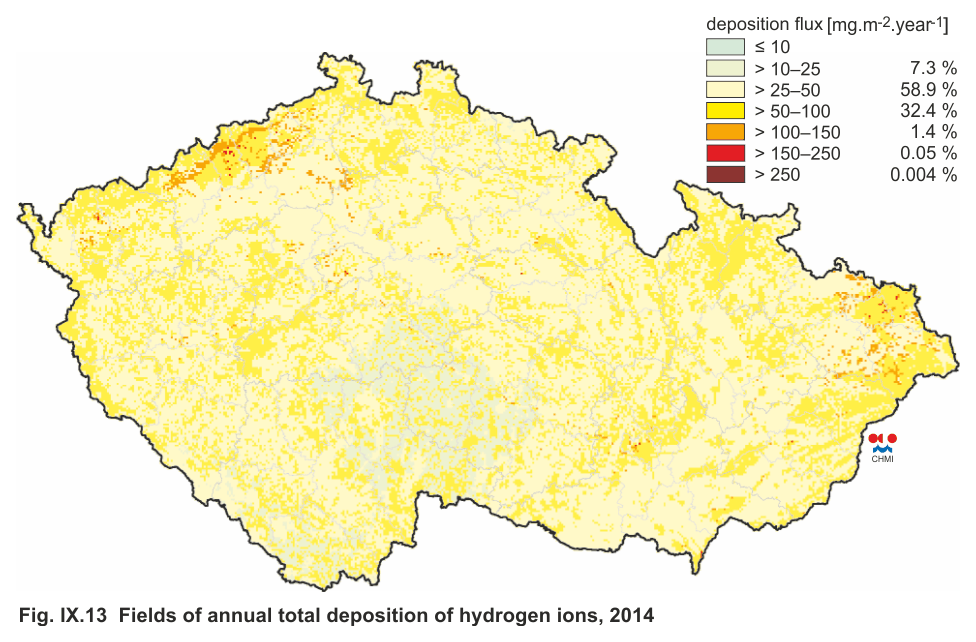
Fig. IX.13 Fields of annual total deposition of hydrogen ions,
2014
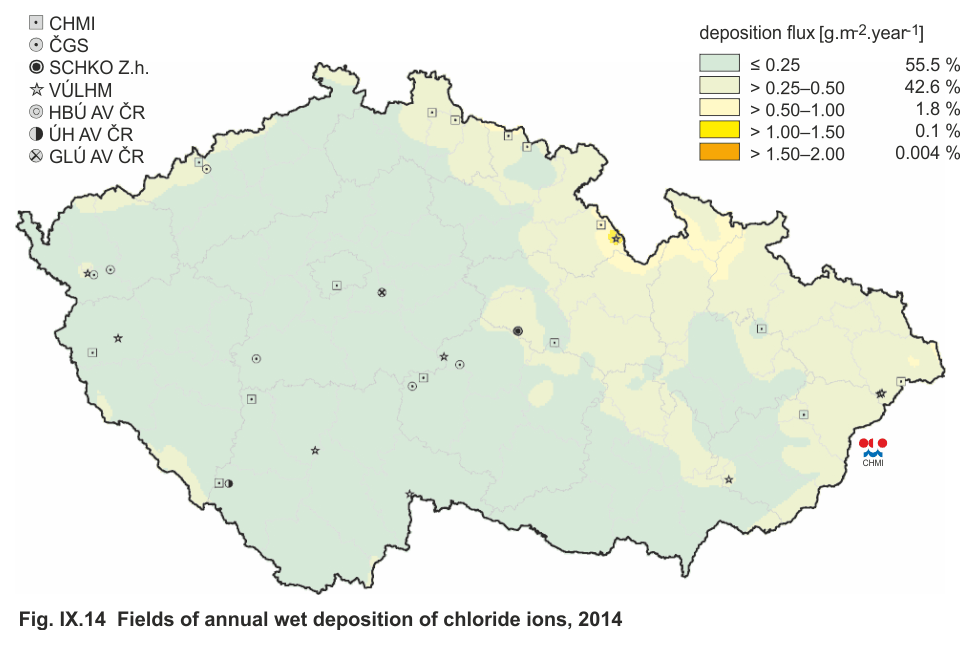
Fig. IX.14 Fields of annual wet deposition of chloride ions,
2014
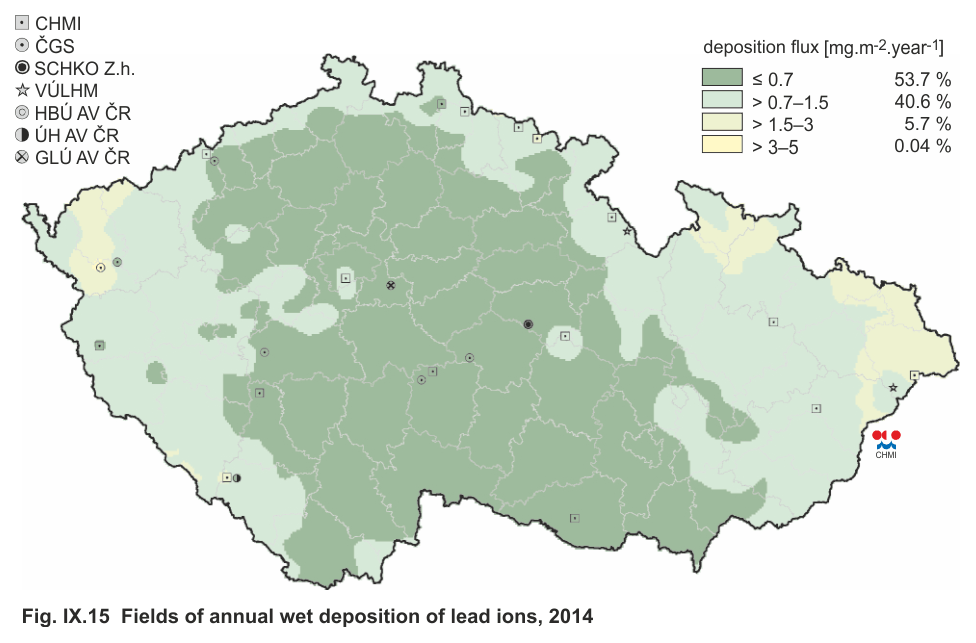
Fig. IX.15 Fields of annual wet deposition of lead ions, 2014
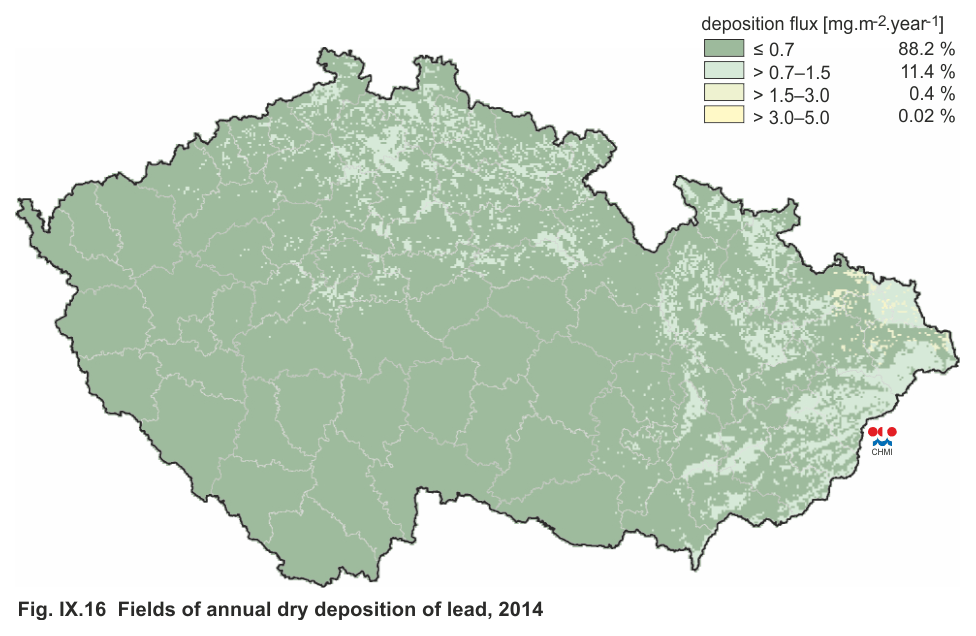
Fig. IX.16 Fields of annual dry deposition of lead, 2014
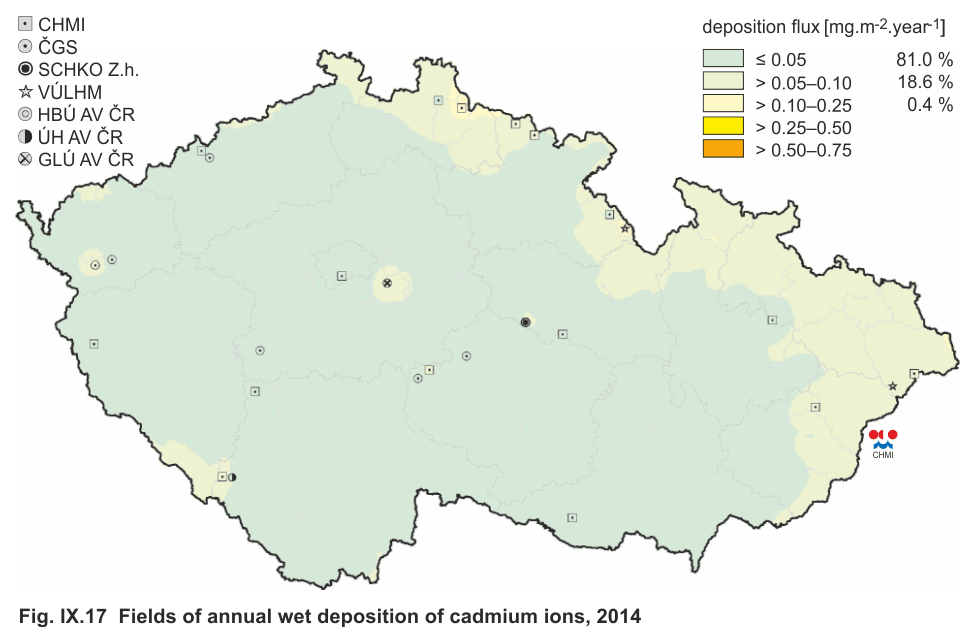
Fig. IX.17 Fields of annual wet deposition of cadmium ions, 2014
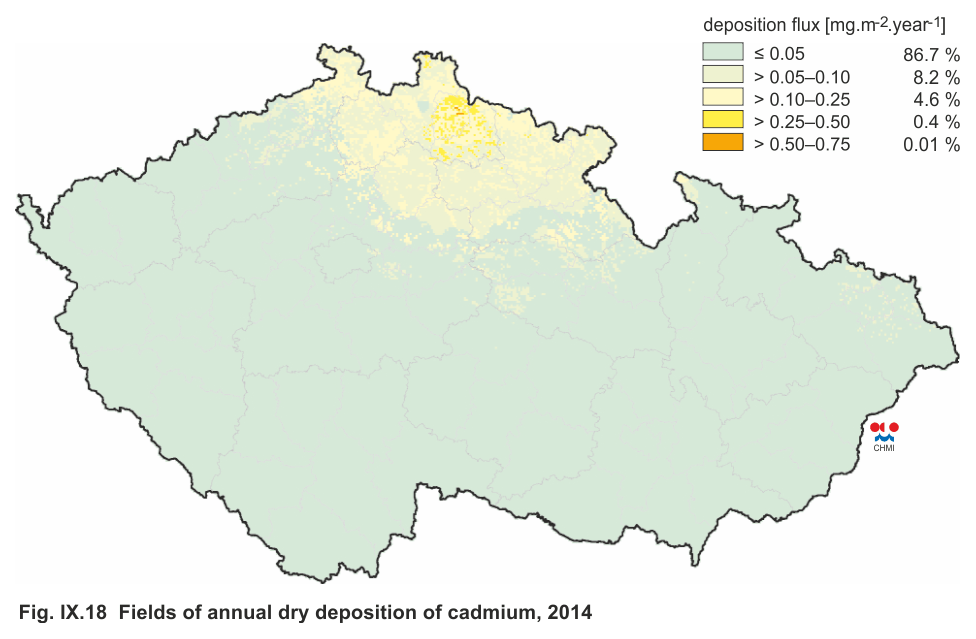
Fig. IX.18 Fields of annual dry deposition of cadmium, 2014
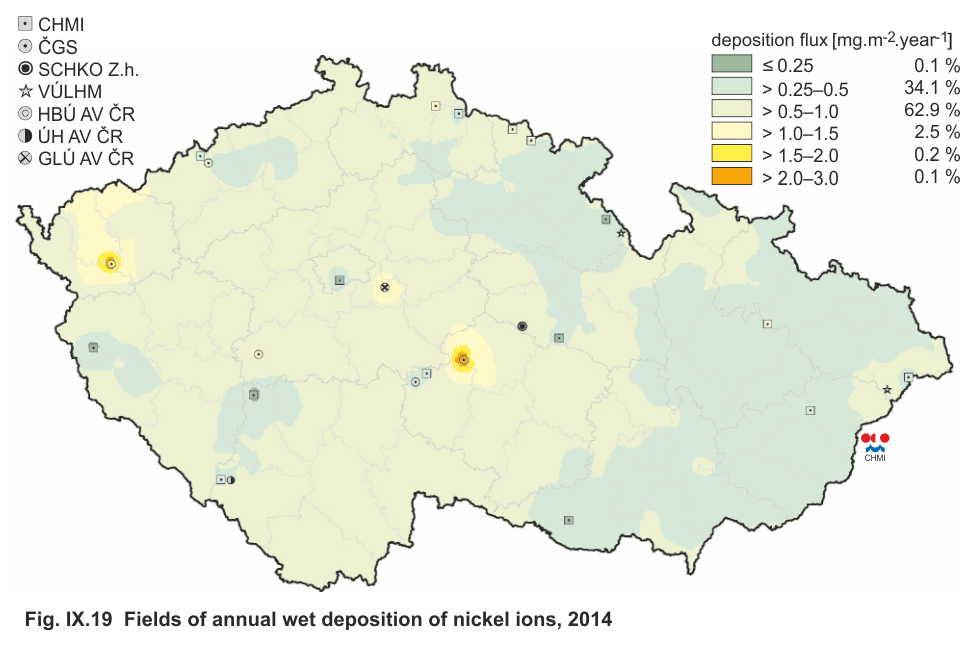
Fig. IX.19 Fields of annual wet deposition of nickel ions, 2014
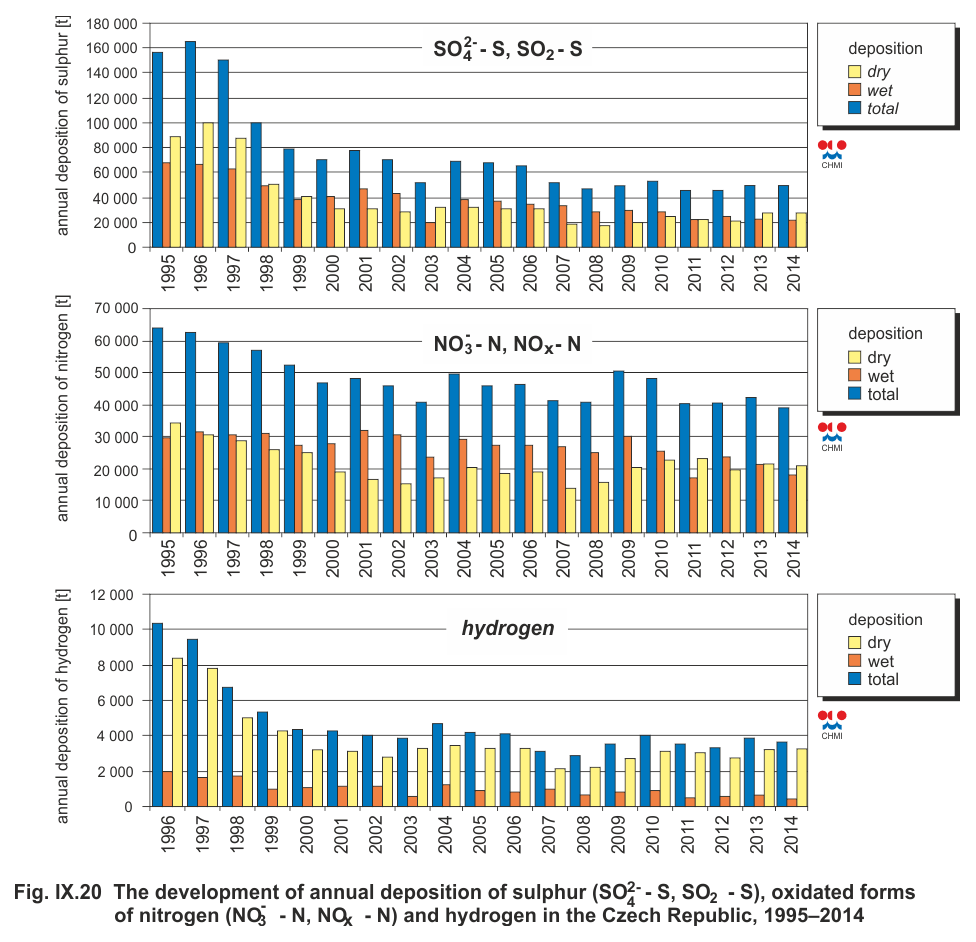
Fig. IX.20 The development of annual deposition of sulphur
(SO42- - S, SO2 - S), oxidated forms of nitrogen (NO3- - N, NOx
- N) and hydrogen in the Czech republic, 1995–2014
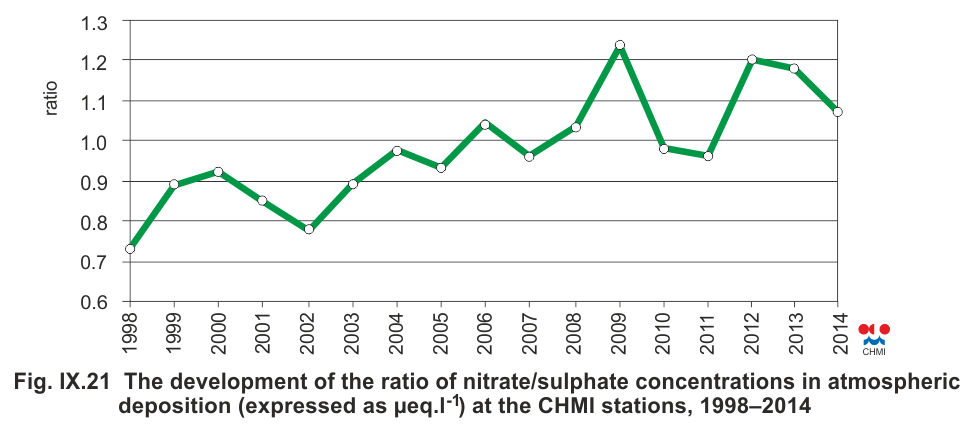
Fig. IX.21 The development of the ratio of nitrate/sulphate
concentrations in atmospheric deposition (expressed as µeq. l-1) at the CHMI stations, 1998–2014
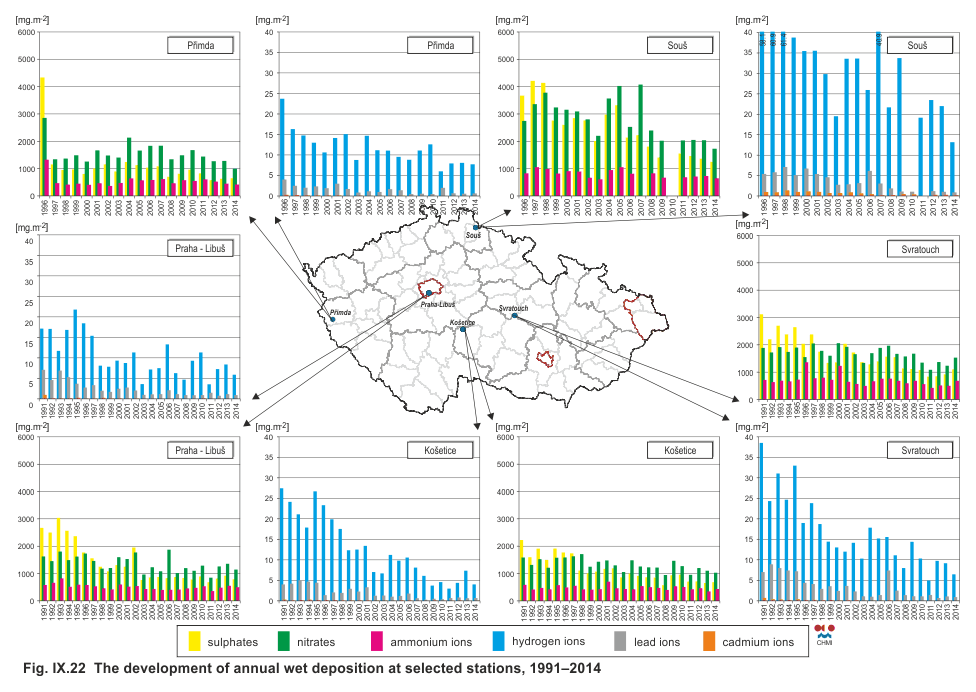
Fig. IX.22 The development of annual wet deposition at selected
stations, 1991–2014