IV.7 SULPHUR DIOXIDE
IV.7.1 Air pollution caused by sulphur dioxide in the year
2014
Air pollution caused by sulphur dioxide in the year 2014 with regard to the limit values for the protection of human health
In 2014 neither the limit value for the hourly sulphur dioxide (SO2) concentration nor for the 24-hour SO2 concentration was exceeded in the Czech Republic at any measuring station (Tables XIII.18 and XIII.19). Only four localities (Přerov, Měděnec, Nová Víska u Domašína and Dolní Rychnov) detected 1-hour concentrations of SO2 exceeding the limit value of 350 µg.m-3; however, the tolerated number of the limit value exceedances (24) was not exceeded. The highest hourly concentrations of SO2 were detected at the Přerov station, where 7 exceedances of the limit value occurred over the course of the year, of which 6 occurred on the night of 28 October to 29 October 2014. Concentrations of SO2 reached unusually high values of 716 to 12,687 µg.m-3. This episode of extreme concentrations of SO2 was caused by emissions from chemical production at the company Precheza a. s., where the production of sulphuric acid was being restarted after an outage (iDNES/Olomouc region 2014). The station was therefore affected by a nearby source of pollution. Hourly limit-exceeding concentrations of SO2 were also detected at the stations Měděnec (582 µg.m-3), Nová Víska u Domašína (432 µg.m-3 and 419 µg.m-3) and Dolní Rychnov (413 µg.m-3). It can be assumed that measurements taken at these stations are influenced by pollution from the Podkrušnohorská basin, or the Sokolov basin.
The 25th highest SO2 concentration reached its maximum values at the stations Lom (136 µg.m-3), Ostrava-Radvanice ZÚ 135 µg.m-3 and Dolní Rychnov 130 µg.m-3. The highest 24-hour concentration of SO2 was recorded at the Přerov station on 28 October 2014 (1,363 µg.m-3) as a result of interference by emissions from chemical production at the company Precheza a. s. Based on the unified method of calculating 24-hour averages at MIM and AIM stations (from 6 am to 6 pm UTC of the following day), the limit value of 125 µg.m-3 was exceeded on this day only. Had the calculation of the daily average been made from 0 AM to 0 AM UTC, this limit value would have been exceeded on two days: 28 October (591 µg.m-3) and 29 October (789 µg.m-3). At other stations, the maximum 24-hour concentrations of SO2 did not exceed the limit value of 125 µg.m-3 (e.g. Ostrava-Radvanice ZÚ 119 µg.m-3, Dolní Rychnov 72 µg.m-3, Měděnec 68 µg.m-3). The 4th highest 24-hour SO2 concentration reached its maximum values at the stations Ostrava-Radvanice ZÚ 79 µg.m-3, Petrovice u Karviné (54 µg.m-3) and Lom 54 µg.m-3.
The map of the field of the 4th 24-hour SO2 concentration in 2014 (Fig. IV.7.1) shows that in 99.9 % of the Czech Republic territory, the concentration of this pollutant did not reach 50 µg.m-3, and only in approx. 0.1 % of the territory of the Czech Republic, SO2 concentrations exceeded the lower assessment threshold (LAT). This very small area, with SO2 concentrations exceeding 50 µg.m-3, mainly covered the Ústí nad Labem region, in part of the Podkrušnohorská basin in the Most district.
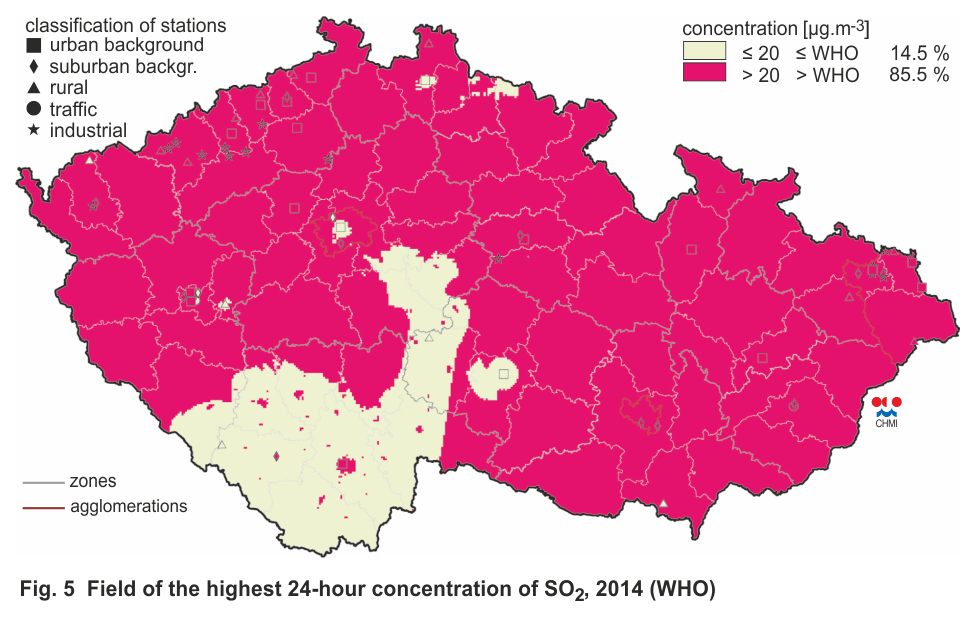
Annex IV contains a map of the field of the highest 24-hour concentration of SO2 in 2014 (Fig. 5). Most of the area of the Czech Republic (85.5 %) exceeds the 24-hour value of 20 µg.m-3 recommended by the WHO for the protection of human health. Only 15.5 % of the territory of the Czech Republic (almost the entire region of South Bohemia) corresponds to concentrations of ≤ 20 µg.m-3.
Air pollution caused by sulphur dioxide with regard to the limit values for
the protection of ecosystems and vegetation
In 2014 neither the limit value for the annual average concentration nor the limit value for the winter average concentration was exceeded at rural localities (Tables XIII.21 and XIII.22). The highest winter average concentration in 2014 was recorded at the localities Lom (14.8 µg.m-3), Krupka (11.6 µg.m-3) and Věřňovice (11.6 µg.m-3); the annual average concentration reached its maximum in the localities Ostravice (12.1 µg.m-3) and Lom (10.6 µg.m-3).
The map of the field of the annual average concentration in 2014 (Fig. IV.7.5) only shows exceedances of the upper assessment threshold (UAT) in small parts of the Ústí nad Labem region, the Karlovy Vary region and the Moravia-Silesia region. The map of the field of the average concentration for the winter period 2014/2015 (and IV.7.6) shows exceedances of the limit value in a very small part of the same districts. These exceedances are apparent in the map constructed by a model calculation based on emission data from the year 2013. This fact can to a certain extent influence the shape of the field of SO2 concentrations. Compared to the year 2013, for example, emissions of SO2 decreased in the Most district based on preliminary results of emission records for the year 2014.
The map was constructed from the data of all background stations measuring SO2 with regard to their classification; only rural stations are marked with spot symbols.
IV.7.2 Development of sulphur dioxide concentrations
After the year 1998, a marked decrease of SO2 concentrations was recorded in connection with the coming into force of Act No. 309/1991 Coll. and the meeting of required emission limit values. Since then the annual average concentrations of this pollutant have not exceeded the set limit value of 20 µg.m-3 at rural stations. In 2008 there was a further decrease of air pollution caused by SO2 in the whole territory of the Czech Republic. In 2009 and 2010, on the contrary, a slight increase of air pollution caused by SO2 was recorded. From 2011 to 2014, a further decreasing trend is apparent (Fig. IV.7.3).
In 2000–2014 there was an overall decrease of SO2 concentrations (by approx. 30–50 % depending on the respective air pollution characteristic; Fig. IV.7.4). The trend of SO2 concentrations is caused by a decrease of emissions, desulphurisation of coal-fired power plants and a change in the fuels used (see the trends in the development of emissions in Chapter II). Year-to-year fluctuations of concentrations are also influenced by differing meteorological conditions in particular years.
Development of sulphur dioxide concentrations with regard to the limit
values for the protection of human health
Fig. IV.7.2 shows the apparent decreasing trend in the development of the 4th highest 24-hour and 25th highest 1-hour concentrations of SO2 at selected localities, which started in the year 2004.
In 2014, compared to the year 2013, the 4th highest 24-hour concentration and the 25th highest 1-hour concentration of SO2 decreased at most localities. This decrease of SO2 concentrations was apparent at almost all CHMI stations in the Moravia-Silesia region and the Ústí nad Labem region, where measurements of SO2 are carried out at the highest number of localities. A relatively large decrease of SO2 concentrations in comparison with the previous year was recorded at the stations Most and Teplice. Conversely, a rise in concentrations of SO2 occurred at the stations Měděnec and Šumperk MÚ.
Development of sulphur dioxide concentrations with regard to the limit
values for the protection of ecosystems and vegetation
The development of annual and winter average concentrations of SO2 at selected rural localities is presented in Figs. IV.7.7 and IV.7.8. The winter average of SO2 concentrations shows an apparent downward trend, and the annual average has a slowly decreasing trend, too.
In 2014, as against the previous year, annual concentrations of SO2 decreased at most rural localities. A particularly apparent decrease was recorded at the stations Tušimice and Jeseník-lázně. As concerns winter average concentrations of SO2, decreases were recorded at almost all localities. Particularly pronounced decreases were recorded at the stations Sněžník and Krupka in the Ústí nad Labem region.
IV.7.3 Emissions of sulphur dioxide
Emissions of SO2 are created mainly during the combustion of sulphur-containing solid fossil fuels. In 2013, 62.4 % of SO2 emissions on the country-wide scale came from sector 1A1a-Public electricity and heat production, and 13.6 % were contributed by sector 1A4bi-Residential stationary combustion contributed (Fig. IV.7.9). The decrease of SO2 emissions between the years 2007 and 2008 in sector 1A1a-Public electricity and heat production resulted from the implementation of the obligation to comply with emission ceilings for LCP sources (Fig. IV.7.10). Since 2008 the emissions of SO2 have remained approximately at the same level, with a more pronounced decrease between the years 2012 and 2013. Due to the prevailing influence of the public electricity and heat production sector, SO2 emissions are concentrated in the Ústí nad Labem region, the Moravia-Silesia region and the Central Bohemia region, where the largest producers of energy are located (Fig. IV.7.11).
Tab. XIII.18 Stations with the highest values of the 25th and maximum hourly concentrations of SO2
Tab. XIII.19 Stations with the highest numbers of exceedances of the 24-hour limit value of SO2
Tab. XIII.20 Stations with the highest values of annual average concentrations of SO2
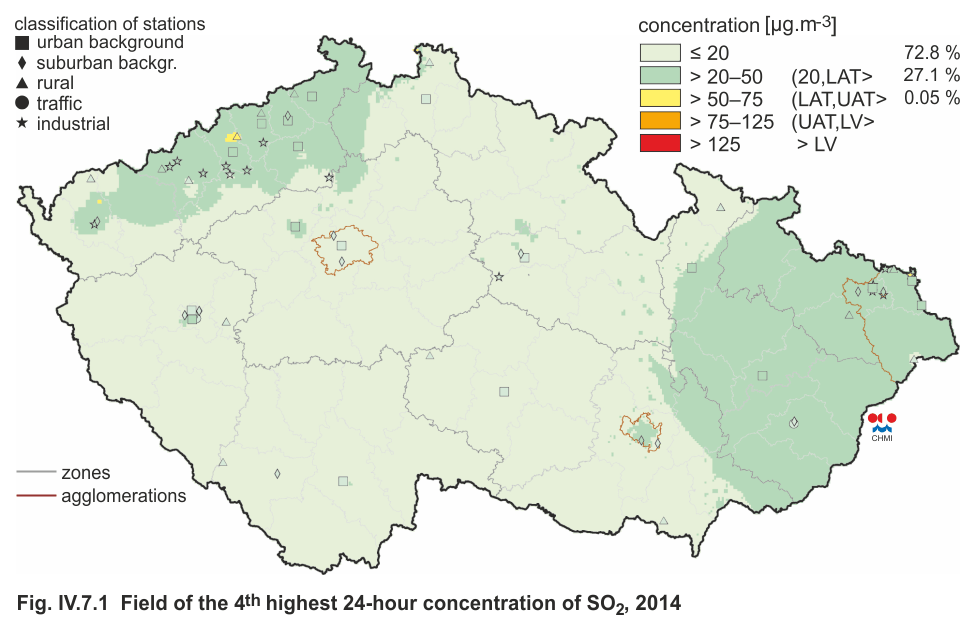
Fig. IV.7.1 Field of the 4th highest 24-hour concentration
of SO2, 2014
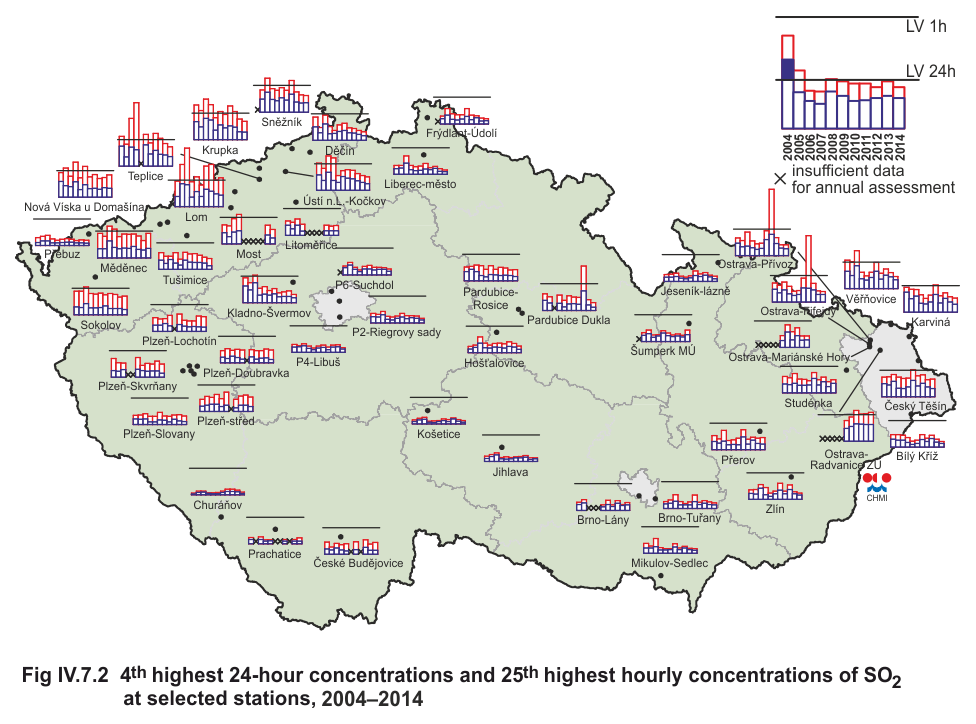
Fig. IV.7.2 4th highest 24-hour concentrations and 25th highest
hourly concentrations of SO2 at selected stations, 2004–2014
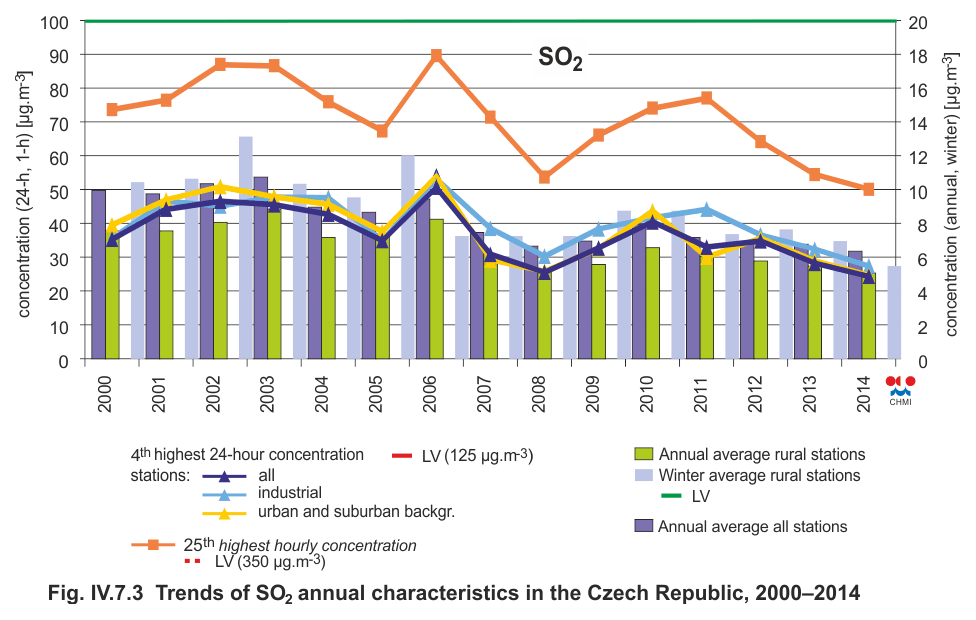
Fig. IV.7.3 Trends of SO2 annual characteristics in the Czech
Republic, 2000–2014
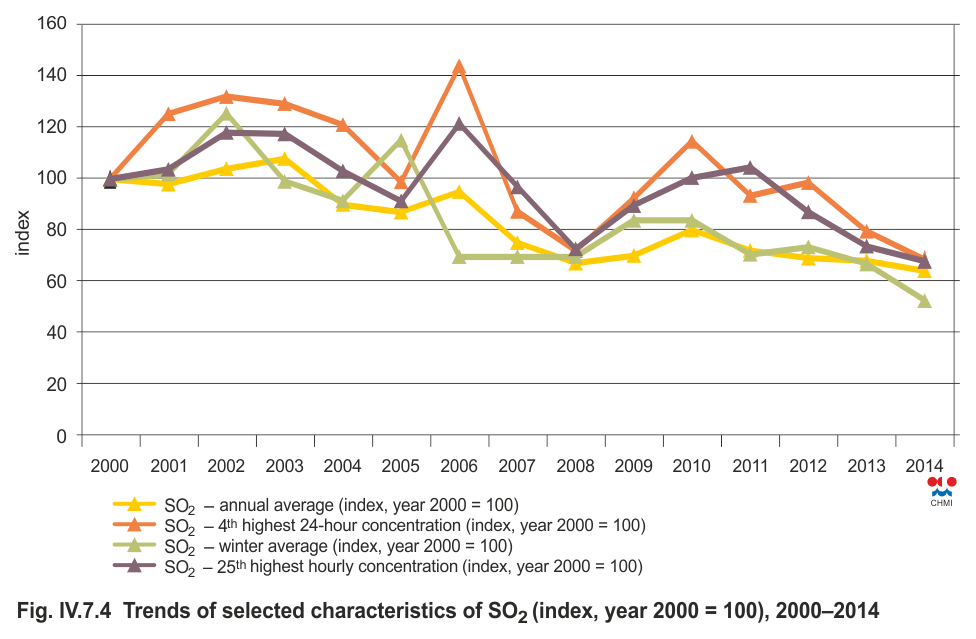
Fig. IV.7.4 Trends of selected characteristics of SO2 (index,
year 2000 = 100), 2000–2014
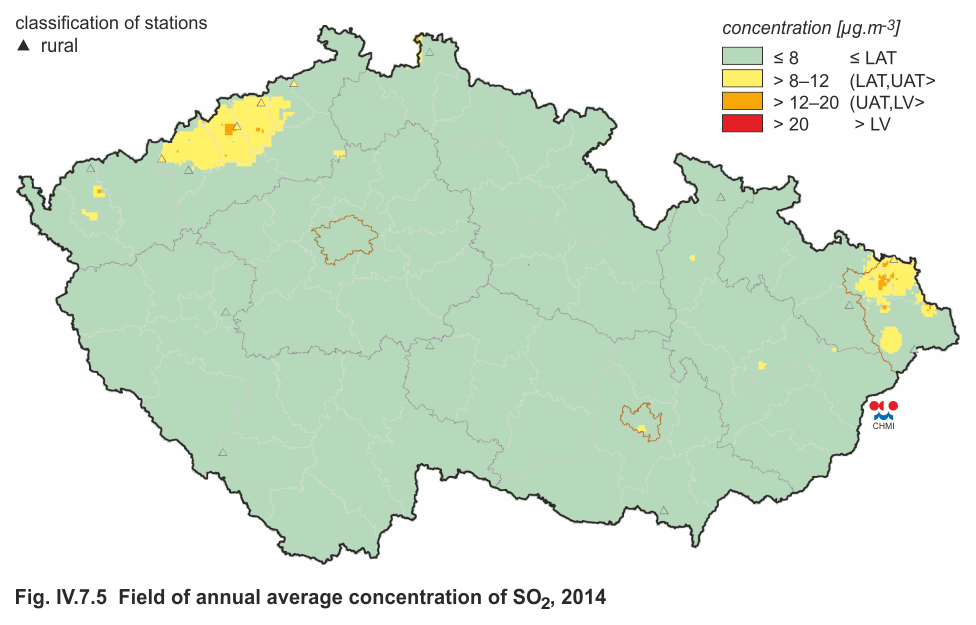
Fig. IV.7.5 Field of annual average concentration of SO2, 2014
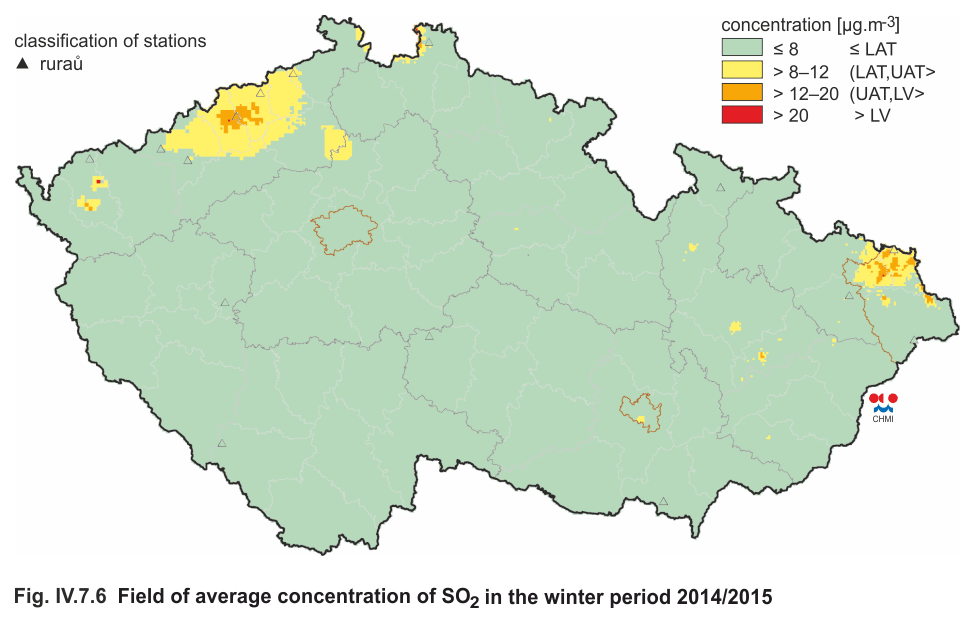
Fig. IV.7.6 Field of average concentration of SO2 in the winter
period 2014/2015
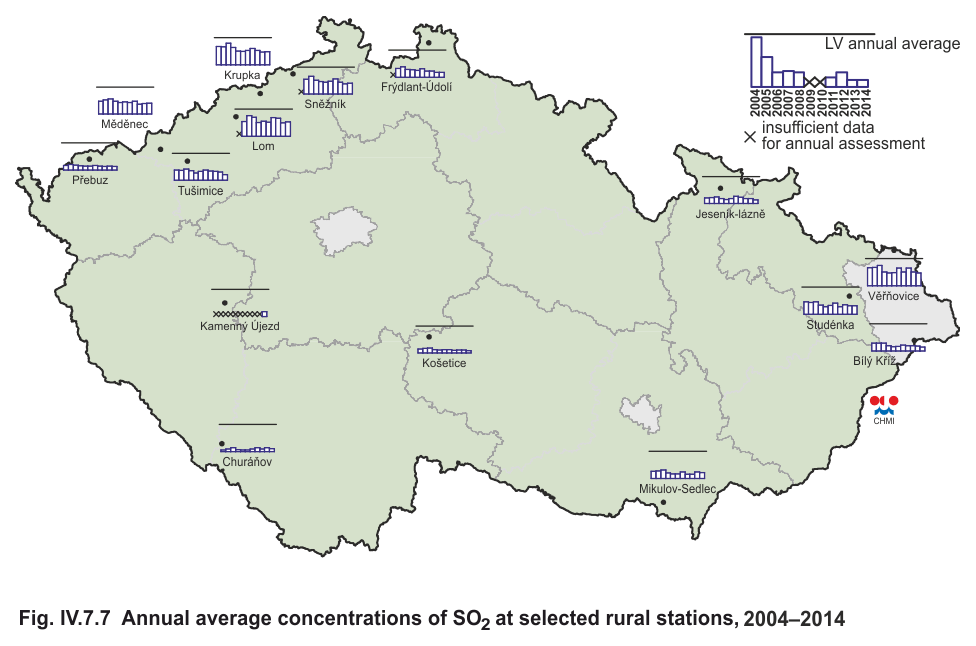
Fig. IV.7.7 Annual average concentrations of SO2 at selected
rural stations, 2004–2014
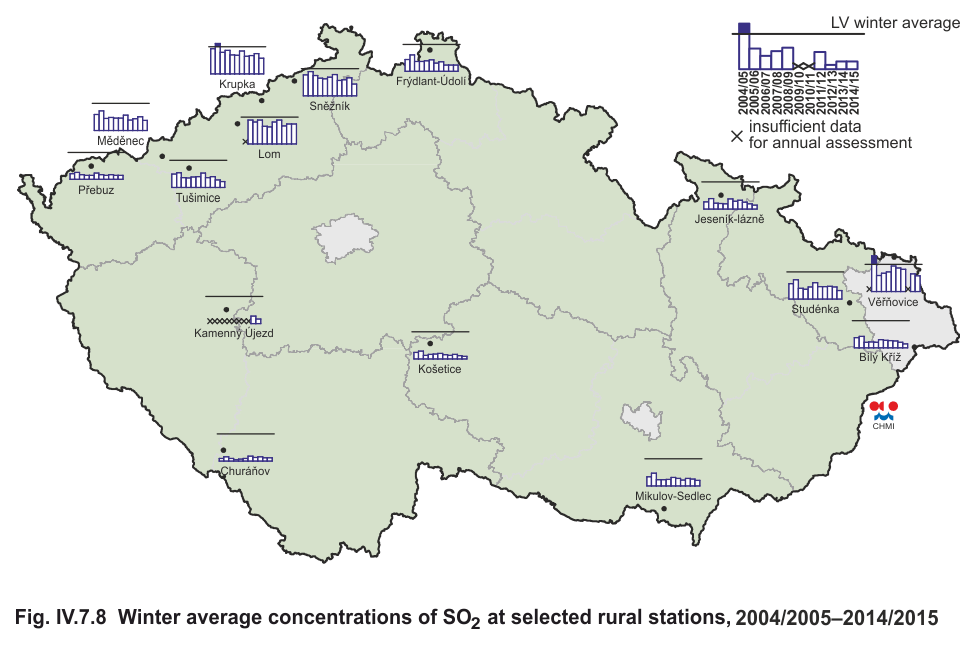
Fig. IV.7.8 Winter average concentrations of SO2 at selected
rural stations, 2004/2005–2014/2015
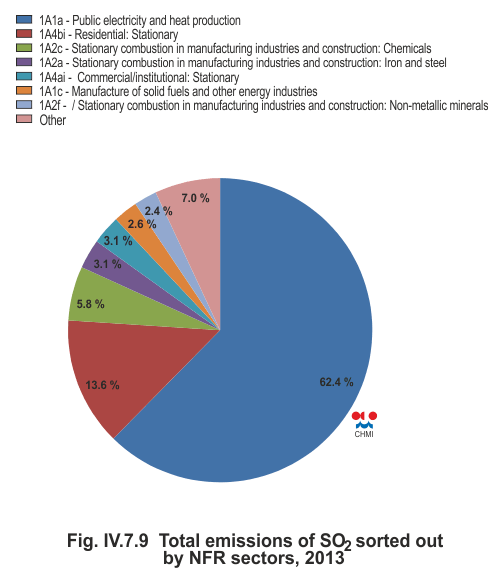
Fig. IV.7.9 Total emissions of SO2 sorted out by NFR sectors,
2013
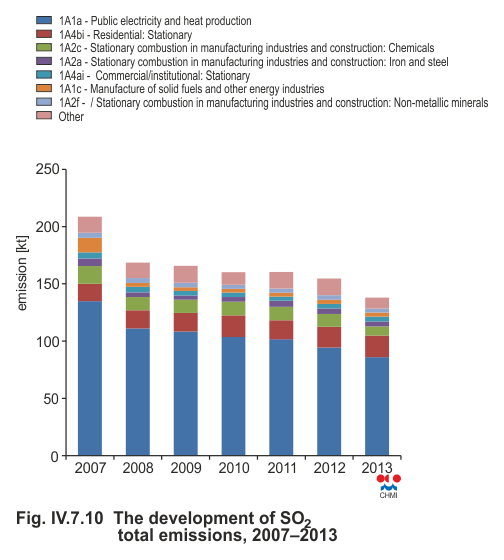
Fig. IV.7.10 The development of SO2 total emissions, 2007–2013
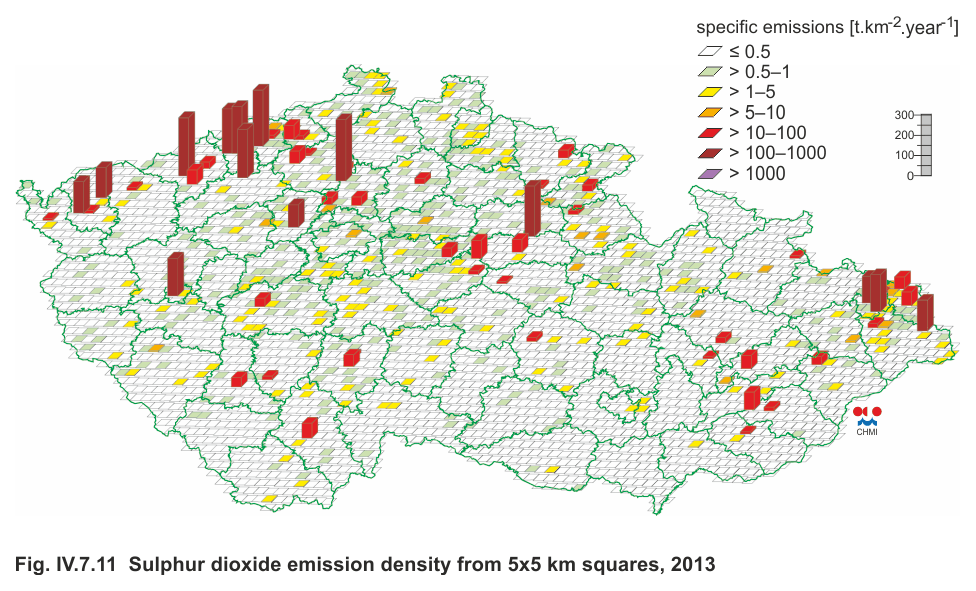
Fig. IV.7.11 Sulphur dioxide emission density from 5x5 km
squares, 2013