IV.6 HEAVY METALS
IV.6.1 Air pollution caused by heavy metals in the year 2014
Lead
In 2014 the annual limit value for lead concentrations was not exceeded at any of 55 localities with sufficient data for the calculation of the valid annual average. The highest annual average was measured at the locality Ostrava-Mariánské Hory (Table XIII.14). With the exception of the year 2011, when the highest concentration was recorded at the locality Příbram I-nemocnice, the highest lead concentrations are repeatedly measured in the Ostrava-Karviná area.
Lead concentrations are very low in the whole territory of the Czech Republic, and they do not reach even one half of the limit value, i.e. the lower assessment threshold 0.25 µg.m-3 (Fig. IV.6.5). In comparison with the year 2013, lead concentrations decreased at 44 % of localities (23 of the total number of 52 stations, which measured lead concentrations in both 2013 and 2014).
Cadmium
In 2014 the annual limit value for cadmium (5 ng.m-3) was exceeded only at one locality (Tanvald-školka, 7.6 ng.m-3) of the total number of 52 localities with the valid annual average (Table. XIII.15). The highest annual average concentrations were measured mostly at localities in the districts Jablonec nad Nisou and Ostrava-město (Fig IV.6.1). For example, at the station Souš (Jablonec nad Nisou region), which is classified as a rural background station, long-term concentrations of cadmium are many-fold higher than those measured at other rural localities (Fig. IV.6.9).
In comparison with the year 2013, at almost 41 % of localities (20 of the total number of 49 stations which measured cadmium concentrations in both 2013 and 2014), the average annual concentrations decreased.
Arsenic
The annual limit value of arsenic (6 ng.m-3) was not exceeded only at one locality (Kladno-Švermov, 6.7 ng.m-3) of the total number of 55 localities with the valid annual average (Table XIII.16). The limit value for arsenic had been exceeded every year at least at one station since the beginning of measurements in 1986 with the exception of the year 2013, when the limit value was met at all measuring stations. In comparison with the year 2012, the annual average concentration decreased at 51 % of localities (26 of the total number of 51 stations, which measured arsenic concentrations in both 2013 and 2014). Conversely, concentrations of arsenic increased at 33 % of localities (17 out of the total number of 51 stations that measured As concentrations in both 2013 and 2014).The heaviest loads of arsenic concentrations are recorded in northwestern parts of Bohemia (Fig. IV.6.2).
Nickel
The annual limit value for nickel (20 ng.m-3) was not exceeded at any of 55 localities with sufficient number of data for the calculation of the valid annual average. The highest concentration 7.1 ng.m-3 was measured, as in the year 2013, at the station Jihlava-Znojemská, classified as a traffic station (Table XIII.17). A decrease of the annual average concentration in comparison with the previous year was recorded at 40 % of localities (21 of the total number of 52 stations which measured Ni concentrations in both 2013 and 2014). Conversely, concentrations of Ni increased at almost 33 % of localities (17 out of the total number of 52 stations that measured concentrations of Ni in both 2013 and 2014).
IV.6.2 The development of heavy metals concentrations
Annual average concentrations of all monitored heavy metals have been slightly decreasing in the past years, except for two surges in the years 2010 and 2013 (Fig. IV.6.9). These surges are as yet not sufficiently explained, but the one in 2010 could have been caused by poor dispersion and meteorological conditions.
In 2005–2007 a very marked decrease of cadmium concentrations was recorded at urban stations as well as on national average. This was caused by the decrease of the exceptionally high concentrations of cadmium measured at the urban locality Tanvald ZÚ since 2005. The area around the town of Tanvald (in the Liberec region) is characterized by a strong presence of the glass industry (ASKPCR 2014), which used to be the significant source of cadmium emissions from dying and fluxing substances, used primarily in the past (Beranová 2013).
Since 2004 the measures set by the Integrated regional programme to improve ambient air quality in the Liberec region, aimed at the reduction of cadmium emissions from glassworks, has been implemented (Rada Libereckého kraje 2004). The implementation of modern technologies resulted in a marked decrease of cadmium concentrations in several following years (ATEM 2006) and, consequently, to the reduction of air pollution concentrations in this area. Despite this decrease, above-the-limit cadmium concentrations are still being recorded. However, their source has not yet been identified.
In areas not influenced by industrial production, average annual concentrations of all heavy metals are usually higher in cities (Fig. IV.6.9). This is caused primarily by the concentration of industrial plants in cities and by higher intensity of traffic. Urban localities are also characterized by a more marked decrease of heavy metals concentrations during the evaluated period in comparison with rural localities. Since 2006–2007, when heavy metals concentrations slightly decreased at rural localities, their levels tend to be stagnating.
IV.6.3 Emissions of heavy metals
Heavy metal pollutants comprise metals with a specific weight above 4.5 g.cm-3 and their compounds. Compounds of heavy metals are a natural component of fossil fuels, and their content in these fuels varies according to the mining locality. The amount of emissions of heavy metals during the combustion of fossil fuels depends primarily on the type of fuel, the type of the combustion plant and on the combustion temperature influencing the volatility of heavy metals. Emissions of heavy metals are formed also during certain technological processes because they are contained in raw materials. Heavy metals are present in iron ore, scrap iron, glass batch or cullet, dyes, glass shards, etc. In addition, there are many sources of fugitive emissions containing heavy metals which have not yet been included in emission inventories. For instance, heavy metals in particulate emissions from tyre and brake wear or emissions of heavy metals connected with old ecological burdens from mining and metallurgical activities. These types of sources are, for example, considered the probable cause of air pollution by arsenic around the town of Kladno.
Combustion processes are significant mainly in emissions of arsenic and nickel. One of the most important sectors on the country-wide scale is sector 1A1a-Public electricity and heat production; its share in arsenic and nickel emissions in 2013 was 60.9 % and 63.4 %, respectively (Figs. IV.6.10 and IV.6.12). This sector also contributed significantly to cadmium (37.3 %; Fig. V.6.14) and lead emissions (25.5 %; IV.6.16). The share of the sectors of iron and steel production (1A2a and 2C1) prevailed in 2013 mainly in emissions of lead (40.1 %). The influence of sector 1A4bi-Local household heating was apparent mainly in emissions of arsenic (11.4 %). Sector 1A2f-Stationary combustion processes in industry and construction: Non-metallic minerals, which comprises, for example, glass melting furnaces, cement klinker kilns and lime kilns, contributed more significantly especially to emissions of lead (9.4 %). The decreasing trend of heavy metals emissions in the period of 2007–2013 is related to the development of emissions of suspended particles, to which these substances bind. This trend can in some years be influenced by changing content of heavy metals in coal or feedstocks. In the last years, the volume of secondary production of non-iron metals, especially aluminium and lead, is growing. Emissions of heavy metals from these sources are highly variable depending on the quality of the scrap metal being processed.
Due to the prevailing share of the sector of public electricity and heat production and the sector of iron and steel production, the spatial distribution of heavy metals emissions is given primarily by the location of the plants operating within the above sectors. Significant emissions of arsenic and nickel are focused in areas with coal-burning thermal power plants and heating plants (Figs. IV.6.18 and IV.6.19). These are mainly enterprises operating in the Ústí nad Labem region. Large amounts of nickel are emitted into atmosphere also in the Pardubice region from the Chvaletice power plant and in the Plzeň region from the Teplárny ELÚ III heating plant. Emissions of arsenic are emitted, besides the Ústí nad Labem region, also in the Central Bohemia region from the Mělník I power plant and in the Pardubice region from the Opatovice power plant. Emissions of lead and cadmium prevail in the O/K/F-M agglomeration due to the high concentration of plants producing iron and steel. In the Central Bohemian region, a significant amount of lead is emitted into the atmosphere by secondary lead production at the Kovohutě Příbram metallurgical plant (Fig. IV.6.20 and IV.6.21).
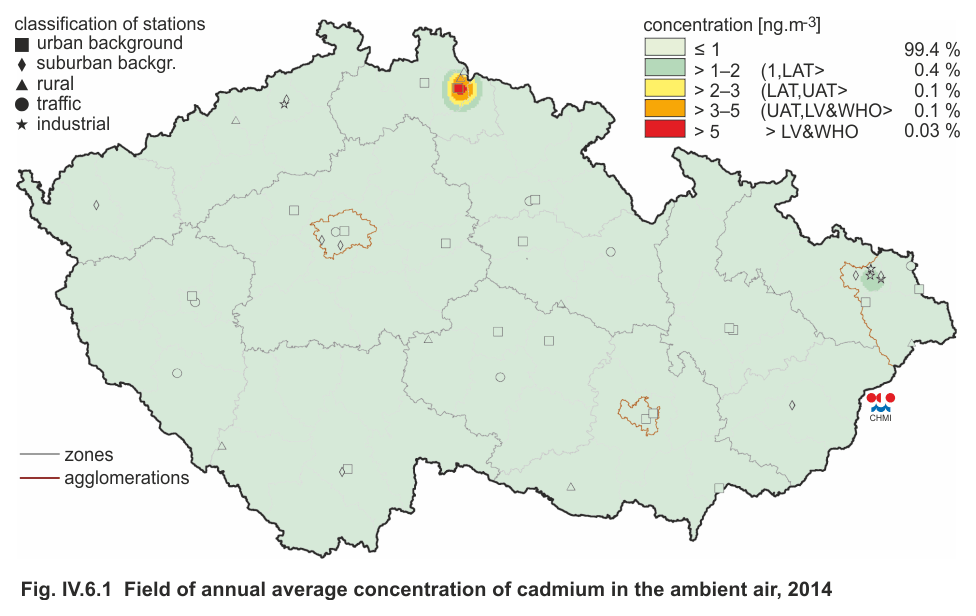
Fig. IV.6.1 Field of annual average concentration of cadmium
in the ambient air, 2014
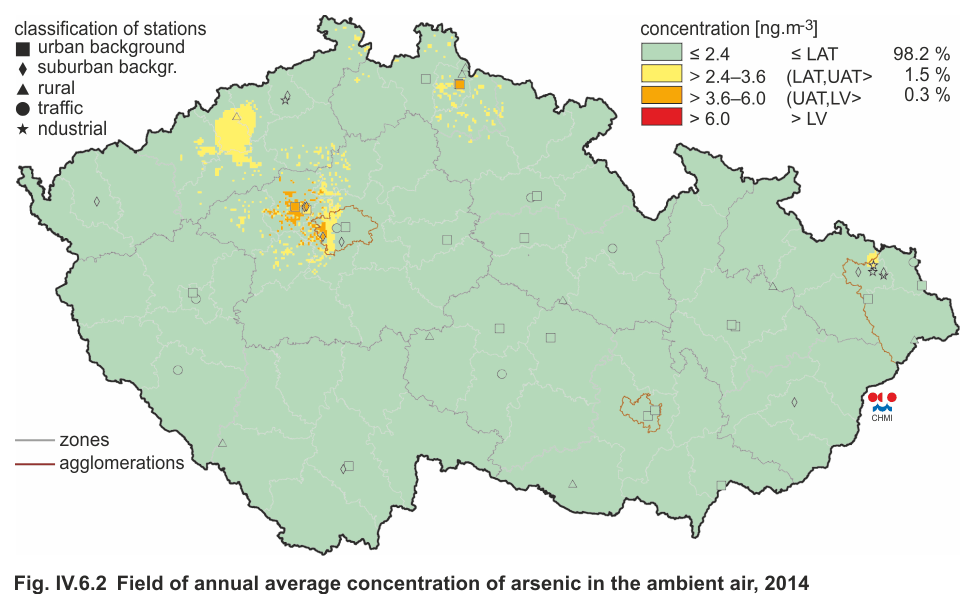
Fig. IV.6.2 Field of annual average concentration of arsenic in
the ambient air, 2014
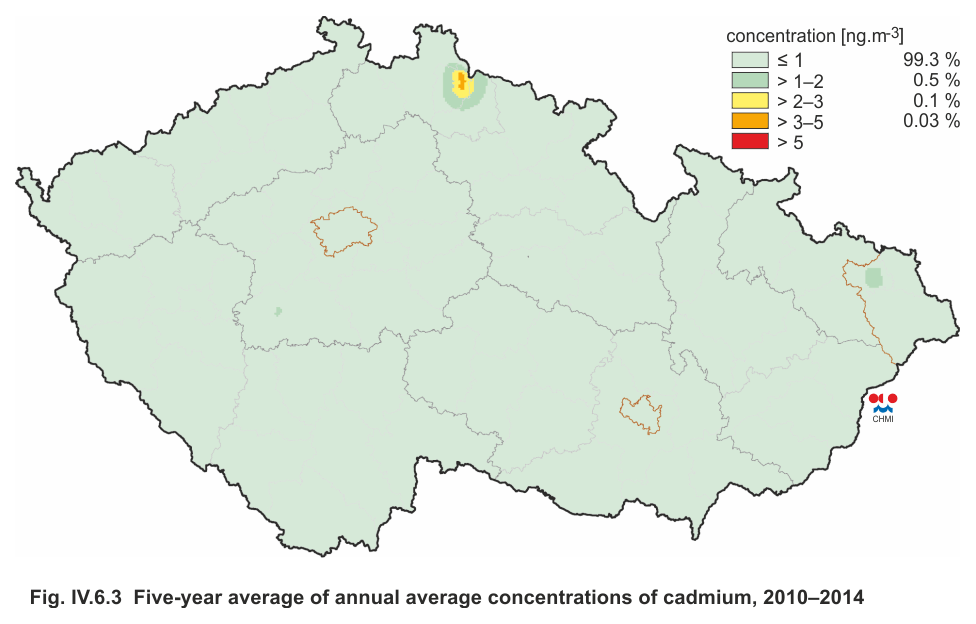
Fig. IV.6.3 Five-year average of annual average concentrations
of cadmium, 2010–2014
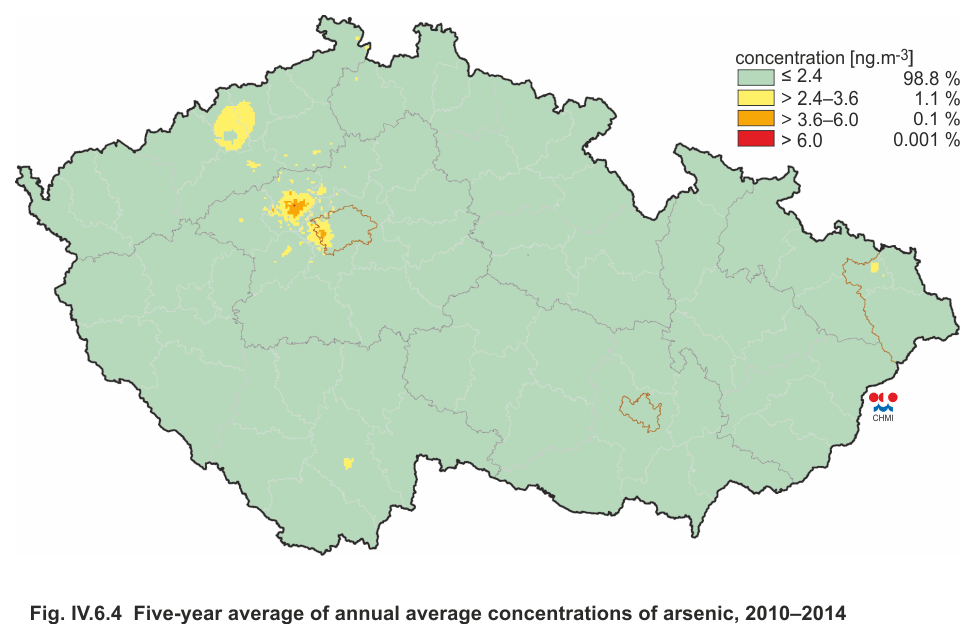
Fig. IV.6.4 Five-year average of annual average concentrations
of arsenic, 2010–2014
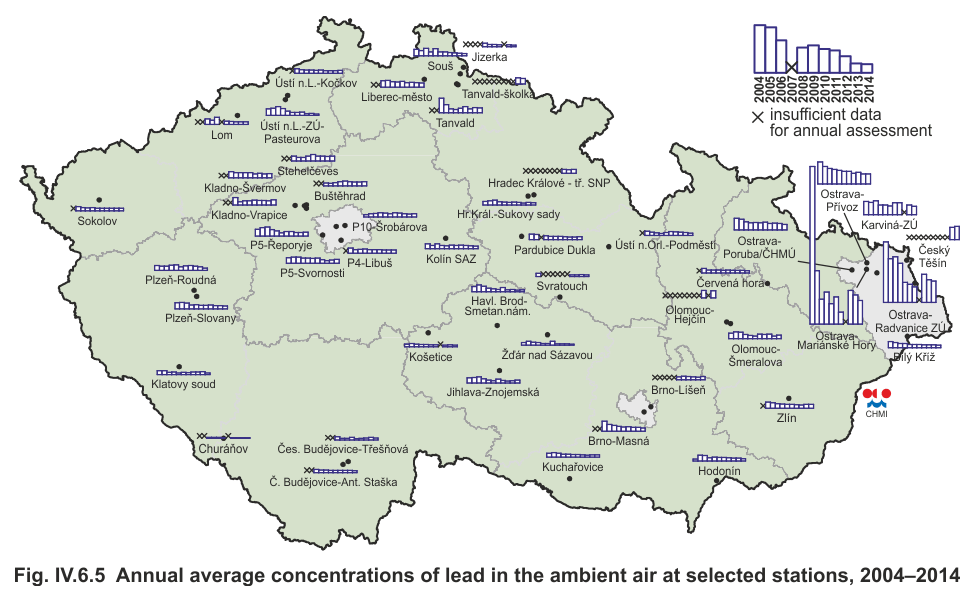
Fig. IV.6.5 Annual average concentrations of lead in the ambient
air at selected stations, 2004–2014
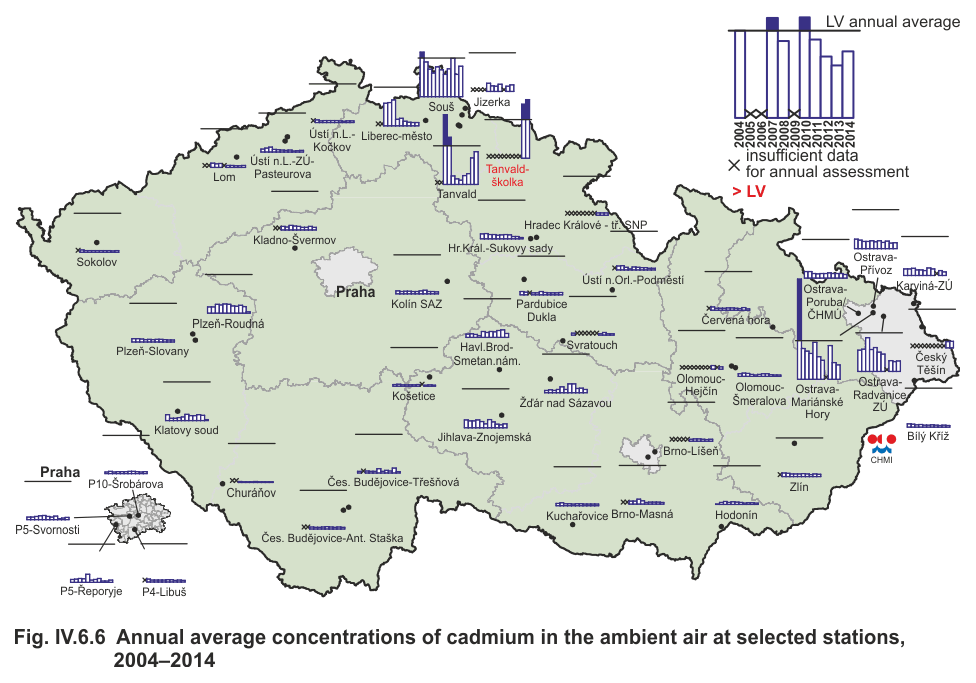
Fig. IV.6.6 Annual average concentrations of cadmium in the
ambient air at selected stations, 2004–2014
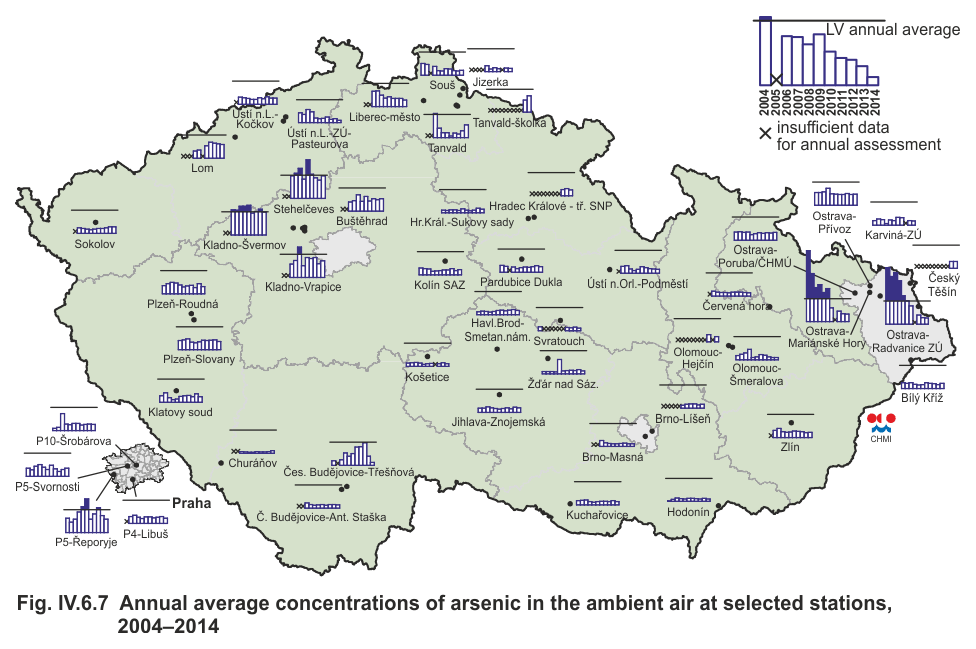
Fig. IV.6.7 Annual average concentrations of arsenic in the
ambient air at selected stations, 2004–2014
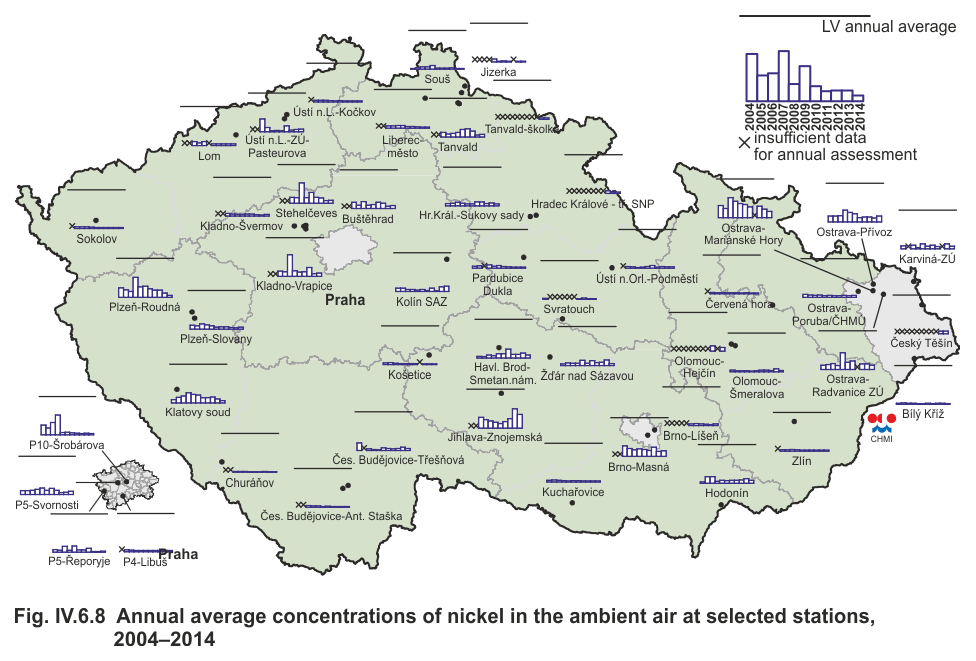
Fig. IV.6.8 Annual average concentrations of nickel in the
ambient air at selected stations, 2004–2014
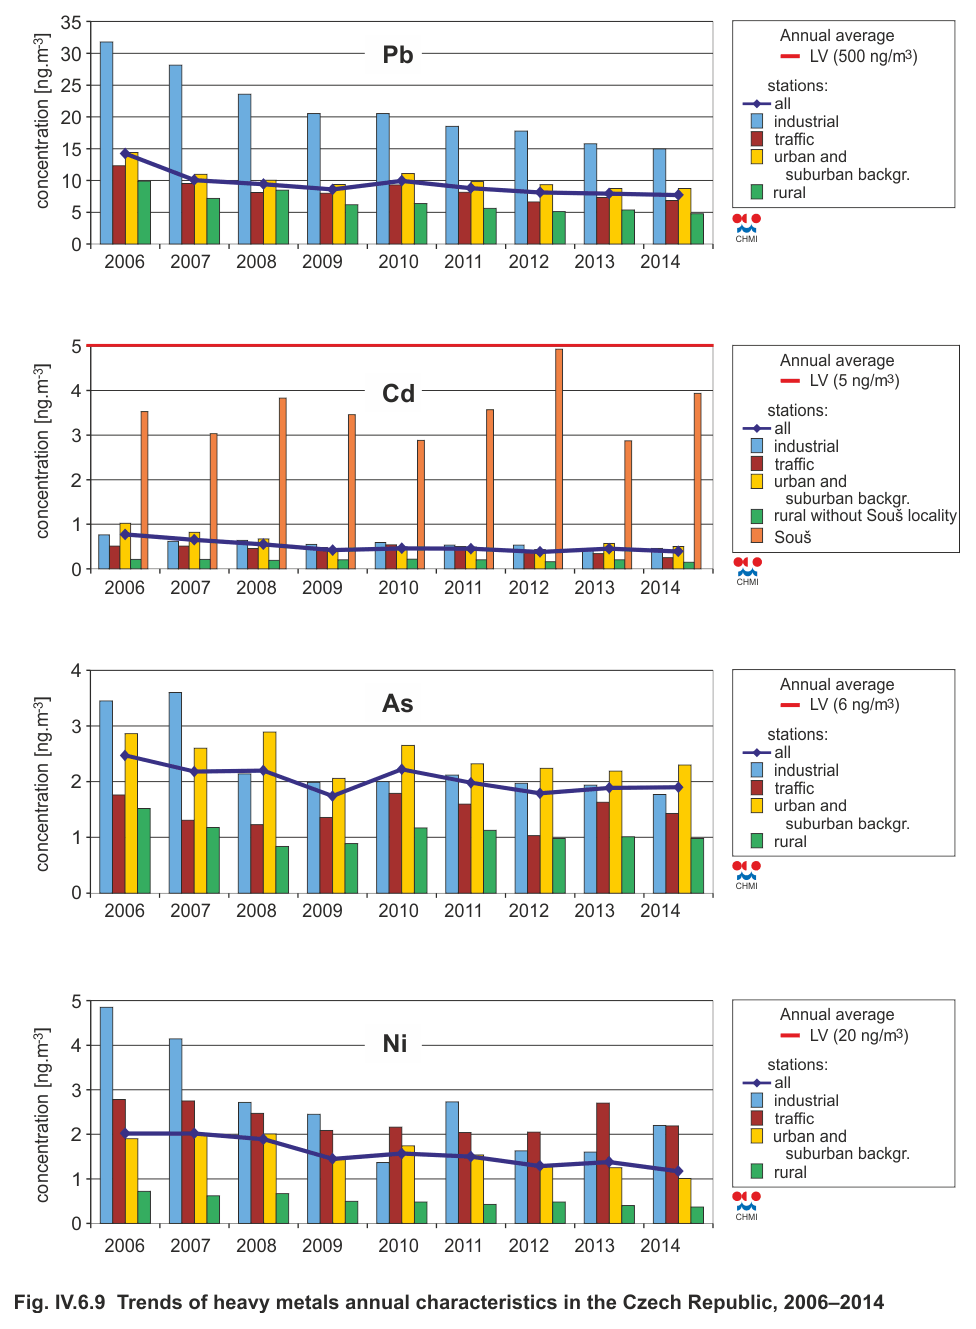
Fig. IV.6.9 Trends of heavy metals annual characteristics in the
Czech Republic, 2006–2014
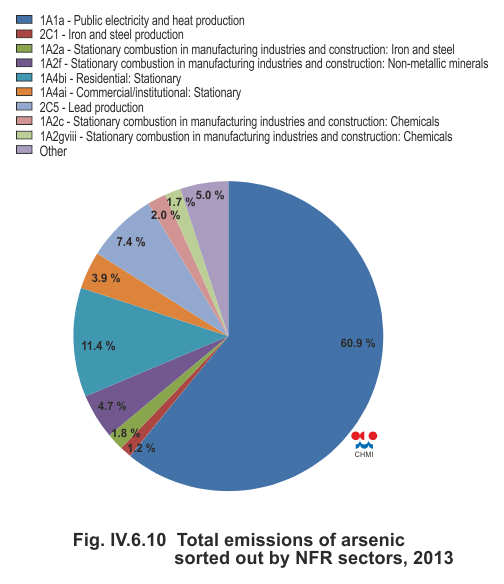
Fig. IV.6.10 Total emissions of arsenic sorted out by NFR
sectors, 2013
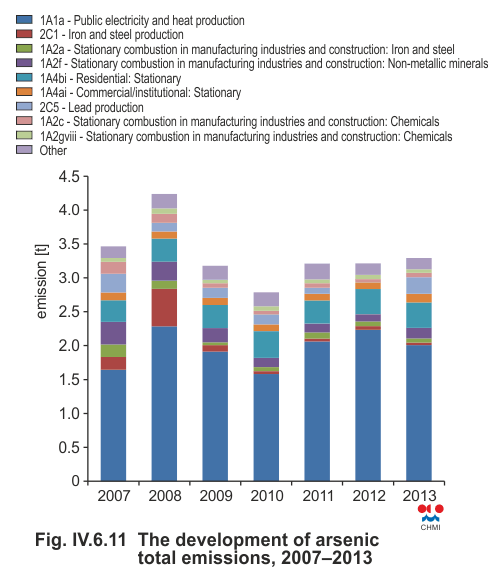
Fig. IV.6.11 The development of arsenic total emissions,
2007–2013
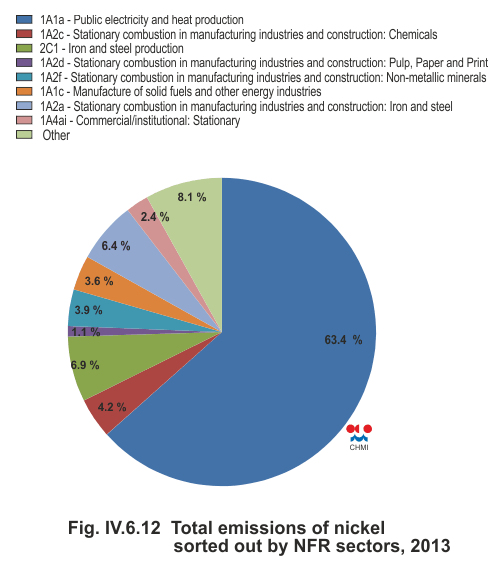
Fig. IV.6.12 Total emissions of nickel sorted out by NFR sectors,
2013
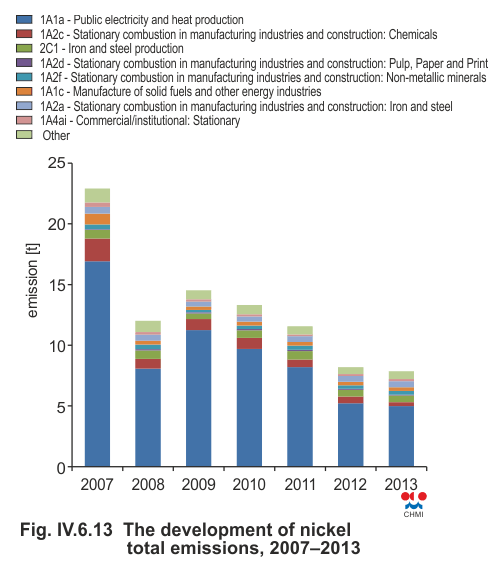
Fig. IV.6.13 The development of nickel total emissions,
2007–2013
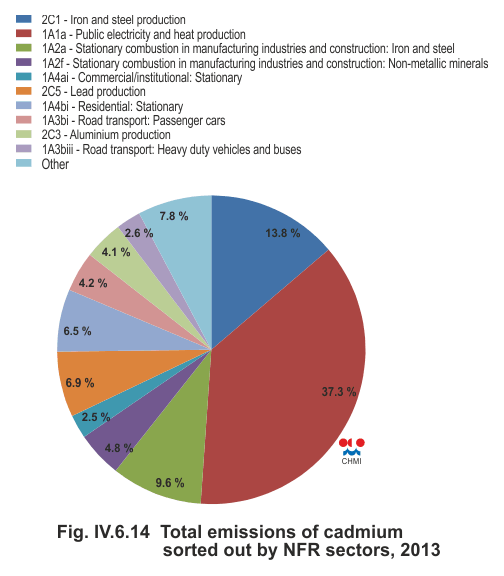
Fig. IV.6.14 Total emissions of cadmium sorted out by NFR
sectors, 2013
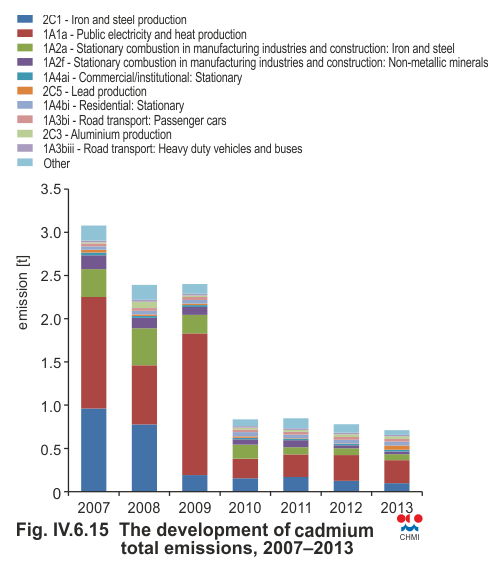
Fig. IV.6.15 The development of cadmium total emissions,
2007–2013
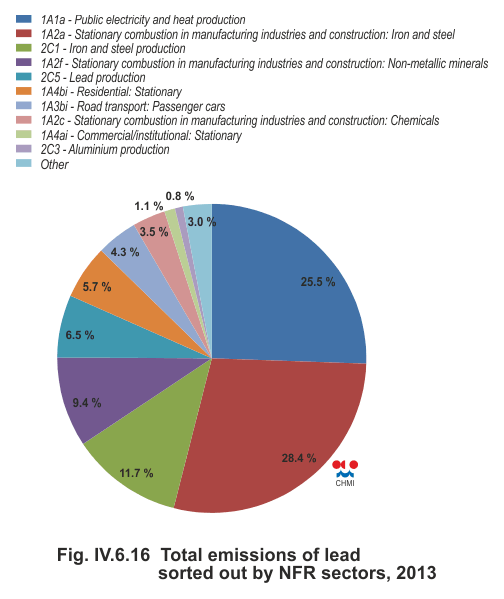
Fig. IV.6.16 Total emissions of lead sorted out by NFR sectors,
2013
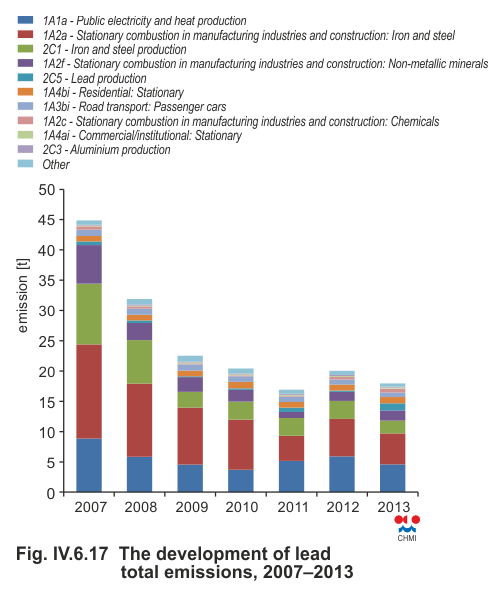
Fig. IV.6.17 The development of lead total emissions, 2007–2013
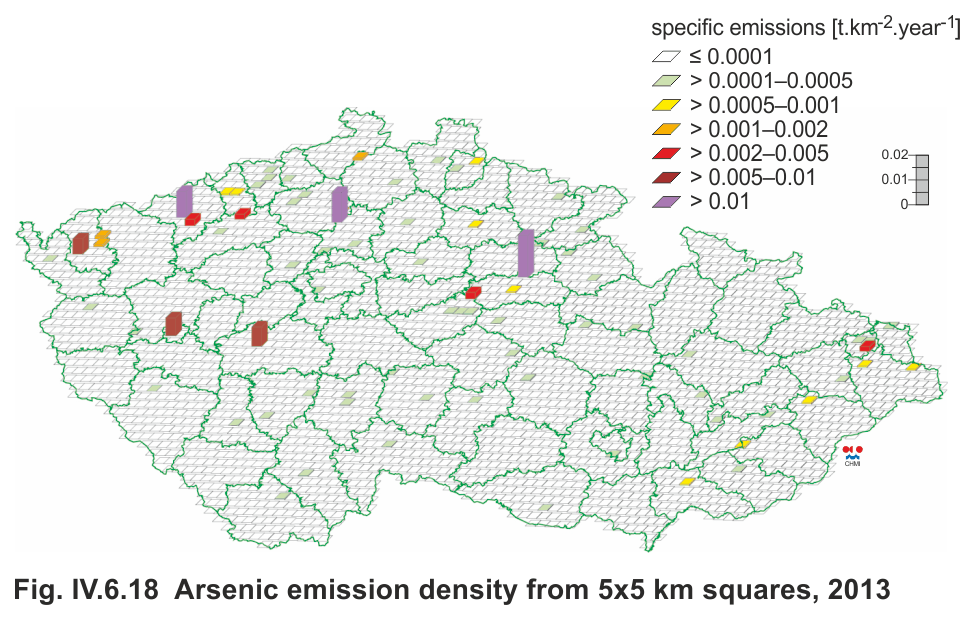
Fig. IV.6.18 Arsenic emission density from 5x5 km squares, 2013
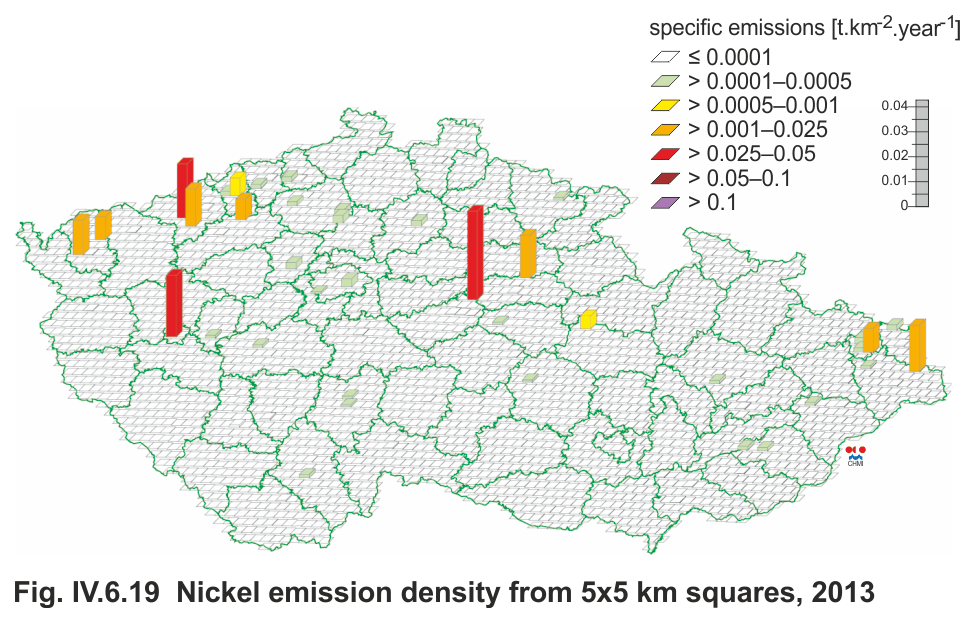
Fig. IV.6.19 Nickel emission density from 5x5 km squares, 2013
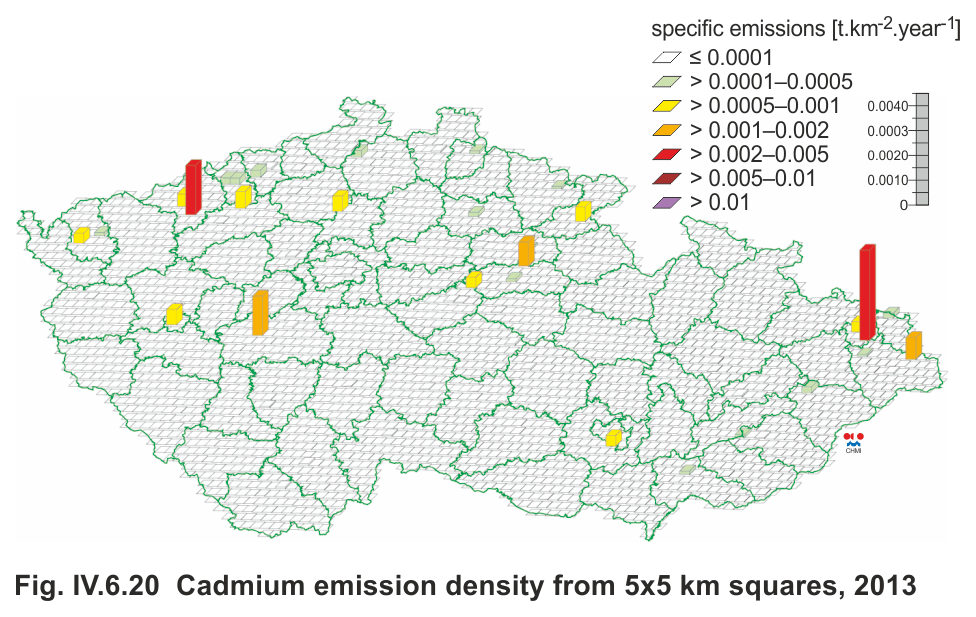
Fig. IV.6.20 Cadmium emission density from 5x5 km squares, 2013
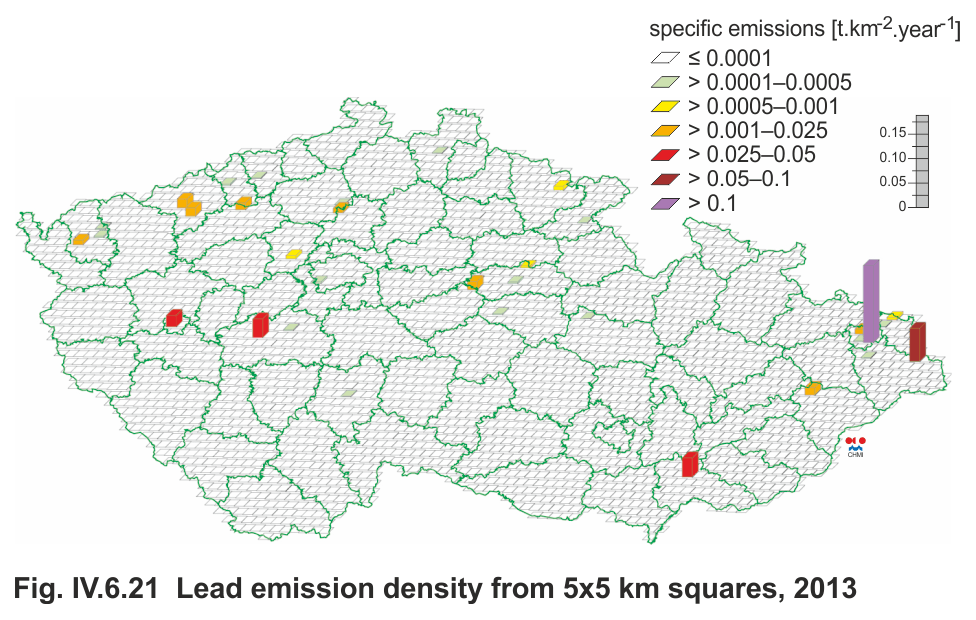
Fig. IV.6.21 Lead emission density from 5x5 km squares, 2013