IV.4 GROUND-LEVEL OZONE
IV.4.1 Air pollution caused by ground-level ozone in the year
2014
Air pollution caused by ground-level ozone in the year 2014 with regard to the limit values for the protection of human health
In 2014 ozone (O3) was measured at 62 localities, out of which 9.7 % (6 localities) exceeded the limit value of 120 µg.m-3 within the three-year period of 2012–2014 or shorter (Table XIII.10, Fig. IV.4.5). In comparison with the previous three-year period of 2011–2013, the number of exceedances of the limit value decreased at 74 % of localities (46 localities), 19 % (12 localities) recorded increases, and 7 % (4 localities) did not record any difference.
Comparison of the evaluated three-year periods shows that an important role was played by emission precursors and meteorological conditions, i.e. the intensity of solar radiation, temperature and precipitation or relative humidity (Blanchard et al. 2010; Ooka et al. 2011). However, the relation between the amount of emitted precursors and ground-level ozone concentrations is not linear. This non-linearity is caused by long-range transport of O3 and its precursors, besides other factors including climate change, emissions of NMVOC from vegetation and forest fires (EEA 2013a). With regard to the rather complicated atmospheric chemical processes involved in ozone formation and disintegration, its dependence on the absolute amount and relative share of its precursors in the atmosphere, connected also with long-range transport, and also on meteorological conditions (Chap. IV.4.3), it is difficult to comment on the year-to-year changes in more detail.
Traffic localities in cities are the least loaded, as ozone is degraded there through chemical reaction with NO (for more details, see Chapter IV.4.3). It can be expected that ozone concentrations are below the limit value also in other cities with heavy traffic loads where, however, due to the absence of measurements, the probable decrease cannot be documented by the use of current methods of map construction. On the contrary, the highest concentrations are measured at rural background localities (Table XIII.10). Similar conclusions were reached also by Munir et al. (2012), who studied the influence of road transport on the concentrations of ground-level O3. Their results show that concentrations of ground-level O3 measured in cities are up to 26 % lower than concentrations measured in rural areas. At the same time, 86 % of the variability in O3 concentrations between rural and urban localities can be explained by the impact of traffic. Bus transport had the greatest positive impact on the decrease of O3 in cities.
The limit value for O3 was exceeded in 2014 (average for the three-year period 2012–2014) in 5.6 % of the territory of the Czech Republic inhabited by approx. 0.8 % of the population (Fig. IV.4.1). In comparison with the previous year (average for the period 2011–2013), the area of the affected territory increased by 20 % (from 25.6 %).
Table XIII.12 presents the number of hours of the informative threshold value exceedance (180 µg.m-3) for O3 at selected AIM stations for the period of 2000–2014. More detailed evaluation related to the exceedance of the threshold value of 180 µg.m-3 is presented in Chapter VI. – Smog warning and regulatory system.
The annual course of average monthly concentrations of O3 (max. 8-hour running average for the given month) is characterized by the increase of concentrations in spring and summer months (Fig. IV.4.3) due to favourable conditions for ozone formation, such as high intensity of solar radiation, high temperatures and low air humidity. Also in this case, it is apparent that the highest maximum 8-hour running averages are recorded at rural localities, where the most frequent exceedances of the limit value occur (Fig. IV.4.5).
Air pollution caused by ground-level ozone in the year 2014 with regard to the
limit values for the protection of ecosystems and vegetation
Of the total number of 35 rural and suburban stations for which the calculation of the AOT401 exposure index is relevant according to the legislation, the ozone limit value for the protection of vegetation (18,000 µg.m-3.h) was exceeded only at three localities in 2014 (average for the years 2010–2014), namely Štítná n. Vláří with 20,134 µg.m-3.h, Kuchařovice with18,871 µg.m-3.h and Praha 6-Suchdol with 18,022 µg.m-3.h (Table XIII.11). As compared with the previous evaluated period 2009–2013, the number of localities with exceedances increased from 3 % (1 locality) to 9 % (3 localities) of the total number 34 localities evaluated in both periods (at the locality Tobolka-Čertovy Schody, the previous period was not evaluated). Increases of the value of the AOT40 exposure index for the year 2014 as compared with the year 2013 were recorded at 91 % of localities (31 localities), while decreases were recorded at 9 % of localities (3 localities).
IV.4.2 Development of ground-level ozone concentrations
The trend of the 26th highest daily maximum 8-hour running average of O3 concentrations has been decreasing since 1996 (Fig. IV.4.6); two years, however, markedly evade this trend, namely the year 2003 (i.e. average for the three-year period 2001–2003) and the year 2006 (i.e. average for the period 2004–2006). In 2003 the 26th highest value of the maximum 8-hour running average reached the highest level for the whole monitored period. The year 2003 was characterized by markedly above-average concentrations of ground-level ozone throughout Europe (Sicard et al. 2011; Cristofanelli et al. 2007; Pires et al. 2012) with above-average temperatures in the summer period (EEA 2014a). The years 2003 and 2006 were characterized by favourable conditions for the formation of ground-level ozone. Up until 2008, there were several years with limit value (120 µg.m-3) exceedances. In the following years, the 26th highest values of the maximum 8-hour average remained below the limit value. This evaluation apparently shows that higher values are usually reached at rural localities as against urban and suburban background localities (Fig. IV.4.6).
The downward trend of ground-level ozone concentrations was recorded not only in Europe (Sicard et al. 2013; EEA 2013a), but also in USA (Butler et al. 2011). In the years 1990–2010, stations in Europe and USA also recorded decreases of the differences between concentrations measured at rural localities and at urban localities (Paoletti et al. 2014). Simultaneously, these stations recorded decreases of the maximum values measured. This decrease of O3 concentrations is attributed i.a. to the reduction of emission of its precursors, mainly NOx, in developed countries (Sicard et al. 2013).
In 2014, following a continual decrease lasting several years, the AOT40 exposure index (five-year average for the years 2010–2014) exhibited a slight increase (Fig. IV.4.6 and Fig. IV.4.8). Besides the increase of the annual AOT40 exposure index for the year 2014, this increase of the five-year average was to a large part also caused by the shift of the averaging period that no longer included the year 2009, which saw the lowest value of the AOT40 exposure index of the entire monitoring period since the year 2000.
IV.4.3 Formation of ground-level ozone
Ozone (O3) has no significant source of its own in the atmosphere. Ozone is a so-called secondary substance produced during a number of very complicated non-linear photochemical reactions described in detail e.g. by Seinfeld and Pandis (2006). Ozone precursors include nitrogen oxides (NOx) and non-methanic volatile organic compounds (NMVOC), and at the global scale also methane (CH4) and carbon moNOxide (CO) take their part in the process. Photo-lysis of NO2 by radiation of 280–430 nm in wavelength is the principal reaction, during which NO and atomic oxygen are formed. During the reaction of atomic and molecular oxygen, in the presence of a catalyst, O3 molecules are formed. Simultaneous titration of O3 by NO results in the formation of NO2 and O2. If in this reaction O3 is replaced with radicals, its concentrations in the atmosphere grow. A significant role in these reactions is played mainly by the OH-radical.
NOx are formed during all combustion processes. NMVOC are emitted from a whole number of anthropogenic sources (transport, manipulation with crude oil and its derivatives, refineries, paint and solvent use etc.), but also natural sources (e.g. biogenic emissions from vegetation).
During the formation of O3 from its precursors, not only the absolute amount of the precursors is important, but also their mutual proportion (Sillman et al. 1990; Fiala, Závodský 2003). In areas where ozone formation is limited by NOx, characterized by relatively low concentrations of NOx and high concentrations of VOC, O3 concentrations grow with the growing concentrations of NOx, while with growing VOC concentrations they change only a little. On the contrary, in areas where O3 formation is limited by VOC, O3 concentrations decrease with growing NOx concentrations, and they increase with growing VOC concentrations. Areas where the proportion between NOx and VOC is high are typically polluted areas around the centres of large cities. The dependence of the formation of O3 on the initial concentrations of VOC and NOx is often depicted by diagrams of ozone isopleths which show the maximum ozone concentrations reached as the function of initial concentration of NOx and VOC (Moldanová 2009). A significant role in the formation of ozone is played not only by its precursors, but also by meteorological conditions (Colbeck, Mackenzie 1994). Ambient air pollution concentrations of O3 grow with increasing ultraviolet radiation and temperature, while, conversely, they decrease with increasing relative humidity.
High ozone concentrations are usually related to long-lasting
anticyclonic situations. In addition to the photochemical
mechanism described above, O3 concentrations may also occur
episodically when stratospheric ozone reaches the troposphere
and also during storms. Recently increasing is the significance
of long-range transport of O3 from source areas in south-east
Asia to Europe and North America by air currents within the
Northern Hemisphere. Ozone is removed from the atmosphere by a
reaction with NO and by dry deposition.
Tab. XIII.11 Stations with the highest AOT40 values of ozone at rural and suburban stations
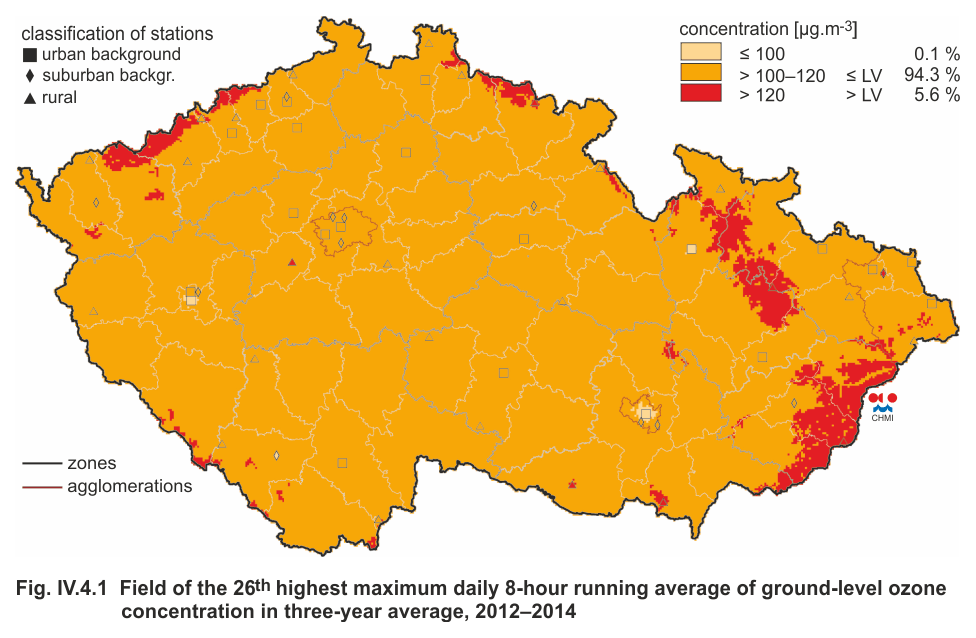
Fig. IV.4.1 Field of the 26th highest maximum daily 8-hour
running average of ground-level ozone concentration in three-year
average, 2012–2014
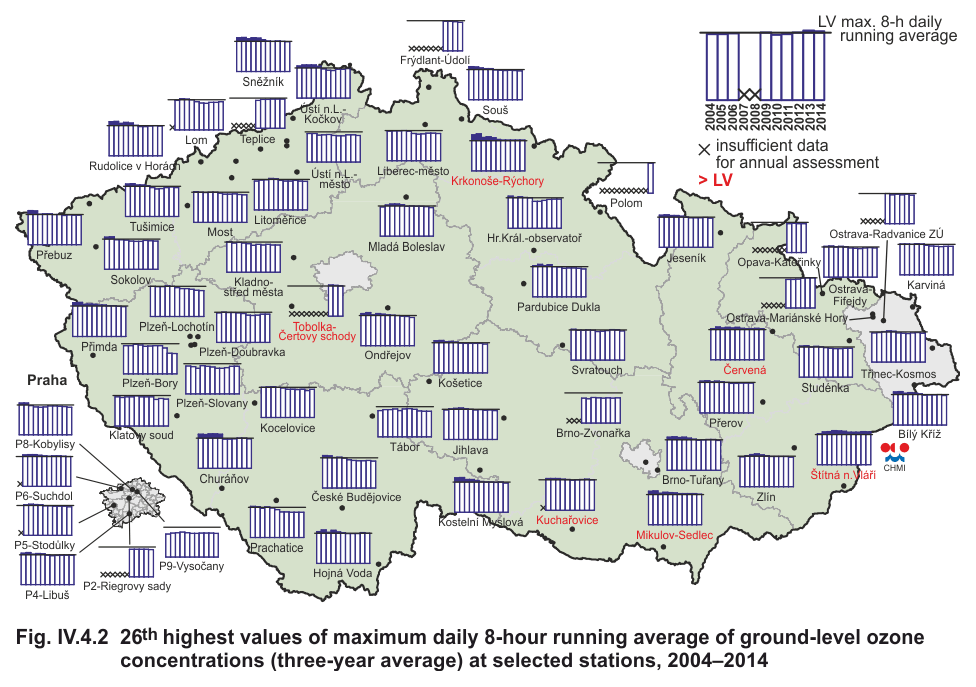
Fig. IV.4.2 26th highest values of maximum daily 8-hour running
average of ground-level ozone concentrations (three-year average)
at selected stations, 2004–2014
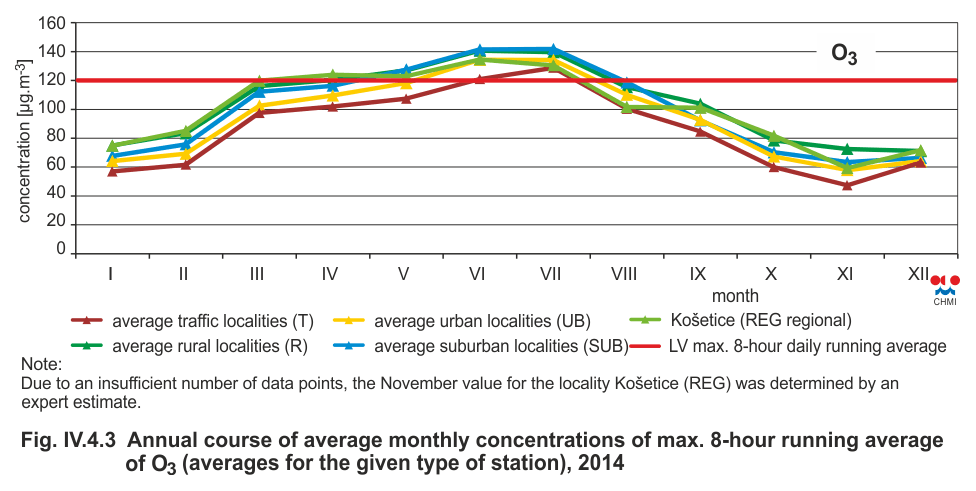
Fig. IV.4.3 Annual course of average monthly concentrations of
max. 8-hour running average of O3 (averages for the given type
of station), 2014
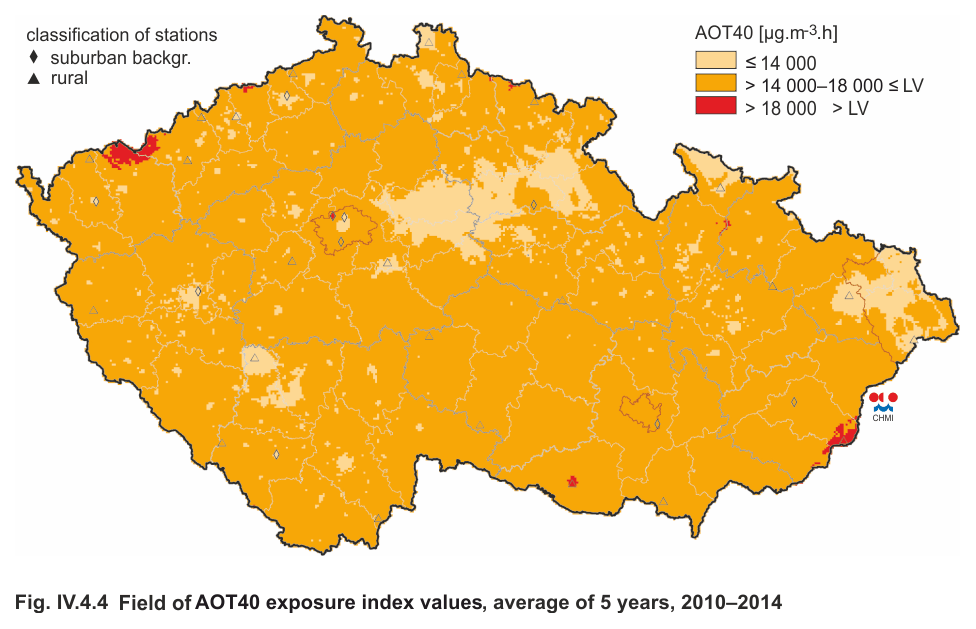
Fig. IV.4.4 Field of AOT40 exposure index values, average of 5
years, 2010–2014
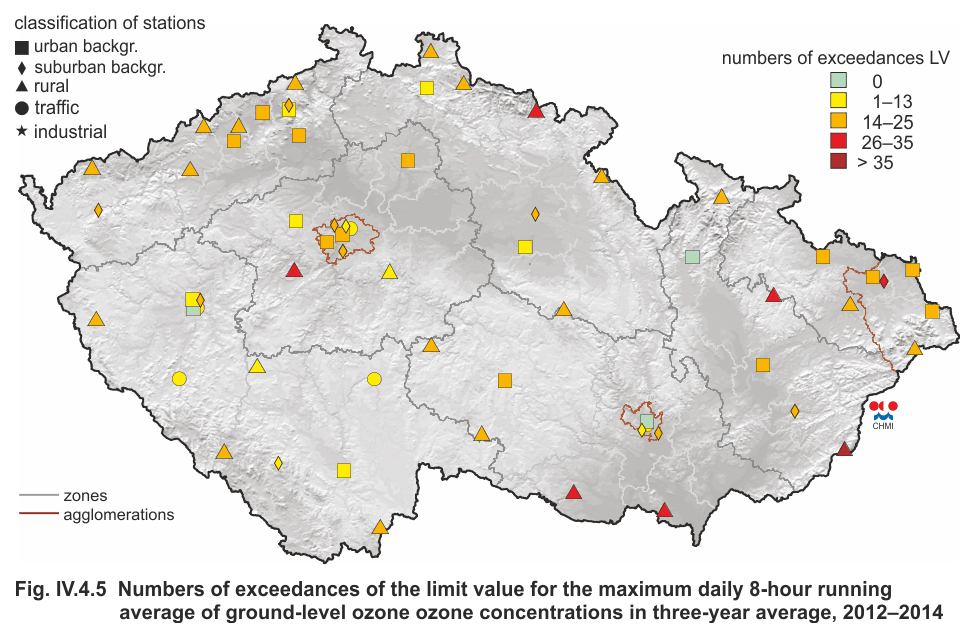
Fig. IV.4.5 Numbers of exceedances of the limit value for the
maximum daily 8-hour running average of ground-level ozone
concentrations in three-year average, 2012–2014
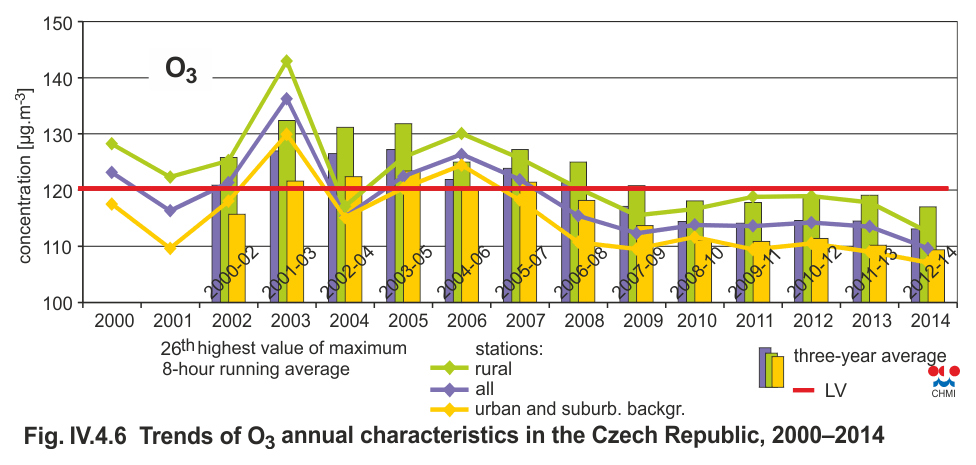
Fig. IV.4.6 Trends of O3 annual characteristics in the Czech
Republic, 2000–2014
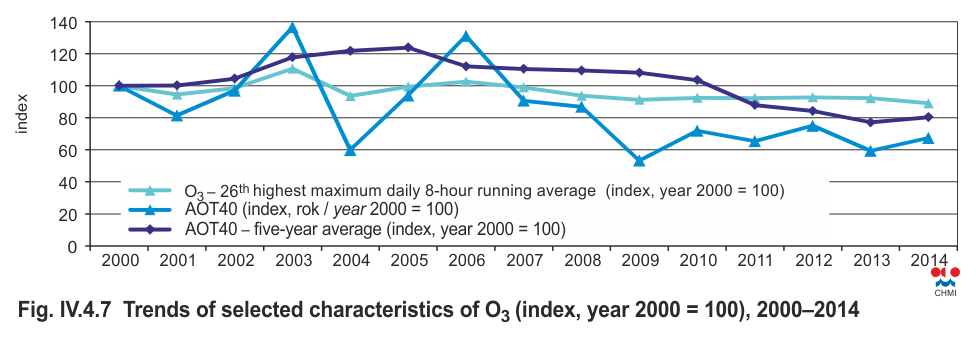
Fig. IV.4.7 Trends of selected characteristics of O3 (index,
year 2000 = 100), 2000–2014
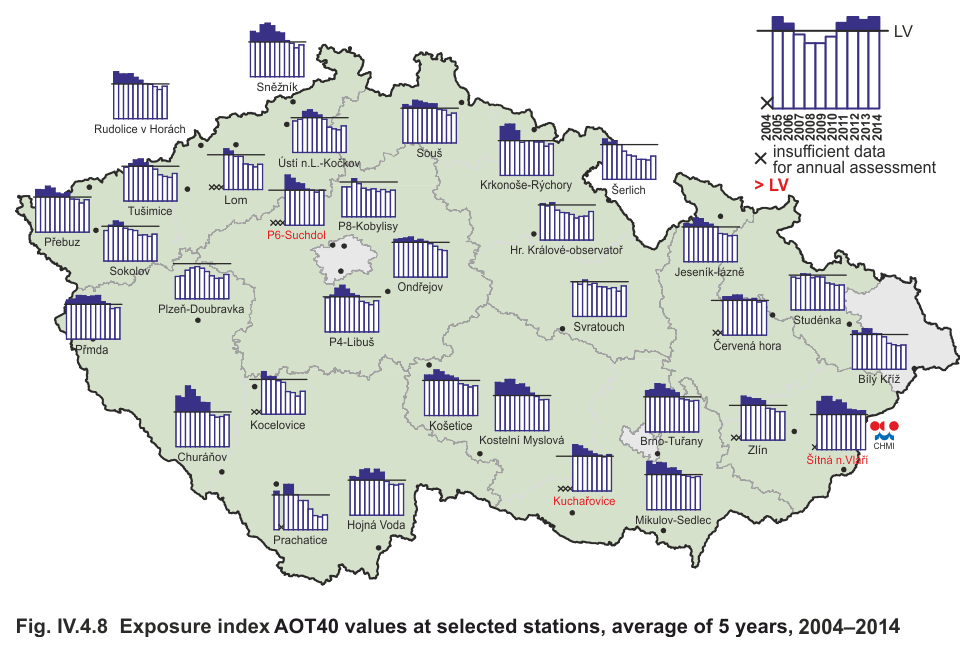
Fig. IV.4.8 Exposure index AOT40 values at selected stations,
average of 5 years 2004–2014
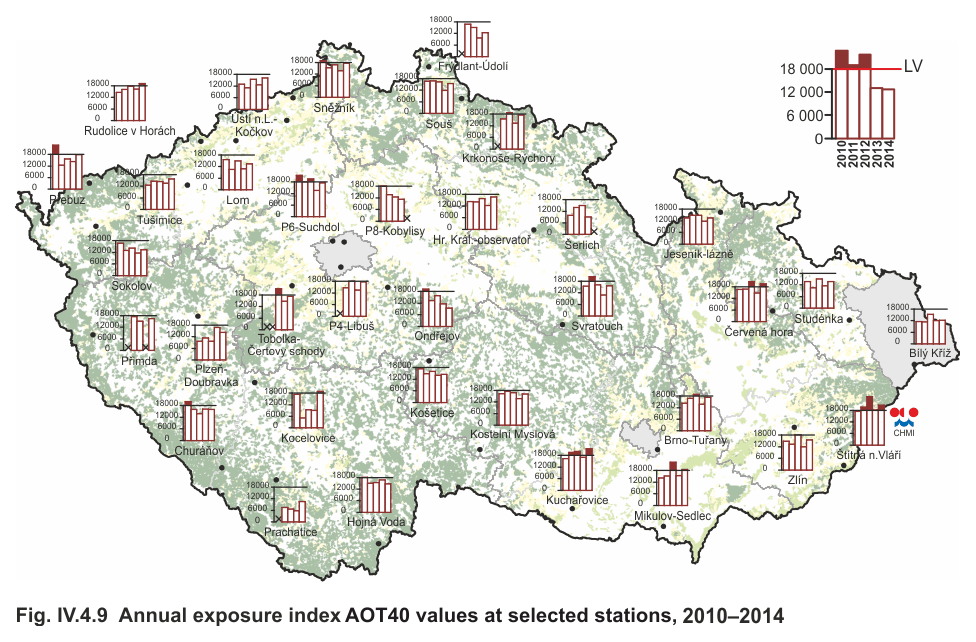
Fig. IV.4.9 Annual exposure index AOT40 values at selected
stations, 2010–2014
1For the evaluation of vegetation protection against excessive concentrations of ozone, the national legislation uses, in compliance with the respective EU Directive, the AOT40 exposure index. AOT40, as a measure of cumulative exposure to ozone, is calculated as the sum of differences between hourly ozone concentration and the threshold level of 80 µg.m-3 (= 40 ppb) for each hour when this threshold value was exceeded. Pursuant to the requirements of Government Order No. 597/2006 Coll., AOT40 is calculated for the period of three months (May to July) measured between 8:00 and 20:00 Central European Time (= 7:00 and 19:00 UTC).