IV.3 NITROGEN OXIDES
IV.3.1 Air pollution caused by nitrogen oxides in the year 2014
In the field of ambient air monitoring and evaluation, the term nitrogen oxides (NOx) is used for the mixture of nitrogen monoxide (NO) and nitrogen dioxide (NO2). The air pollution limit value for the protection of human health is set for NO2 whereas the limit value for the protection of ecosystems and vegetation is set for NOx.
Air pollution caused by nitrogen dioxide in the year 2014 with regard to the
limit values for the protection of human health
Exceedances of annual limit values for NO2 occur only at a limited number of stations, especially those exposed to traffic in agglomerations and large cities. Of the total number of 94 localities at which NO2 was monitored in 2014, the annual limit value was exceeded at 4.3 % (4 localities; Table XIII.8). All four stations are classified as traffic urban localities. It can therefore be expected that exceedances of the limit values can also occur at other sites exposed to traffic where no monitoring is carried out.
In 2014, 1-hour NO2 concentrations exceeded the limit value of 200 µg.m-3 at 2 stations (Table XIII.7). Nevertheless, neither of them reached the permissible number of 18 days with exceedances per calendar year (the Prague 2-Legerova hot spot station registered six exceedances, and station Brno-Svatoplukova registered one exceedance).
Higher levels of air pollution in towns and cities compared to out-of-town stations are caused mainly by traffic. The highest values of NO2 concentrations are reached in Prague, Brno and Ostrava (Fig. IV.3.1). However, most of the territory of the Czech Republic (99.7 %) recorded annual average concentrations lower than 26 µg.m-3, i.e. the value of the lower assessment threshold. Higher NO2 concentrations can be measured also near local communications in settlements with intensive traffic and a dense local road network. In 2014 limit-exceeding concentrations of NO2 affected 0.15 % of the population and 0.001 % of the area of the Czech Republic.
Fig. IV.3.7 presents graphs of the annual courses of daily concentrations of NO2 in 2014, showing exceedances of the limit value at selected localities.
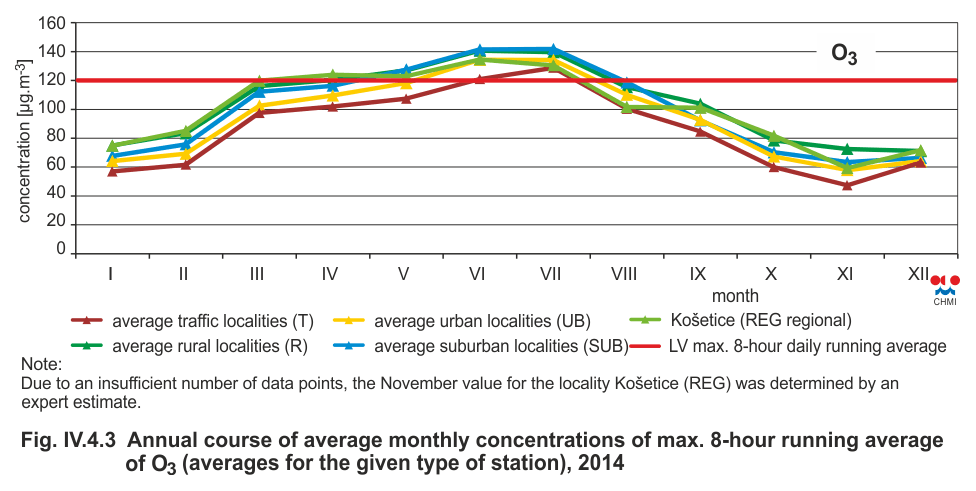
Traffic localities measure higher NO2 concentrations than other types of localities. In the period of April–September, there was a marked decrease of NO2 concentrations at all localities (Fig. IV.3.4) The decrease was caused by a higher intensity of solar radiation (mainly of wavelength < 400 nm) in this season of the year, which results in photodissociation of NO2 into NO and O (Warneck 2000). Under the right conditions, ground-level ozone is formed from the products of photodissociation, so concentrations of ground-level ozone are higher in the period of April–September (Fig. IV.4.3).
Air pollution caused by nitrogen oxides in the year 2014 with regard to the
limit values for the protection of ecosystems and vegetation
The number of localities classified as rural increased from 13 in 2013 to 14 in 2014. None of the stations exceeded the limit value for the annual average concentration of NOx (30 µg.m-3) in 2014 (Table XIII.9 and Fig. IV.3.10). At 67 % of the stations (8 localities) which monitored NOx in both years, the average annual NOx concentration decreased as compared with the year 2013.
The map of the spatial distribution of annual average NOx concentrations is constructed based on the combination of measurement and modelling. All stations measuring NOx were used for the construction of the map of the field of NOx. The above-mentioned data on emissions from mobile sources in the Czech Republic were also regarded. Higher NOx concentrations can also occur near local communications in settlements with intensive traffic and a dense local transport network, where concentrations are not measured. The spot symbols only highlight rural stations (Fig. IV.3.3) because the level of annual NOx concentrations with regard to the limit value for the protection of ecosystems and vegetation is evaluated only for these localities.
This chapter is closed by graphs of the courses of 24-hour NOx concentrations for selected localities with higher annual averages of NOx concentrations in 2014 (Fig. IV.3.8). Higher 24-hour concentrations of NOx were recorded in the period from January to March and from October to December This was probably caused by deteriorated dispersion conditions, which are more frequent in winter periods, and also by increased NOx emissions from local heating (Warneck 2000).
IV.3.2 The development of nitrogen oxides concentrations
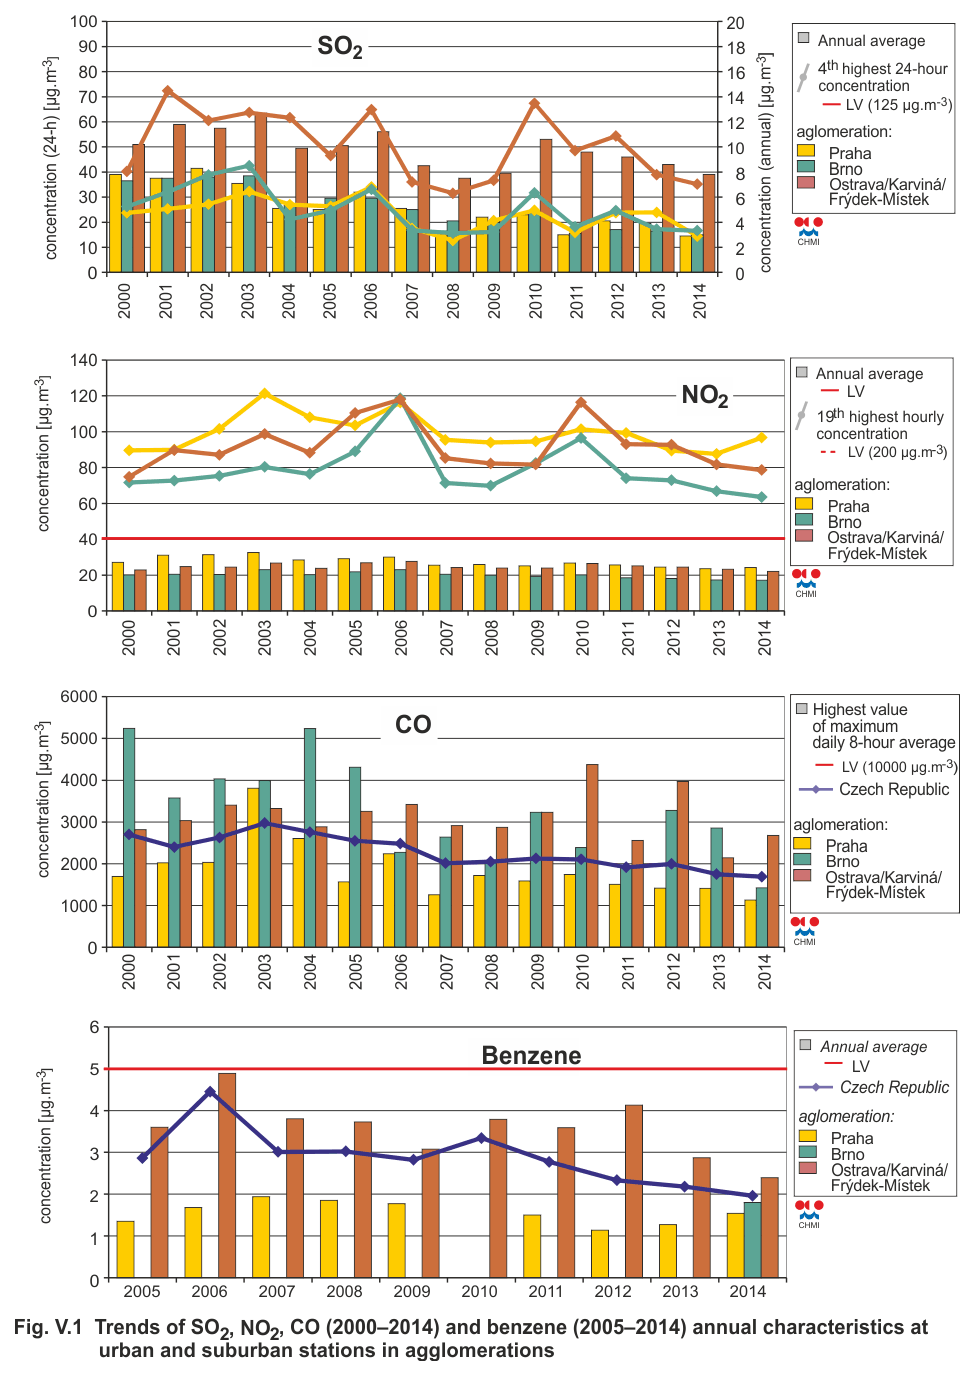
A marked decrease of both annual average concentrations of NO2 and NOx as well as the 19th highest 1-hour concentrations of NO2 occurred during the 90s.This was caused by a steep decrease of emissions in this period after Act No. 309/1991 Coll. came into force and after the consequent implementation of new technological measures aimed at reducing emissions. The change in the structure of industrial branches and the composition of the car fleet together with new types of fuels also had their influence. The course of year-to-year changes in concentrations of NO2 and NOx, but also of other pollutants, is significantly influenced by meteorological and dispersion conditions. The relatively steep downward trend from the 90s of the 20th century continued up to the year 2000.
Since this year, increases of both annual average concentrations and the 19th highest hourly concentrations alternate with decreases of the same measures (Fig. IV.3.5). The most marked increases of concentrations were recorded in the years 2003, 2006 and 2010, probably as a result of unfavourable meteorological and dispersion conditions which occurred in these years. Since 2011, all monitored characteristics exhibit a gradually declining trend (Fig. IV.3.6).
The highest values were reached within the whole monitored period (2000–2014) in the agglomeration of Prague and the agglomeration of O/K/F-M (Fig. V.1). This is caused by very high traffic loads in these areas, and in the case of the O/K/F-M agglomeration also by industrial emissions. In Prague, for instance, traffic is currently the most significant source of nitrogen oxide emissions (ENVIS 2012). The lowest levels, by contrast, are reached in the agglomeration of Brno and in the Ústí nad Labem region.
IV.3.3 Emissions of nitrogen oxides
Emissions of NOx are formed during the combustion of fuels in dependence on the temperature of combustion, the content of nitrogen in fuels and the excess of combustion air. Emissions of NOx are formed also during some chemical-technological processes (production of nitric acid, ammonia, fertilizers etc.). While in the combustion of fuels, the share of NO2 in emissions of NOx usually varies in the interval of up to 5 %, in some chemical-technological processes, the share of NO2 can amount even to 100 % of NOx emissions (Neužil 2012).
The greatest amount of NOx emissions is generated by traffic. The sectors 1A3biii-Road transport: Heavy duty vehicles and buses, 1A3bi-Road transport: Passenger cars and 1A4cii-Off-road vehicles and other machinery from agriculture/forestry/fishing contributed to the total country-wide emissions of NOx by 39 % in the year 2013 (Fig. IV.3.11). Sector 1A1a-Public electricity and heat production contributed by 32.8 % of NOx emissions released into the air. The downward trend of NOx emissions in the period 2007–2013 is connected primarily with the natural renewal of the car fleet and the implementation of emission ceilings for NOx emissions from sources in the sector of public electricity and heat production (Fig. IV.3.12).
The contributions of individual types of sources to total emissions differ depending on the particular mix of sources in the given area. Production of NOx emissions is mainly concentrated along motorways, in big cities and in the Ústí nad Labem region, the Central Bohemia region and the Moravia-Silesia region, where significant producers of energy are located (Fig. IV.3.13).
Tab. XIII.7 Stations with the highest values of the 19th and
maximum hourly concentrations of NO2
Tab. XIII.8 Stations with the highest values of annual average concentrations of NO2
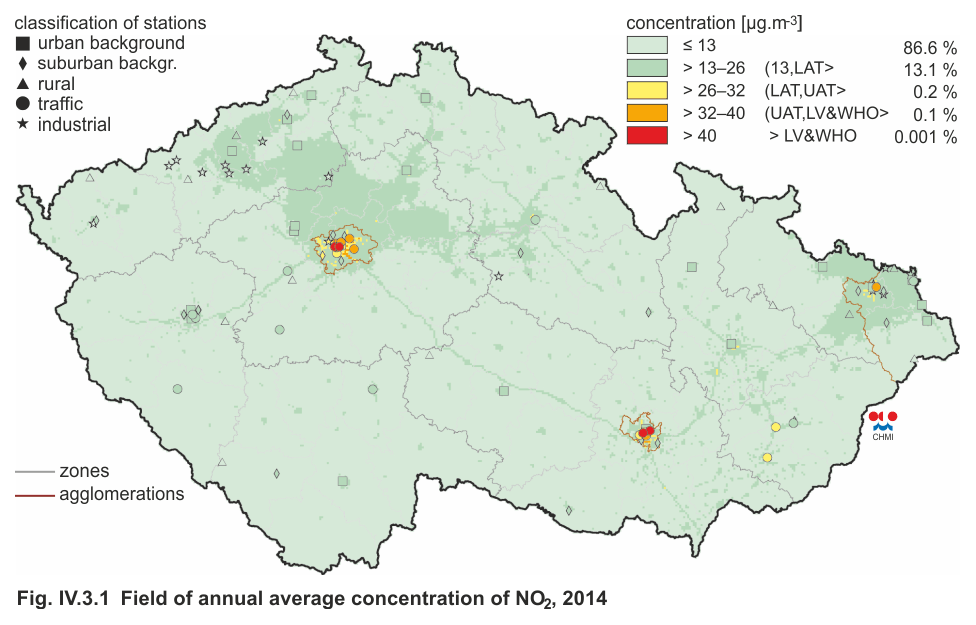
Fig. IV.3.1 Field of annual average concentration of NO2,
2014
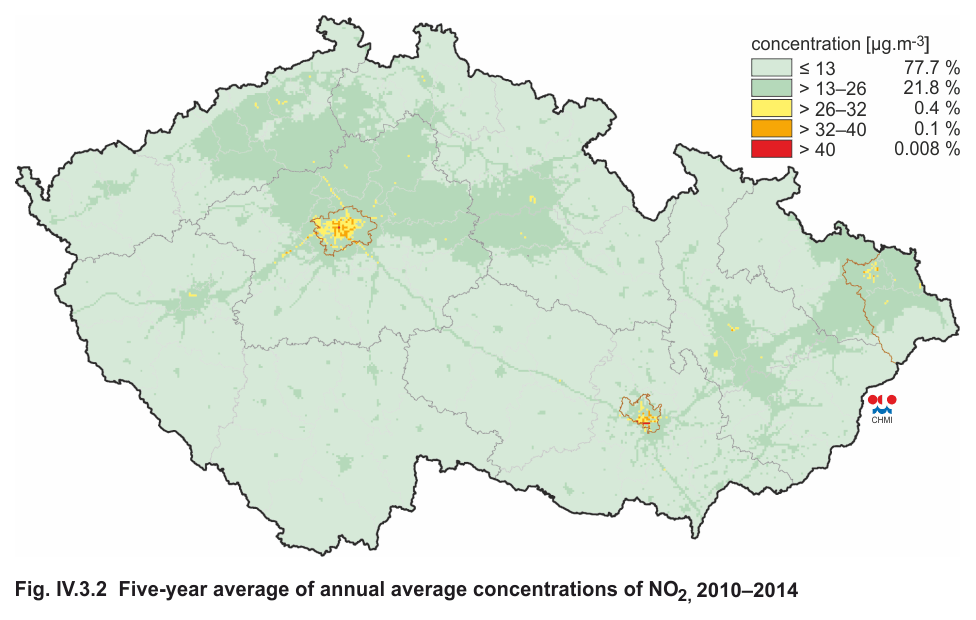
Fig. IV.3.2 Five-year average of annual average concentrations
of NO2, 2010–2014
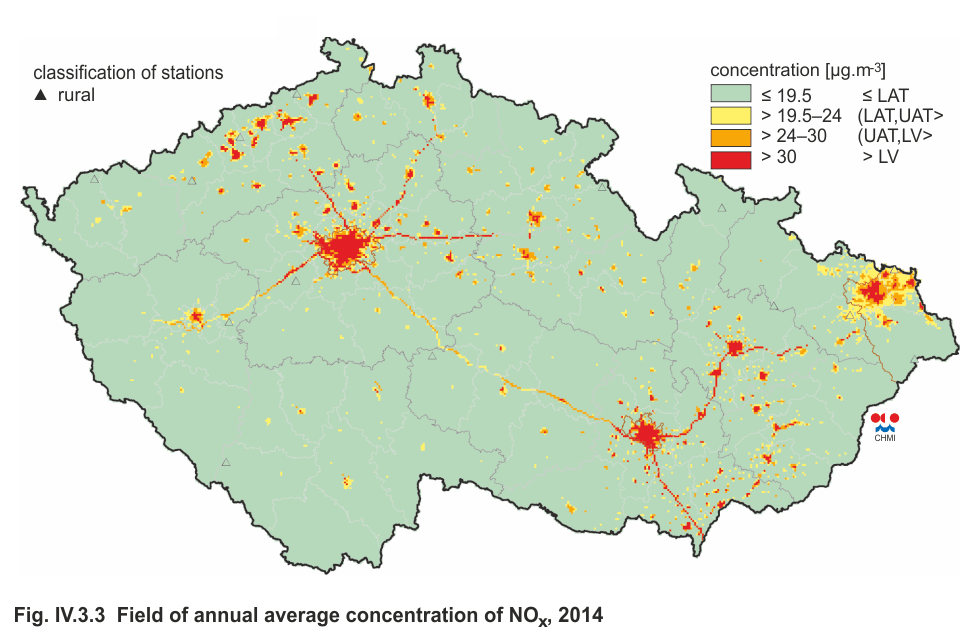
Fig. IV.3.3 Field of annual average concentration of NOx, 2014
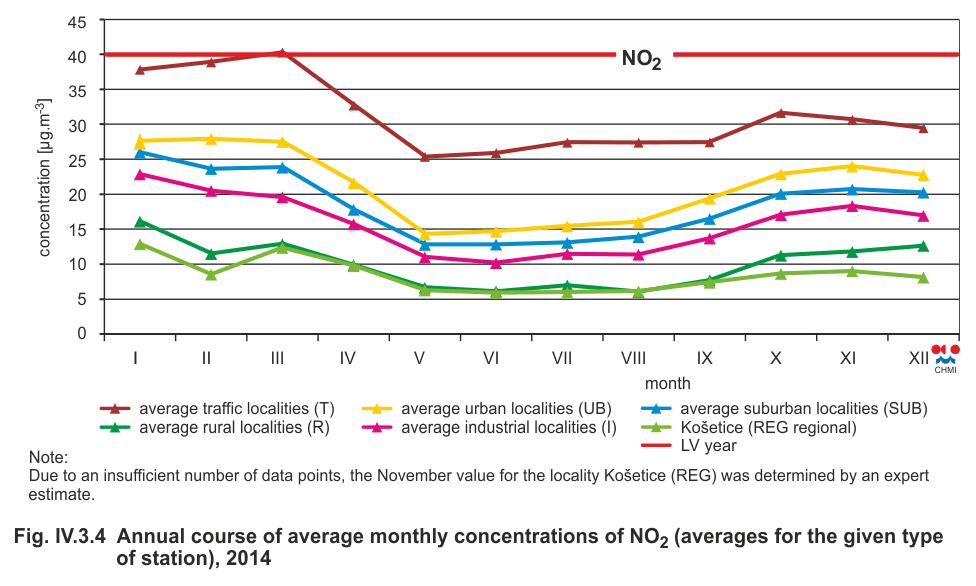
Fig. IV.3.4 Annual course of average monthly concentrations of
NO2 (averages for the given type of station), 2014
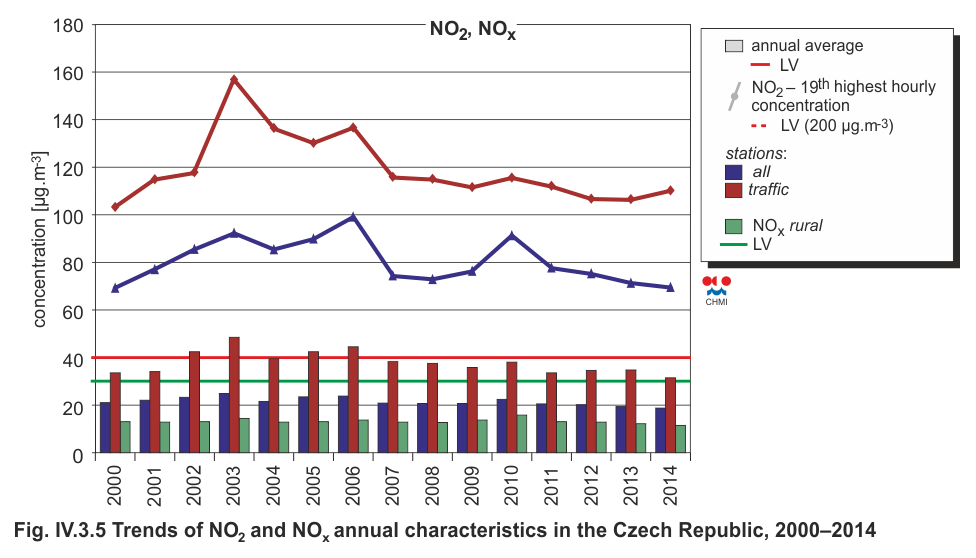
Fig. IV.3.5 Trends of NO2 and NOx annual characteristics in the
Czech Republic, 2000–2014
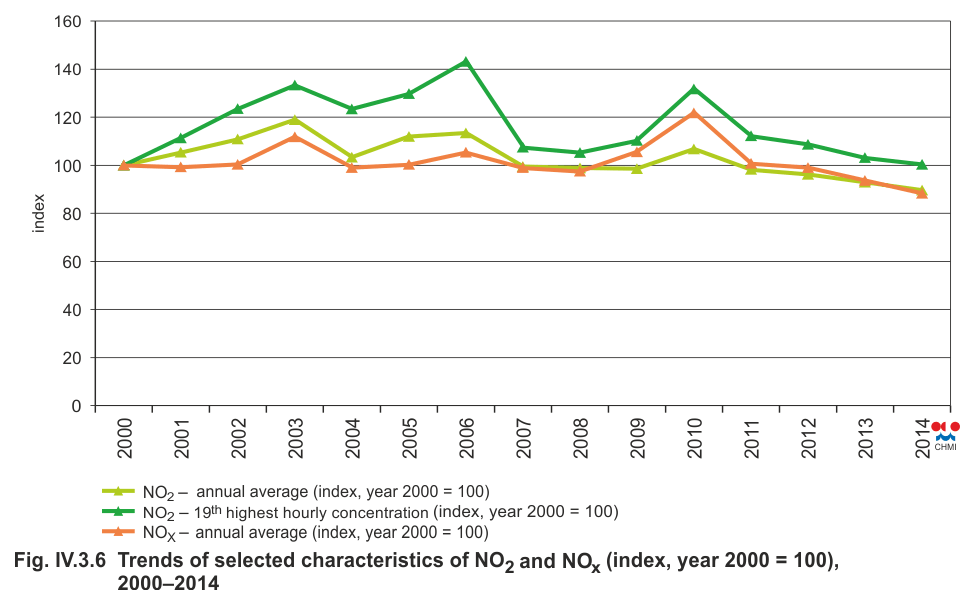
Fig. IV.3.6 Trends of selected characteristics of NO2 and NOx
(index, year 2000 = 100), 2000–2014
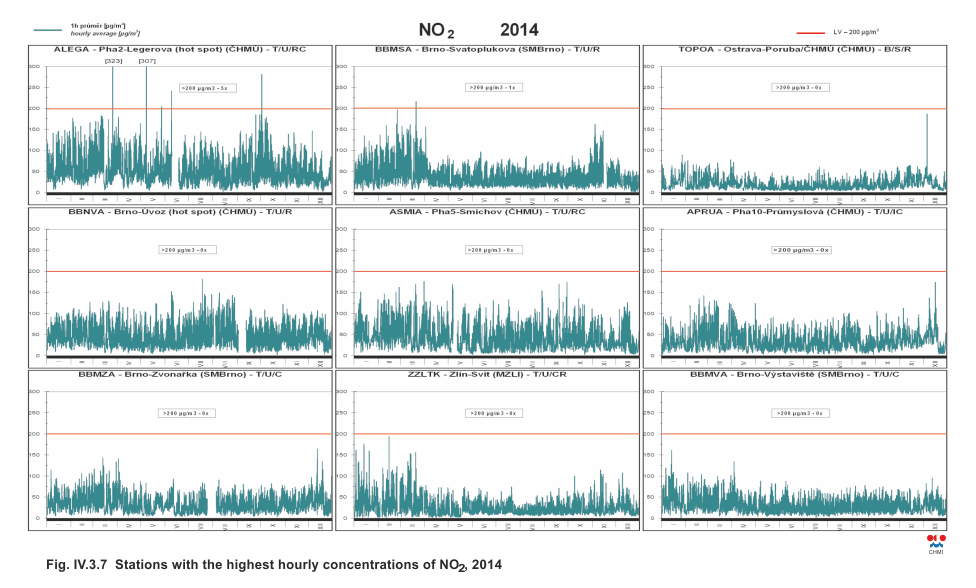
Fig. IV.3.7 Stations with the highest hourly concentrations of
NO2, 2014
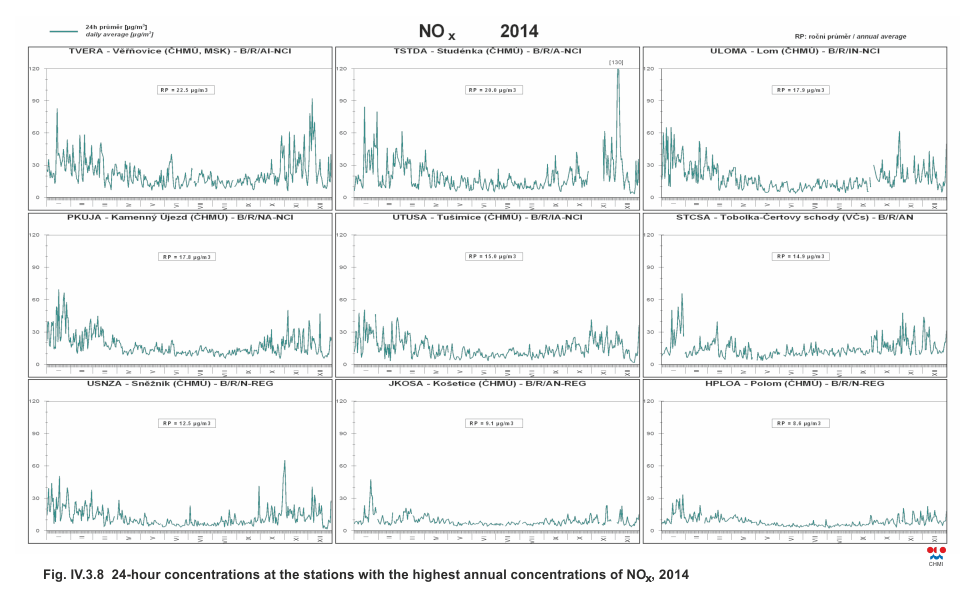
Fig. IV.3.8 24-hour concentrations at the stations with the
highest annual concentrations of NOx, 2014
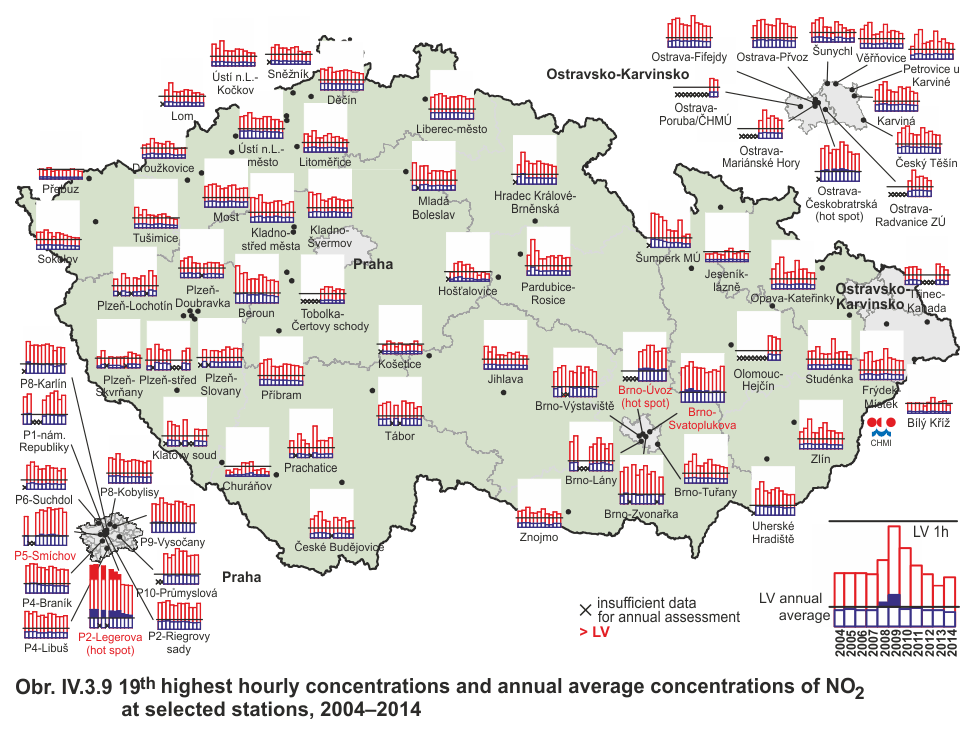
Fig. IV.3.9 19th highest hourly concentrations and annual
average concentrations of NO2 at selected stations, 2004–2014
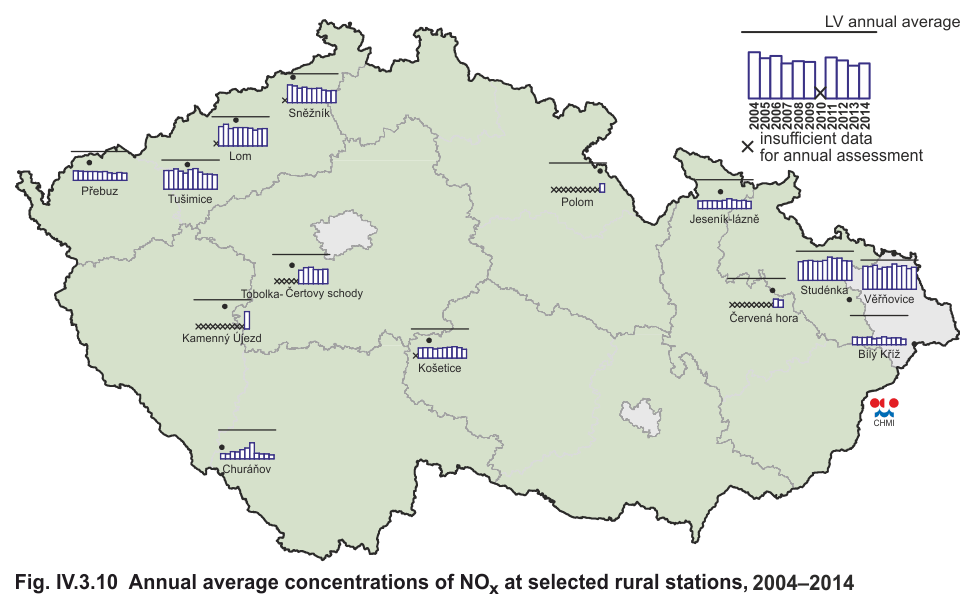
Fig. IV.3.10 Annual average concentrations of NOx at selected
rural stations, 2004–2014
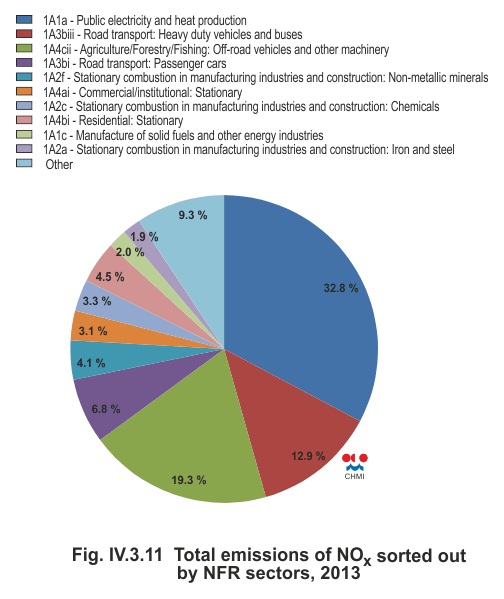
Fig. IV.3.11 Total emissions of NOx sorted out by NFR sectors,
2013
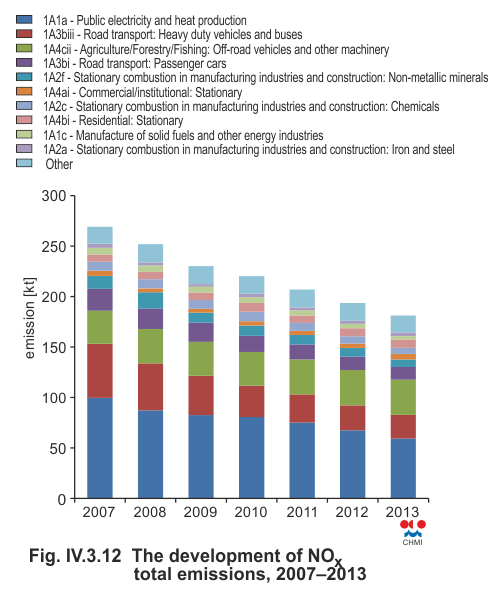
Fig. IV.3.12 The development of NOx total emissions, 2007–2013
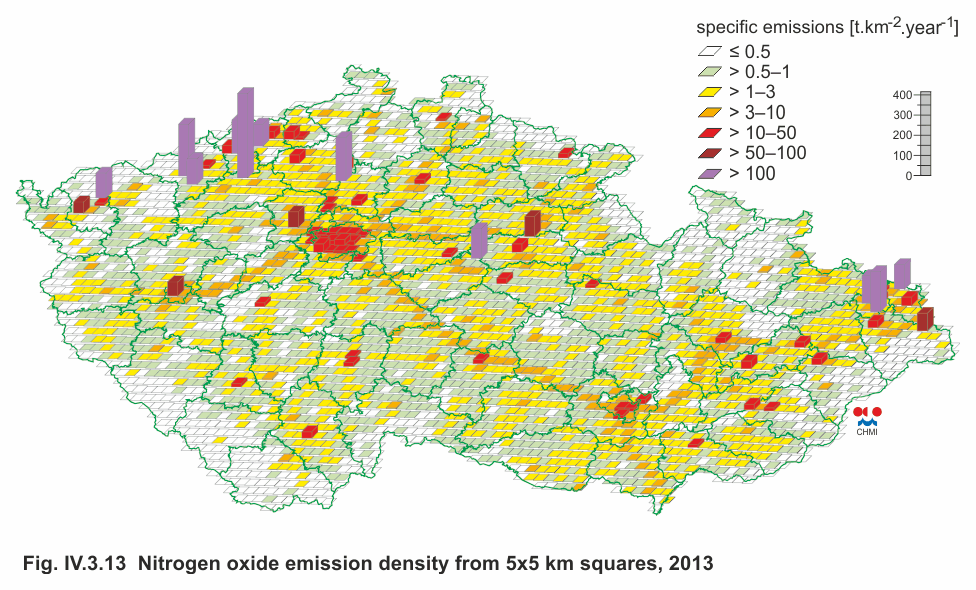
Fig. IV.3.13 Nitrogen oxide emission density from 5x5 km squares,
2013